Corporate governance drives trust. It protects investors. It improves transparency. Moreover, it builds long-term sustainability. However, many organizations still track governance data in scattered spreadsheets. As a result, leaders struggle to see risks clearly. They miss compliance gaps. They delay critical decisions.
So, how can you monitor governance performance in a structured and visual way?
The answer is simple.
You need a Corporate Governance Dashboard in Excel.
Click to Purchases Corporate Governance Dashboard in Excel
In this detailed guide, you will learn:
-
What a Corporate Governance Dashboard in Excel is
-
Why organizations need it
-
Key metrics and KPIs included
-
Explanation of all 5 analytical pages
-
Advantages of using this dashboard
-
Best practices for using it effectively
-
Frequently Asked Questions with answers
Let’s explore everything step by step.
What Is a Corporate Governance Dashboard in Excel?
A Corporate Governance Dashboard in Excel is a structured, ready-to-use reporting system that helps organizations track governance, compliance, ESG scores, audit findings, risk categories, and committee performance in one centralized Excel file.
Instead of reviewing multiple reports, you can:
-
Track open and resolved cases
-
Monitor ESG scores
-
Analyze governance ratings
-
Measure attendance percentages
-
Evaluate audit findings
-
Review risk categories
-
Compare regional performance
-
Track monthly governance trends
Moreover, the dashboard uses interactive slicers and page navigation. Therefore, users can filter and analyze data instantly.
In short, it transforms raw governance data into meaningful insights.
Why Do Organizations Need a Corporate Governance Dashboard?
Corporate governance affects reputation, legal compliance, and investor confidence. However, when companies track governance manually, they face several issues:
-
Delayed reporting
-
Inconsistent data
-
Lack of transparency
-
Limited risk visibility
-
Poor accountability tracking
Therefore, organizations need a structured solution.
A Corporate Governance Dashboard in Excel helps leaders:
-
Identify governance gaps early
-
Improve compliance monitoring
-
Track ESG performance
-
Reduce audit risks
-
Strengthen board accountability
-
Improve transparency
As a result, management can take proactive decisions instead of reactive actions.
Key Features of the Corporate Governance Dashboard in Excel
This ready-to-use dashboard includes smart design and powerful analytics.
1️⃣ Page Navigator (Left-Side Navigation)
The dashboard includes a page navigator located on the left side. Therefore, users can switch between analytical pages instantly.
Instead of scrolling through sheets, you simply click and move to:
-
Overview Page
-
Committee Analysis
-
Region Analysis
-
Risk Category Analysis
-
Month Analysis
This improves user experience and saves time.
Dashboard Structure – 5 Powerful Analytical Pages
The dashboard contains 5 structured pages inside the Excel desktop application. Each page focuses on a different governance dimension.
Let us explore each page in detail.
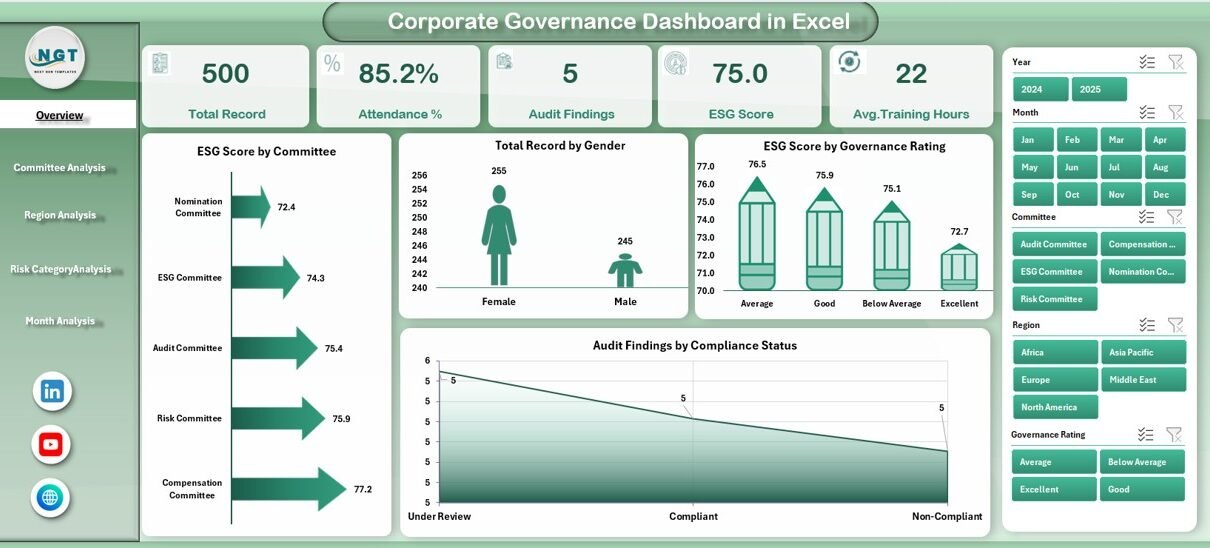
1️⃣ Overview Page – Your Governance Command Center
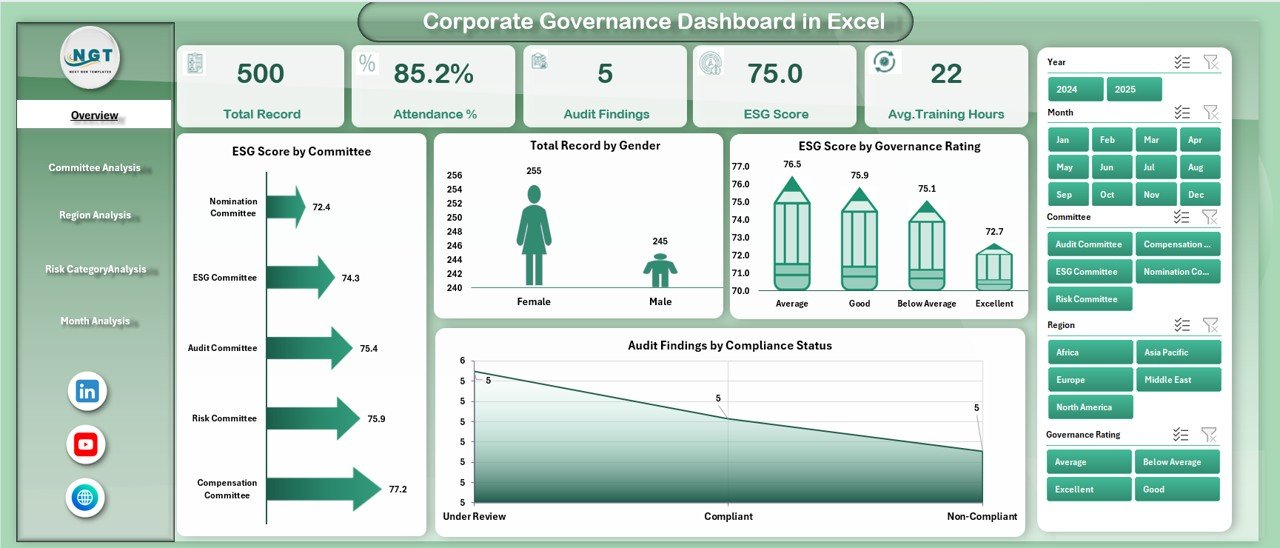
The Overview Page acts as the central summary.
It includes:
🔹 Right-Side Slicer
Users can filter data dynamically. Therefore, you can view governance insights based on selected criteria.
🔹 4 KPI Cards
The dashboard displays 4 key summary cards to show important governance metrics at a glance.
🔹 4 Interactive Charts
-
ESG Score by Committee
-
Total Record by Gender
-
ESG Score by Governance Rating
-
Audit Finding by Compliance Status
Why Is the Overview Page Important?
Because it provides a complete snapshot of governance health.
For example:
-
If ESG score drops for a committee, you can investigate immediately.
-
If audit findings increase in non-compliant areas, you can take action quickly.
-
If governance ratings decline, leadership can review policies.
As a result, decision-making becomes faster and more informed.
2️⃣ Committee Analysis – How Well Do Governance Committees Perform?
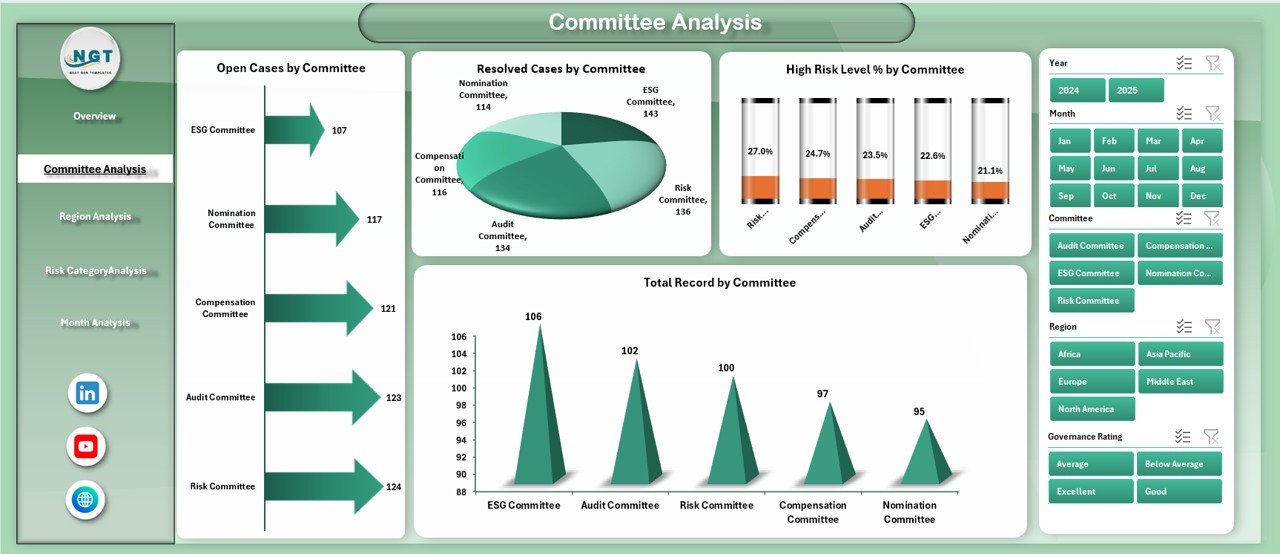
Committees play a vital role in corporate governance. Therefore, organizations must track their performance regularly.
This page includes:
🔹 Right-Side Slicer
You can filter by committee or other dimensions.
🔹 4 Detailed Charts
-
Open Cases by Committee
-
Resolved Cases by Committee
-
High Risk Level % by Committee
-
Total Record by Committee
What Insights Can You Extract?
-
Identify committees with the highest unresolved cases
-
Track resolution performance
-
Detect committees with high risk exposure
-
Compare governance efficiency
Therefore, you can improve accountability and assign corrective actions quickly.
Click to Purchases Corporate Governance Dashboard in Excel
3️⃣ Region Analysis – How Does Governance Perform Across Regions?
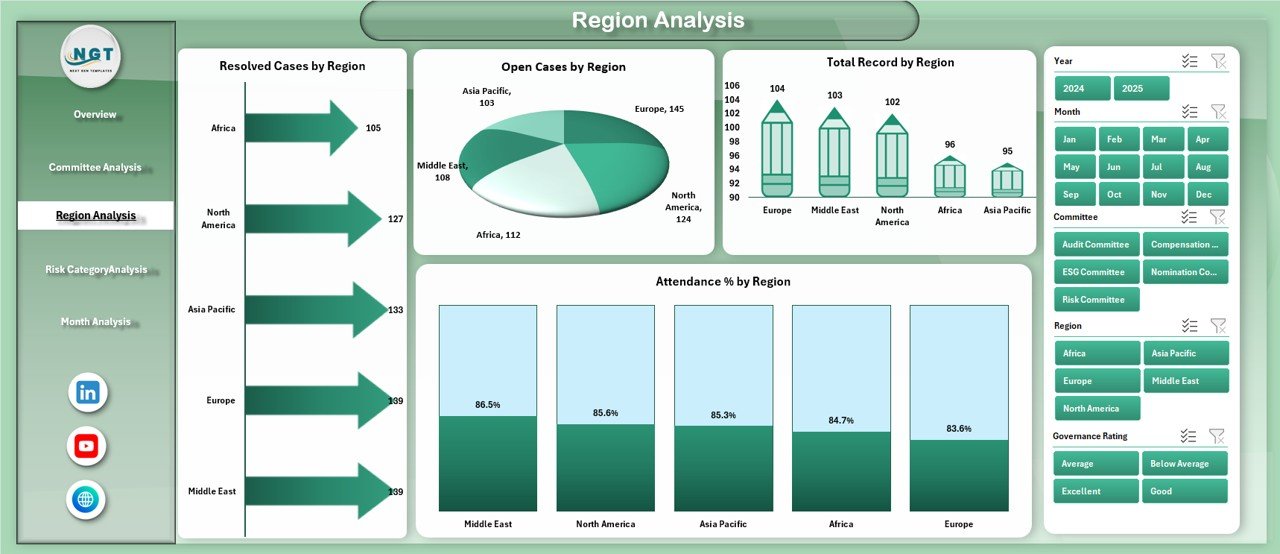
Governance standards may vary across regions. However, organizations must maintain consistent compliance.
This page includes:
🔹 Right-Side Slicer
Filter by region or other attributes.
🔹 4 Regional Charts
-
Open Cases by Region
-
Resolved Cases by Region
-
Total Record by Region
-
Attendance % by Region
Why Is Region Analysis Important?
Because regional governance gaps can expose the company to risk.
For example:
-
If one region shows lower attendance percentage, it may indicate weak oversight.
-
If open cases remain high in a specific region, management must investigate.
As a result, leadership can ensure uniform governance standards.
4️⃣ Risk Category Analysis – Where Are the Major Risks?
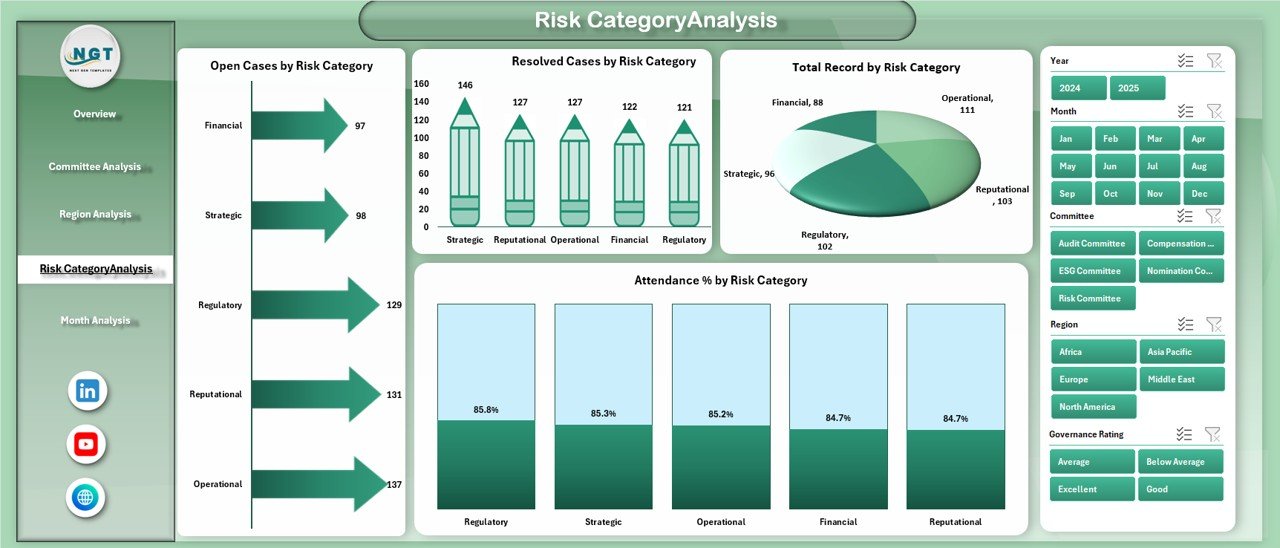
Every organization faces different types of risks.
This page helps you analyze governance performance based on risk categories.
🔹 Right-Side Slicer
Filter by risk category or governance dimension.
🔹 4 Risk-Based Charts
-
Open Cases by Risk Category
-
Resolved Cases by Risk Category
-
Total Record by Risk Category
-
Attendance % by Risk Category
What Can You Achieve?
-
Identify high-risk categories
-
Monitor resolution speed
-
Track governance engagement in risk-heavy areas
-
Reduce compliance exposure
Therefore, you can strengthen risk management strategies.
Click to Purchases Corporate Governance Dashboard in Excel
5️⃣ Month Analysis – Are Governance Trends Improving Over Time?
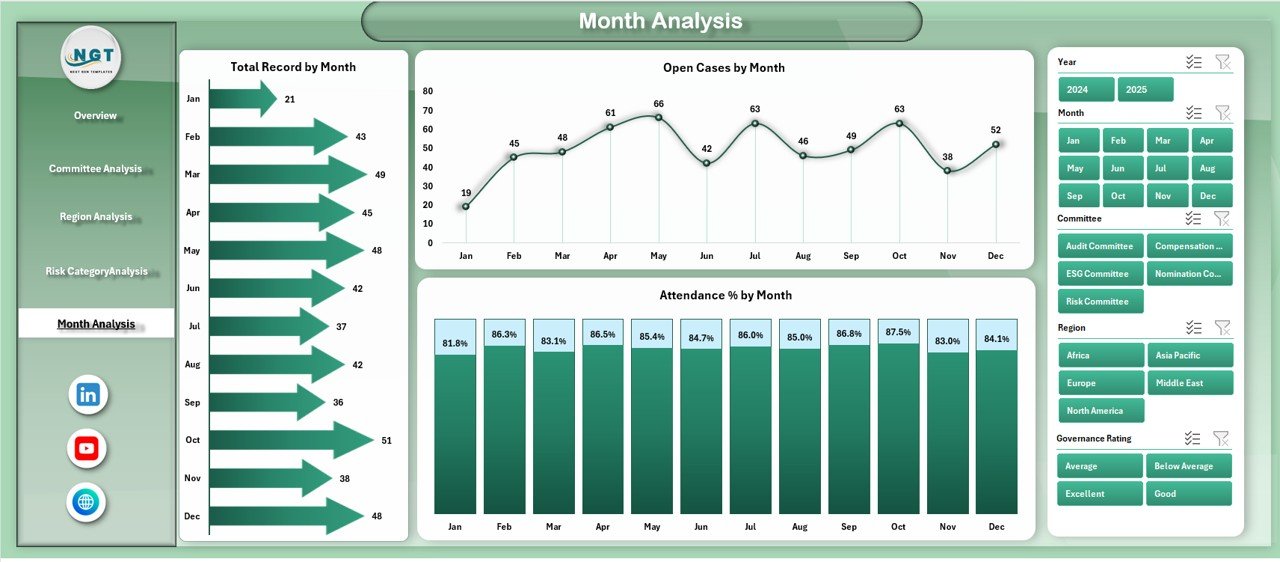
Trends matter.
Short-term data does not reveal the full picture. However, monthly analysis shows patterns.
This page includes:
-
Open Cases by Month
-
Total Record by Month
-
Attendance % by Month
Why Is Monthly Analysis Powerful?
Because it helps you:
-
Track improvement trends
-
Identify seasonal governance challenges
-
Measure compliance progress
-
Monitor ESG performance movement
As a result, you can align governance strategy with long-term goals.
What Data Does the Corporate Governance Dashboard Track?
The dashboard typically captures structured governance data such as:
-
Committee Name
-
Region
-
Risk Category
-
Governance Rating
-
ESG Score
-
Case Status (Open / Resolved)
-
Compliance Status
-
Attendance Percentage
-
Gender Records
-
Month
Because the data sheet supports structured tables, you can update it easily. Moreover, charts refresh automatically.
Advantages of Corporate Governance Dashboard in Excel
Using this dashboard provides multiple strategic benefits.
1️⃣ Improved Transparency
You can view governance metrics in one place. Therefore, stakeholders gain clarity.
2️⃣ Better Risk Visibility
You can detect high-risk committees and categories quickly. As a result, leadership can take preventive action.
3️⃣ Faster Decision-Making
Since data updates instantly, management does not wait for manual reports.
4️⃣ Stronger Compliance Monitoring
You can track audit findings and compliance status in real time.
5️⃣ Enhanced ESG Reporting
You can monitor ESG scores by committee and governance rating easily.
6️⃣ Accountability Improvement
When committees see their performance visually, they take ownership.
7️⃣ Cost-Effective Solution
Excel provides a powerful yet affordable platform.
Therefore, organizations can avoid expensive governance software.
How Does This Dashboard Support ESG Strategy?
ESG performance plays a major role in investor decisions.
This dashboard supports ESG by:
-
Tracking ESG score by committee
-
Analyzing ESG score by governance rating
-
Monitoring compliance-related audit findings
-
Tracking risk exposure
As a result, companies strengthen sustainability reporting.
Who Should Use a Corporate Governance Dashboard?
This dashboard suits:
-
Board Members
-
Compliance Officers
-
Risk Managers
-
ESG Analysts
-
Internal Audit Teams
-
Corporate Secretaries
-
Senior Executives
Moreover, mid-sized organizations can use it easily because it runs in Excel.
Best Practices for the Corporate Governance Dashboard in Excel
To maximize dashboard effectiveness, follow these best practices:
✅ Maintain Clean Data Structure
Use consistent data formats. Avoid duplicate entries. Therefore, charts remain accurate.
✅ Update Data Regularly
Update governance data monthly. This ensures reliable insights.
✅ Define Clear KPIs
Set measurable governance KPIs such as:
-
Case resolution rate
-
ESG score target
-
Compliance rate
-
Attendance target
✅ Monitor High-Risk Areas Frequently
Click to Purchases Corporate Governance Dashboard in Excel
Review risk category analysis more often. High-risk areas require attention.
✅ Use Filters Smartly
Apply slicers to compare committees, regions, and months.
✅ Review Trends Monthly
Analyze month analysis page regularly. This helps track progress.
✅ Share Insights With Leadership
Export summaries for board meetings. Therefore, discussions become data-driven.
How Does This Dashboard Improve Board Reporting?
Board meetings require clear insights. However, lengthy reports often confuse stakeholders.
This dashboard:
-
Summarizes data visually
-
Highlights risk areas clearly
-
Shows ESG performance
-
Tracks compliance movement
-
Provides committee comparisons
As a result, board discussions focus on solutions instead of data interpretation.
How to Implement the Corporate Governance Dashboard in Excel?
Follow these steps:
-
Collect governance data in structured format.
-
Enter data into the Data Sheet.
-
Use the Support Sheet for calculations if required.
-
Refresh pivot tables and charts.
-
Review Overview page first.
-
Drill down into Committee, Region, Risk, and Month analysis.
Therefore, you can deploy the dashboard quickly.
Conclusion – Why Every Organization Needs a Corporate Governance Dashboard in Excel
Corporate governance defines trust.
However, without structured tracking, organizations lose control over compliance and risk.
The Corporate Governance Dashboard in Excel provides:
-
Complete governance visibility
-
ESG performance tracking
-
Risk category insights
-
Regional analysis
-
Committee performance monitoring
-
Monthly trend evaluation
Moreover, it simplifies complex governance reporting.
Therefore, if you want stronger compliance, better transparency, and improved board performance, you should implement this dashboard today.
Frequently Asked Questions with Answers
1️⃣ What is a Corporate Governance Dashboard in Excel?
A Corporate Governance Dashboard in Excel is a structured reporting tool that tracks governance, ESG, risk, and compliance metrics using interactive charts and slicers.
2️⃣ Can small companies use this dashboard?
Yes. Since it runs in Excel, small and mid-sized companies can use it easily.
3️⃣ How often should we update governance data?
You should update governance data monthly. However, you can update it more frequently if needed.
4️⃣ Does this dashboard support ESG reporting?
Yes. It tracks ESG score by committee and governance rating. Therefore, it supports sustainability reporting.
5️⃣ Can we customize the dashboard?
Yes. You can modify KPIs, add new charts, or adjust slicers according to your governance framework.
6️⃣ What skills do users need?
Users need basic Excel knowledge such as data entry and pivot table refresh.
7️⃣ Why should we choose Excel instead of governance software?
Excel offers flexibility, affordability, and customization. Moreover, most organizations already use Excel.
Visit our YouTube channel to learn step-by-step video tutorials