Corporate governance defines how an organization leads, controls, and monitors its operations. However, many companies still track governance data in scattered Excel files and emails. As a result, leaders struggle to monitor ESG scores, compliance cases, attendance records, and committee performance in real time.
So, how can organizations monitor governance performance clearly and quickly?
The answer is simple.
You need a Corporate Governance Dashboard in Power BI.
Click to Purchases Corporate Governance Dashboard in Power BI
This ready-to-use dashboard centralizes governance data and converts it into powerful visual insights. Moreover, it helps decision-makers track open cases, resolved cases, ESG scores, attendance percentages, and risk categories in one structured system. Therefore, leaders gain visibility, control, and confidence.
In this detailed guide, you will learn:
-
What a Corporate Governance Dashboard in Power BI is
-
Why organizations need it
-
Detailed explanation of all 5 analytical pages
-
Advantages of Corporate Governance Dashboard in Power BI
-
Best Practices for the Corporate Governance Dashboard
-
Frequently Asked Questions with Answers
Let us explore everything step by step.
What Is a Corporate Governance Dashboard in Power BI?
A Corporate Governance Dashboard in Power BI is a structured reporting system built inside Microsoft Power BI. It collects governance data from multiple sources and transforms it into interactive charts, KPI cards, and slicers.
Instead of reviewing long reports, leadership teams can:
-
Monitor ESG scores
-
Track compliance status
-
Analyze committee performance
-
Review risk categories
-
Monitor monthly case trends
Because Power BI supports dynamic filtering, users can apply slicers and instantly view updated insights. Consequently, teams can make faster and smarter governance decisions.
Why Do Organizations Need a Corporate Governance Dashboard?
Strong governance ensures transparency, accountability, and compliance. However, manual tracking creates delays and errors. Therefore, organizations need a digital solution.
Here are the main reasons:
1️⃣ Improve Transparency
When data appears in clear visuals, stakeholders understand governance performance easily. Moreover, leadership can detect gaps quickly.
2️⃣ Monitor ESG Performance
Environmental, Social, and Governance (ESG) metrics play a critical role in modern organizations. A dashboard allows leaders to:
-
Compare ESG score by governance rating
-
Analyze ESG score by committee
-
Evaluate ESG score by region
As a result, management aligns strategies with sustainability goals.
3️⃣ Track Compliance Cases
Organizations handle open and resolved cases regularly. Therefore, tracking case progress ensures accountability and faster resolution.
4️⃣ Strengthen Risk Management
Risk categories often determine compliance severity. By monitoring open cases by risk category, companies reduce exposure proactively.
5️⃣ Enhance Board Oversight
Attendance percentage and committee participation directly reflect governance effectiveness. Because the dashboard shows attendance insights, boards can maintain accountability.
Detailed Explanation of All 5 Pages
Now let us break down each page of the Corporate Governance Dashboard in Power BI.
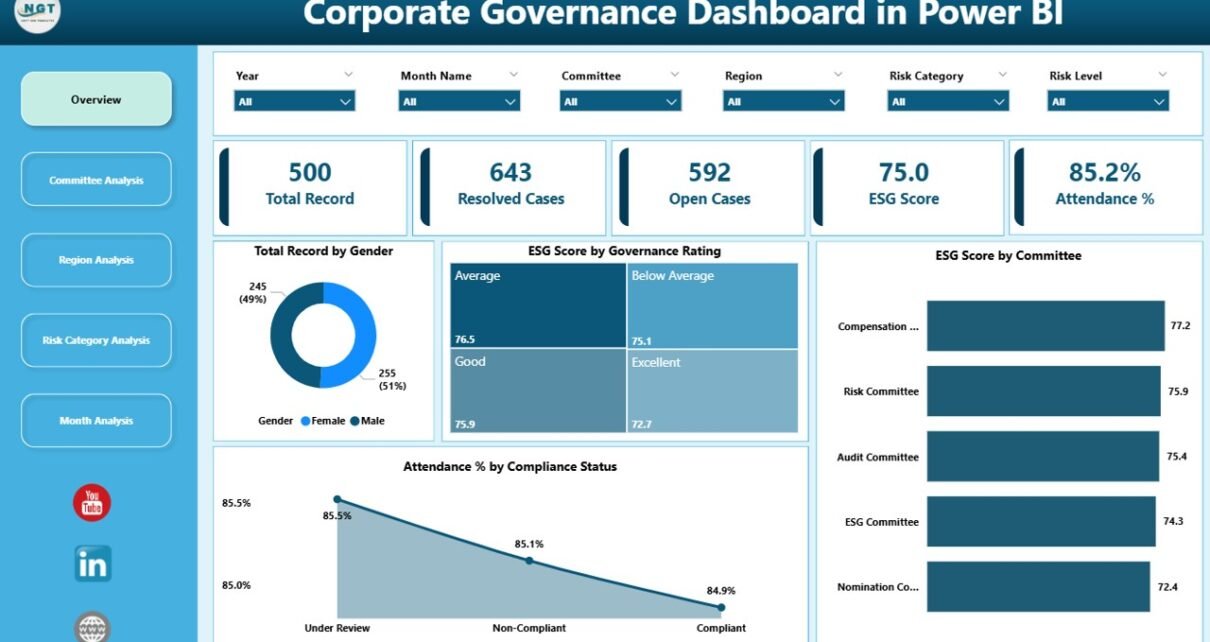
1️⃣ Overview Page – What Does It Show?
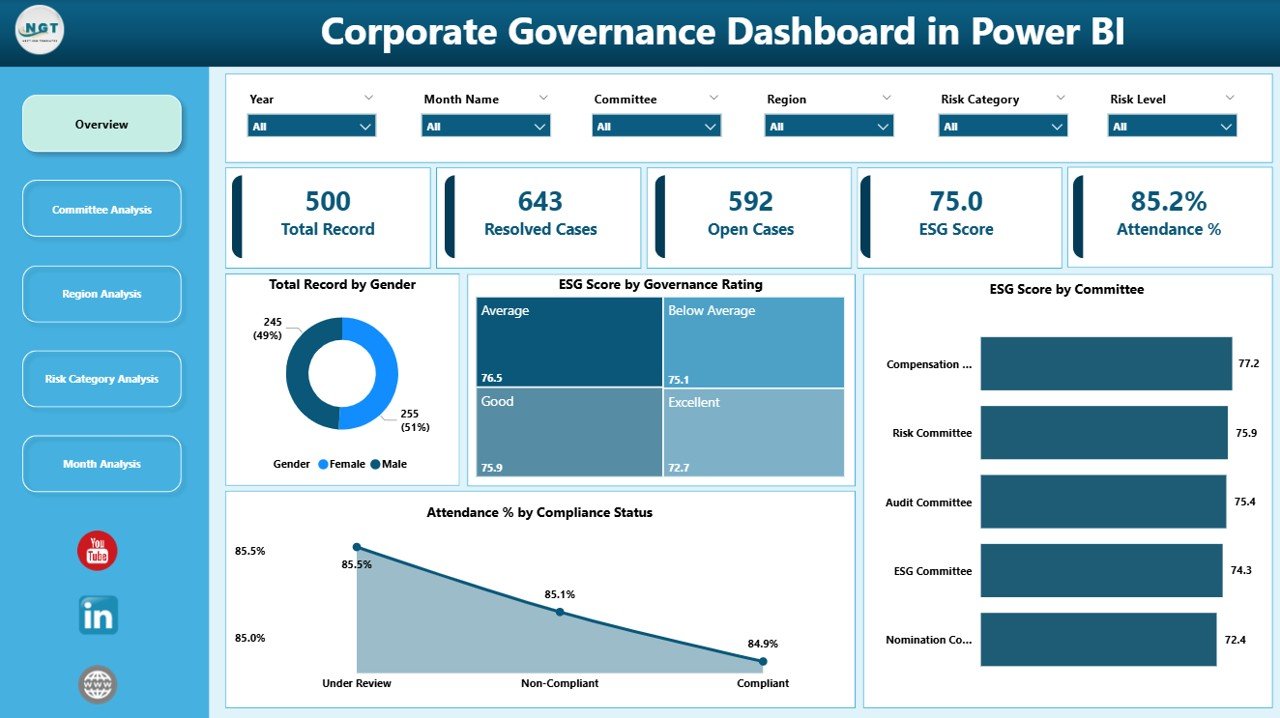
The Overview Page acts as the central control panel of the dashboard.
🔹 Key Features:
-
Interactive slicers
-
5 KPI cards
-
Governance performance charts
📊 KPI Cards:
-
Total Record by Gender
-
ESG Score by Governance Rating
-
ESG Score by Committee
-
Attendance % by Compliance Status
What Insights Can You Get?
-
Gender diversity in governance roles
-
ESG score distribution across ratings
-
Committee-level ESG performance
-
Attendance trends based on compliance
Because this page summarizes all major KPIs, executives can review overall governance performance within seconds.
Click to Purchases Corporate Governance Dashboard in Power BI
2️⃣ Committee Analysis – How Do Committees Perform?
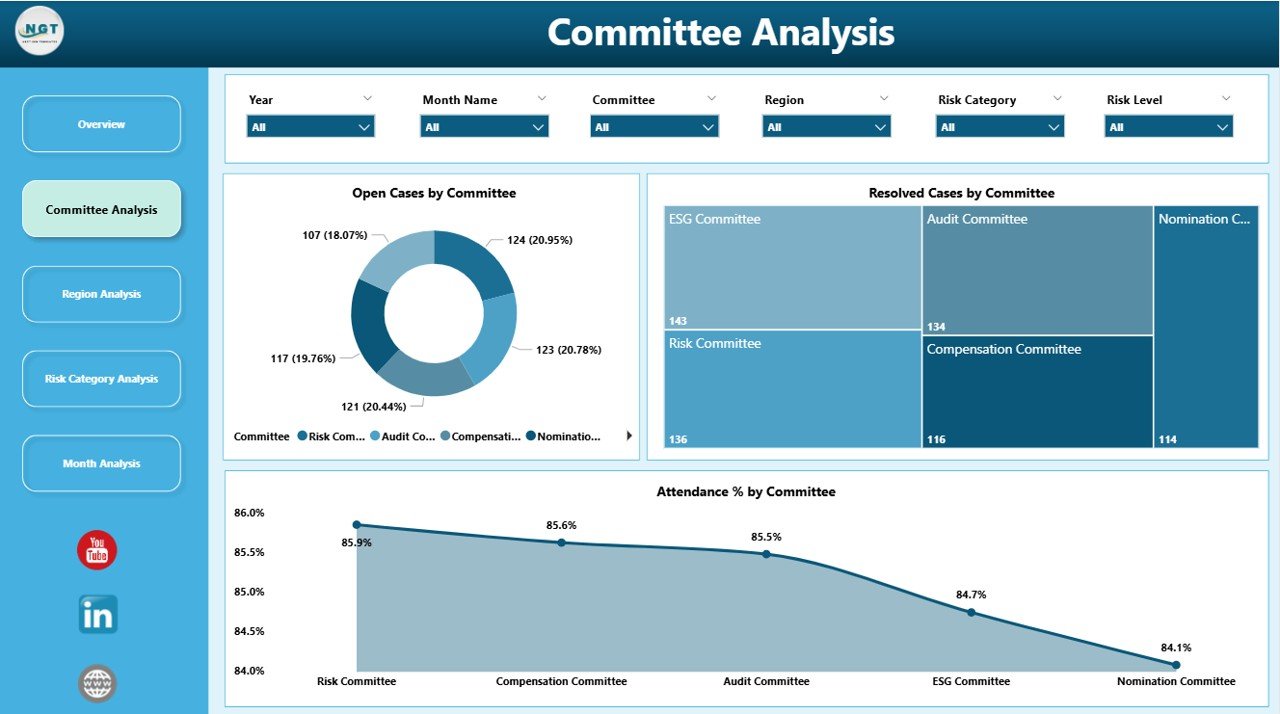
Committees play a crucial role in governance. Therefore, organizations must monitor their performance closely.
🔹 Charts Included:
-
Open Cases by Committee
-
Resolved Cases by Committee
-
Attendance % by Committee
Why Is This Page Important?
-
It highlights which committee handles the highest number of cases.
-
It shows how efficiently committees resolve cases.
-
It reveals attendance gaps within committees.
As a result, leadership can allocate resources better and improve accountability.
3️⃣ Region Analysis – Which Region Performs Better?
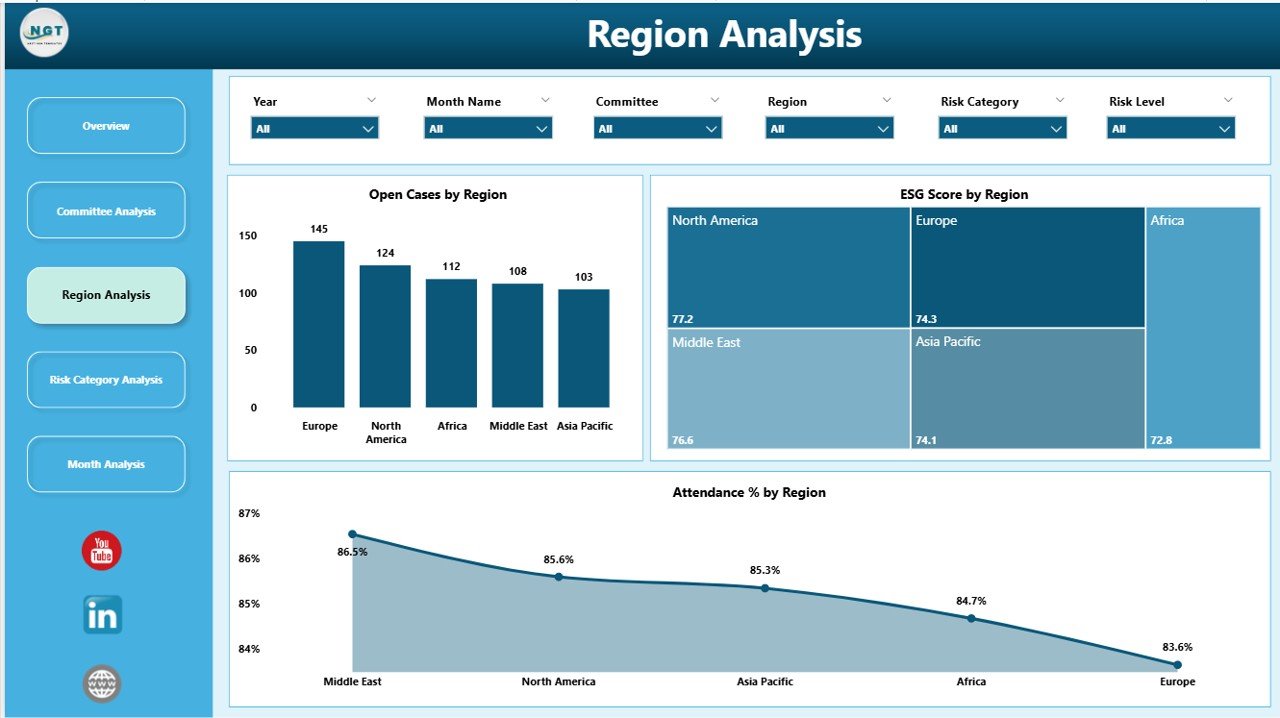
Organizations often operate across multiple regions. Therefore, governance standards must remain consistent everywhere.
🔹 Charts Included:
-
Open Cases by Region
-
ESG Score by Region
-
Attendance % by Region
Key Benefits:
-
Compare governance performance region-wise
-
Identify regions with high open cases
-
Monitor ESG consistency across locations
Because regional insights appear clearly, management can implement corrective actions faster.
4️⃣ Risk Category Analysis – Where Is the Highest Risk?
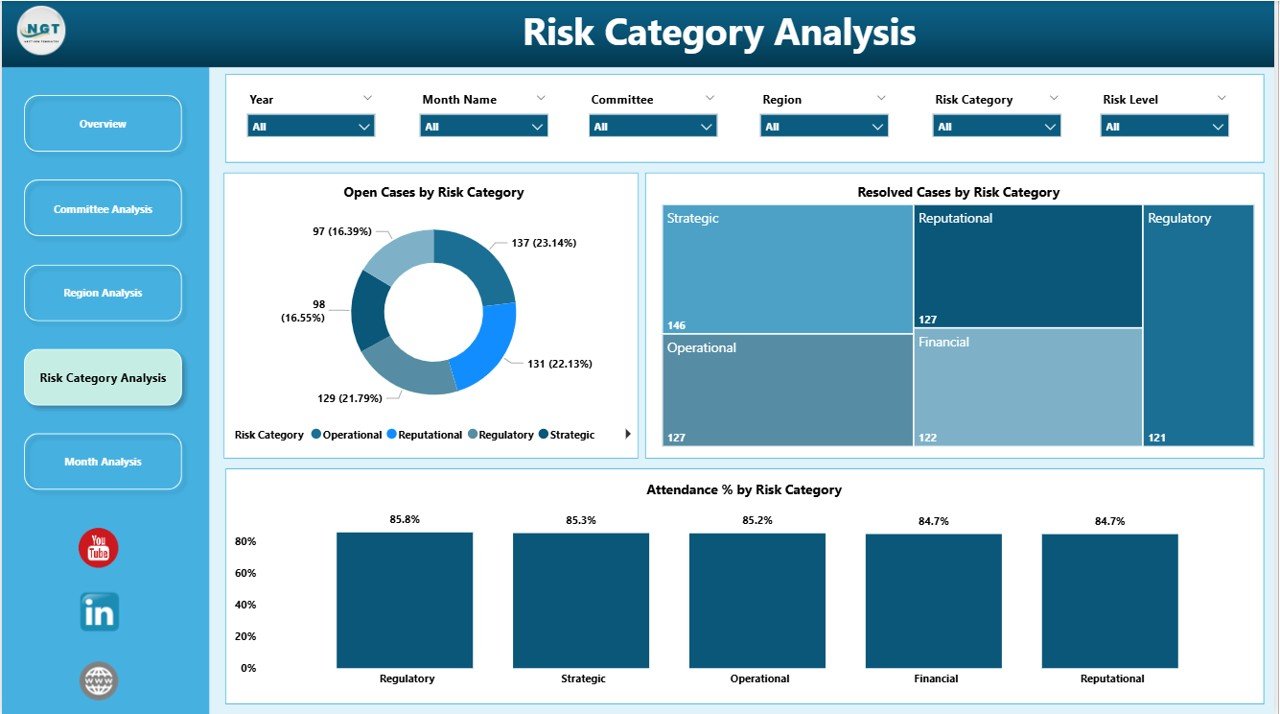
Risk analysis strengthens governance strategy.
🔹 Charts Included:
-
Open Cases by Risk Category
-
Resolved Cases by Risk Category
-
Attendance % by Risk Category
Why This Matters:
-
Detect high-risk compliance areas
-
Track resolution speed by risk type
-
Improve monitoring of sensitive cases
Consequently, organizations reduce legal and financial risks.
5️⃣ Month Analysis – How Do Trends Change Over Time?
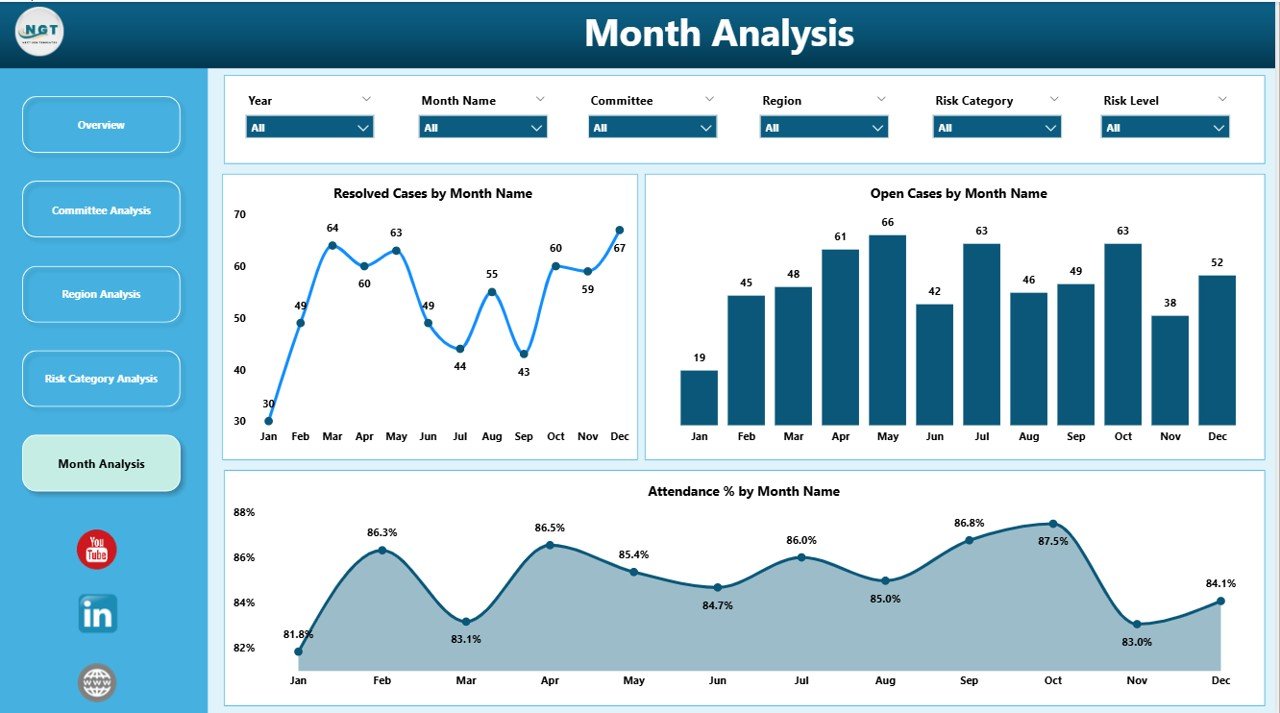
Monthly tracking helps organizations measure progress.
Click to Purchases Corporate Governance Dashboard in Power BI
🔹 Charts Included:
-
Open Cases by Month
-
Resolved Cases by Month
-
Attendance % by Month
What Can You Analyze?
-
Monthly increase or decrease in cases
-
Case resolution trends
-
Seasonal attendance patterns
Because trends appear visually, leadership can forecast and plan ahead.
Advantages of Corporate Governance Dashboard in Power BI
Now let us understand the major advantages.
✅ 1. Real-Time Insights
Power BI connects with live data sources. Therefore, dashboards update automatically.
✅ 2. Interactive Filtering
Users can apply slicers and drill down into specific data segments instantly.
✅ 3. Better Decision-Making
Clear visuals help executives take informed actions quickly.
✅ 4. Improved Accountability
Because attendance and case resolution appear clearly, committees remain accountable.
✅ 5. Stronger ESG Monitoring
Organizations can align governance strategy with ESG goals effectively.
✅ 6. Reduced Manual Reporting
The dashboard eliminates repetitive manual reporting tasks.
Best Practices for the Corporate Governance Dashboard
To get the best results, follow these practices.
🔹 Keep Data Clean and Structured
Use standardized formats for governance data. Moreover, validate entries regularly.
🔹 Define Clear KPIs
Select measurable and relevant KPIs such as:
-
Case Resolution Rate
-
ESG Compliance Score
-
Attendance Ratio
🔹 Update Data Frequently
Because governance data changes often, update data regularly.
🔹 Use Consistent Risk Categories
Maintain uniform risk definitions across regions and committees.
🔹 Monitor Trends Monthly
Review the Month Analysis page consistently to detect patterns early.
🔹 Share Dashboard with Stakeholders
Provide access to leadership and compliance teams for transparency.
How Does Power BI Improve Governance Reporting?
Power BI transforms raw governance data into actionable intelligence. Unlike static reports, it allows users to:
-
Drill down into details
-
Compare performance across dimensions
-
Visualize trends clearly
Moreover, Power BI supports data modeling, relationships, and DAX measures. Therefore, organizations can build advanced governance analytics easily.
Who Can Benefit from This Dashboard?
Many stakeholders benefit from a Corporate Governance Dashboard in Power BI.
-
Board Members
-
Compliance Officers
-
Risk Managers
-
ESG Analysts
-
Internal Audit Teams
-
Executive Leadership
Because it simplifies complex governance data, everyone gains clarity.
How to Implement the Corporate Governance Dashboard?
Follow these steps:
-
Collect governance data from all departments
-
Structure data in a centralized dataset
-
Import data into Power BI
-
Create relationships between tables
-
Build KPI measures using DAX
-
Design interactive visuals
-
Publish dashboard to stakeholders
When you follow this structured approach, implementation becomes smooth.
Conclusion
Corporate governance drives organizational integrity and sustainability. However, manual tracking slows down reporting and creates confusion.
A Corporate Governance Dashboard in Power BI centralizes governance data and converts it into powerful visual insights. Moreover, it strengthens ESG monitoring, improves compliance tracking, and enhances risk management.
Because the dashboard includes Overview, Committee Analysis, Region Analysis, Risk Category Analysis, and Month Analysis pages, it covers governance performance from every angle.
Therefore, organizations that adopt this dashboard gain transparency, control, and strategic advantage.
Frequently Asked Questions with Answers
1️⃣ What is a Corporate Governance Dashboard in Power BI?
It is an interactive reporting system built in Power BI that tracks ESG scores, compliance cases, attendance, and risk categories.
2️⃣ Why should companies use this dashboard?
Companies should use it because it improves transparency, speeds up reporting, and enhances decision-making.
3️⃣ Can this dashboard track ESG performance?
Yes. It tracks ESG score by governance rating, committee, and region.
4️⃣ Does the dashboard support filtering?
Yes. Users can apply slicers to filter data by committee, region, risk category, or month.
5️⃣ Who uses this dashboard?
Board members, compliance officers, ESG analysts, and risk managers use it.
6️⃣ Can small organizations use this dashboard?
Click to Purchases Corporate Governance Dashboard in Power BI
Yes. Both small and large organizations can customize and use it.
7️⃣ How often should organizations review governance data?
Organizations should review governance data monthly. However, they can also monitor it weekly if needed.
Visit our YouTube channel to learn step-by-step video tutorials