In today’s competitive corporate world, employee learning and development play a vital role in business success. Companies that invest in training gain more productive, engaged, and loyal employees. But how can you measure the true impact of these training programs?
That’s where the Corporate Training KPI Dashboard in Excel comes in. This ready-to-use Excel dashboard helps HR and L&D departments track key performance indicators (KPIs) for their training initiatives. It turns raw data into actionable insights—helping organizations evaluate the effectiveness, efficiency, and outcomes of their corporate training programs.
Click to Purchases Corporate Training KPI Dashboard in Excel
What Is a Corporate Training KPI Dashboard in Excel?
A Corporate Training KPI Dashboard is an Excel-based performance-tracking tool that visualizes how well your corporate training programs are performing. It helps managers and HR professionals monitor KPIs like training completion rates, cost per trainee, knowledge retention, and employee satisfaction.
By using Excel as the foundation, you gain a flexible, cost-effective, and interactive system that requires no additional software. The dashboard consolidates all metrics into a single platform, allowing stakeholders to review progress in real time and make informed decisions about future training investments.
Click to Purchases Corporate Training KPI Dashboard in Excel
Why Corporate Training KPIs Matter
Corporate training directly impacts employee skill enhancement, productivity, and retention. Without measurable KPIs, it’s difficult to evaluate if your learning programs are delivering value.
Tracking KPIs helps you:
-
Measure the ROI of training programs.
-
Identify which sessions improve performance the most.
-
Detect skill gaps and improve training design.
-
Align learning goals with business objectives.
-
Make evidence-based HR and budget decisions.
The Corporate Training KPI Dashboard in Excel offers a visual and data-driven solution to simplify this process.
Key Features of the Corporate Training KPI Dashboard in Excel
This professional-grade Excel dashboard includes seven worksheets, each serving a specific function to streamline data entry, visualization, and analysis.
1️⃣ Home Sheet
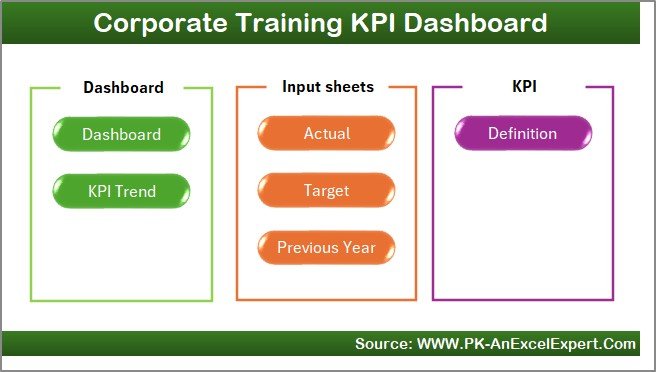
The Home sheet acts as your central navigation panel.
It features six quick-access buttons that allow users to jump directly to any major section of the dashboard—Dashboard, KPI Trend, Input, Target, Previous Year, or KPI Definition sheets.
This layout ensures users can easily move across the workbook without getting lost in complex menus.
2️⃣ Dashboard Sheet
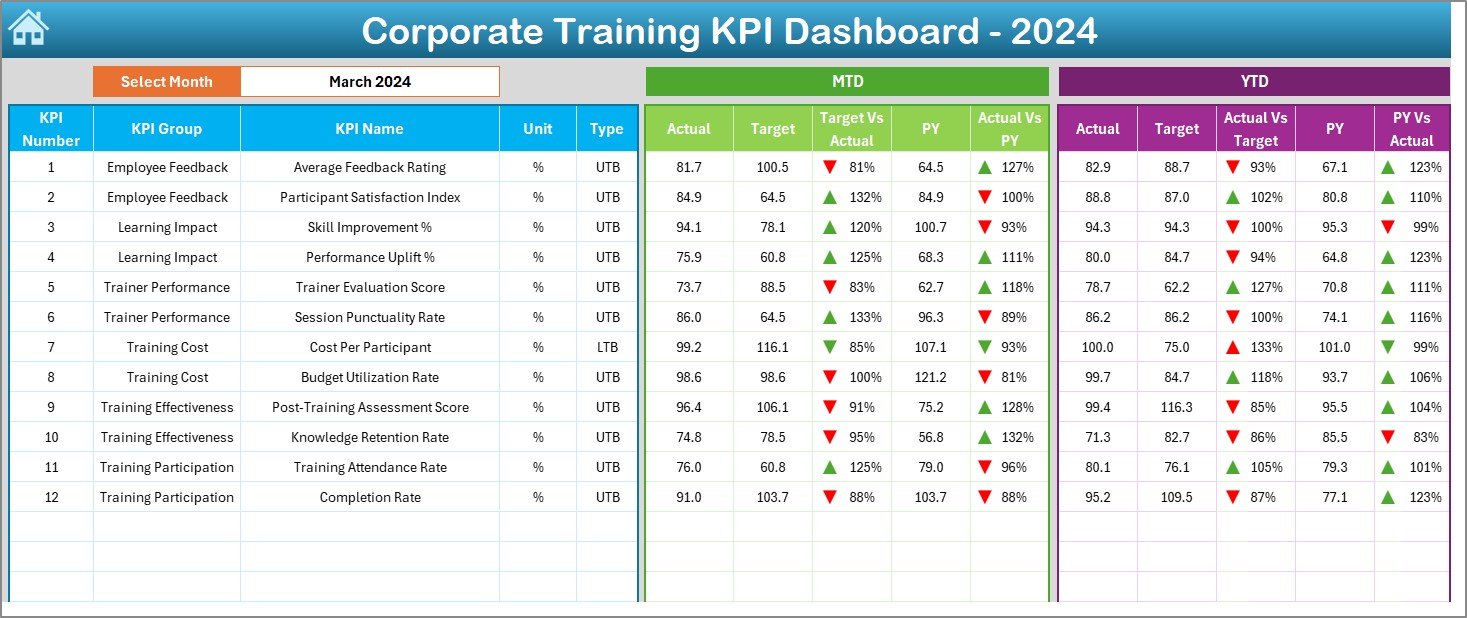
The Dashboard sheet is the main interface that provides a visual summary of all training KPIs.
Here’s what it includes:
-
A Month selector (cell D3) that automatically refreshes dashboard visuals for the chosen month.
-
MTD (Month-to-Date) and YTD (Year-to-Date) comparisons showing Actual, Target, and Previous Year data.
-
Conditional Formatting Indicators: Up/down arrows show performance trends—green for improvement, red for decline.
-
Performance Metrics: Displays KPI summaries like participation rates, average cost, and satisfaction levels.
This interactive view enables instant performance monitoring and is ideal for monthly HR meetings or management presentations.
3️⃣ KPI Trend Sheet
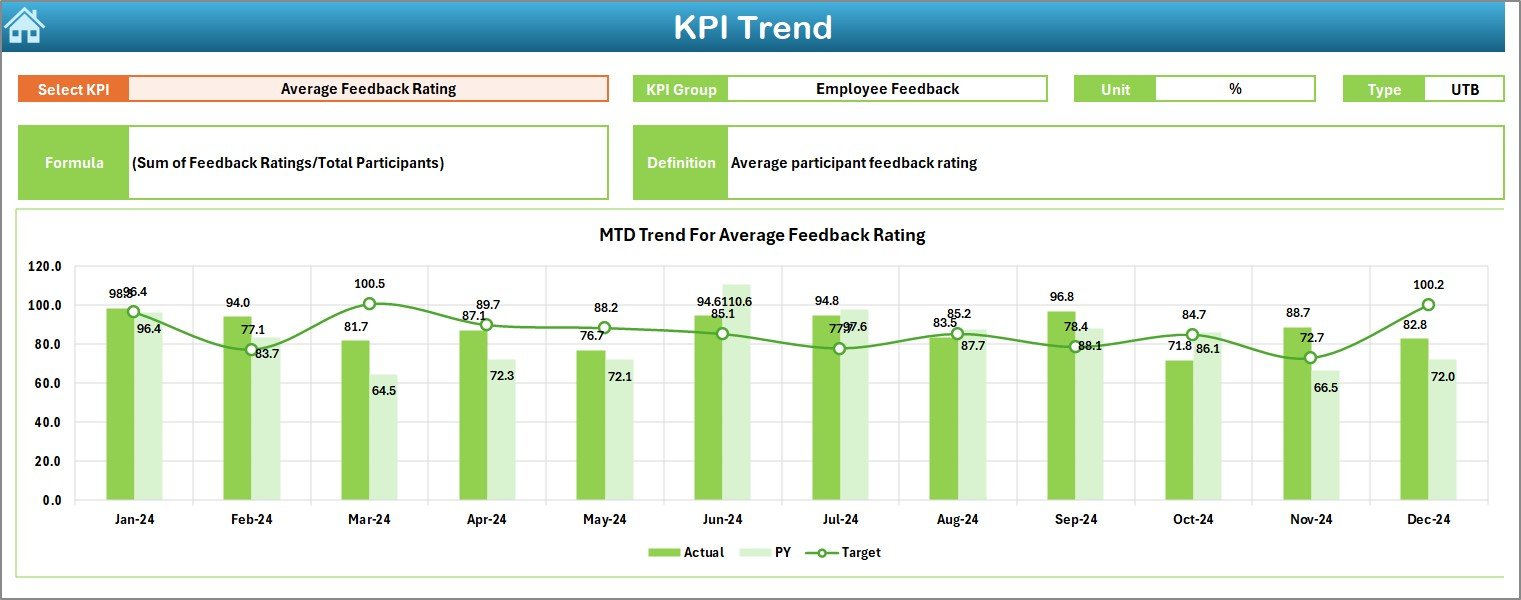
The KPI Trend sheet lets you explore deeper insights for individual metrics.
Key highlights:
-
KPI Selection Dropdown (cell C3): Choose a KPI to analyze.
-
Automatic Display of Details: View KPI Group, Unit, Type (UTB or LTB), Formula, and Definition.
-
Trend Visualization: Displays MTD and YTD trend charts for Actual, Target, and Previous Year data.
This sheet transforms data into meaningful visuals, helping identify performance trends and long-term learning improvements.
4️⃣ Actual Numbers Input Sheet
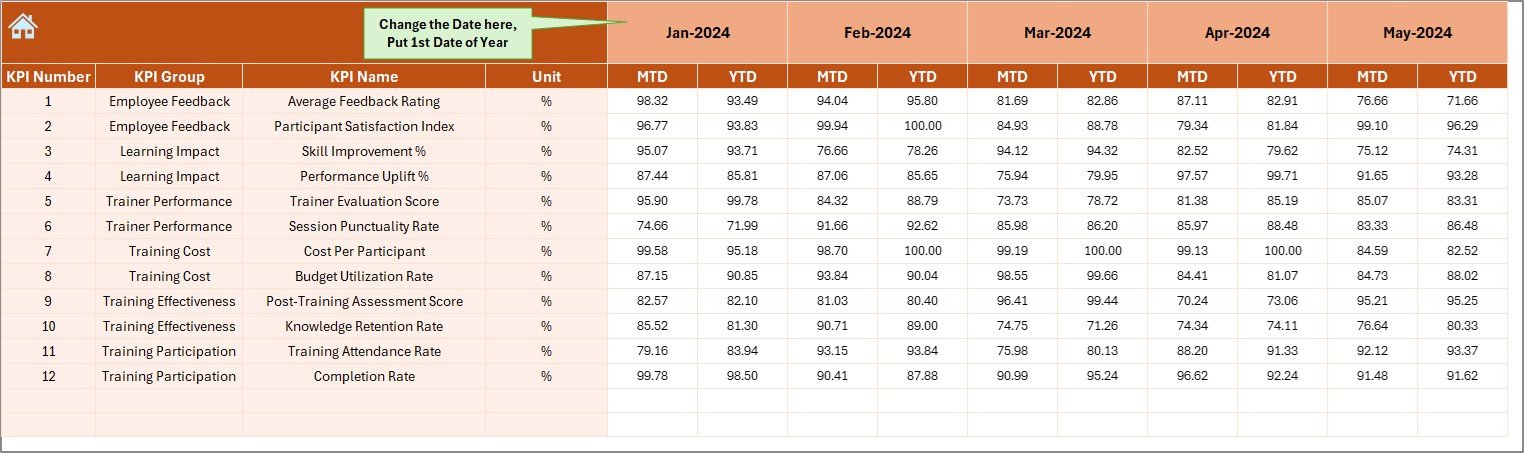
The Actual Numbers Input sheet is the data engine of your dashboard.
You’ll enter real training data—such as attendance, scores, and costs—for both MTD and YTD.
Key functions:
-
Set the first month of the year in cell E1.
-
Input monthly performance numbers for every KPI.
-
Automatic updates reflect instantly in charts and metrics.
This keeps your dashboard fresh, accurate, and ready for reporting at any time.
5️⃣ Target Sheet
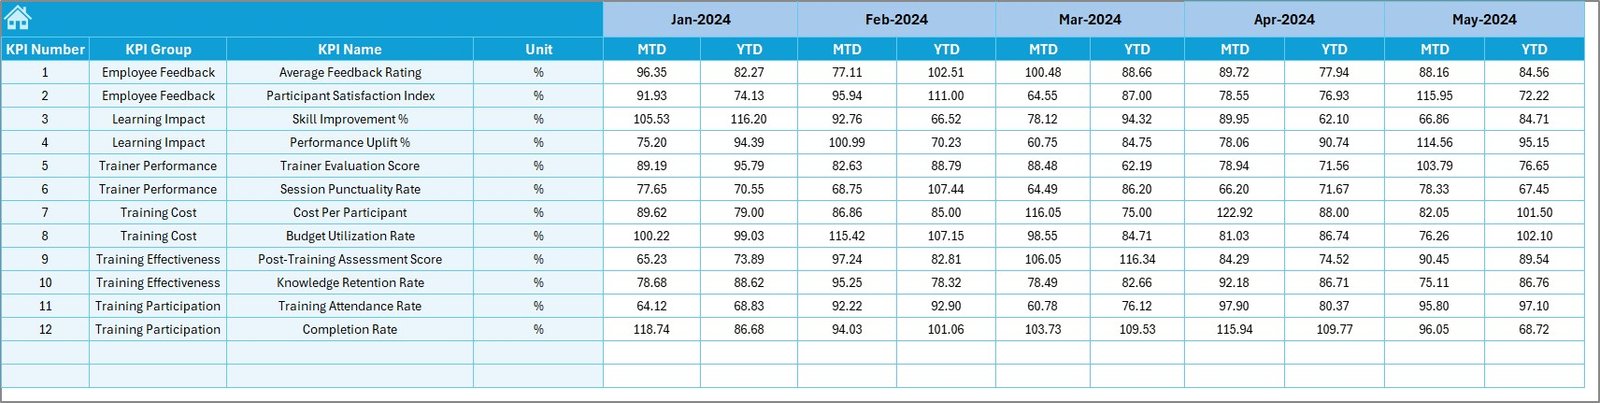
The Target sheet allows you to define goals for each KPI—both MTD and YTD—for the entire year.
For example, you can set targets for:
-
Employee completion rates.
-
Cost per session.
-
Knowledge retention percentage.
-
Satisfaction scores.
Establishing clear targets makes performance comparisons meaningful and drives continuous improvement.
6️⃣ Previous Year Number Sheet
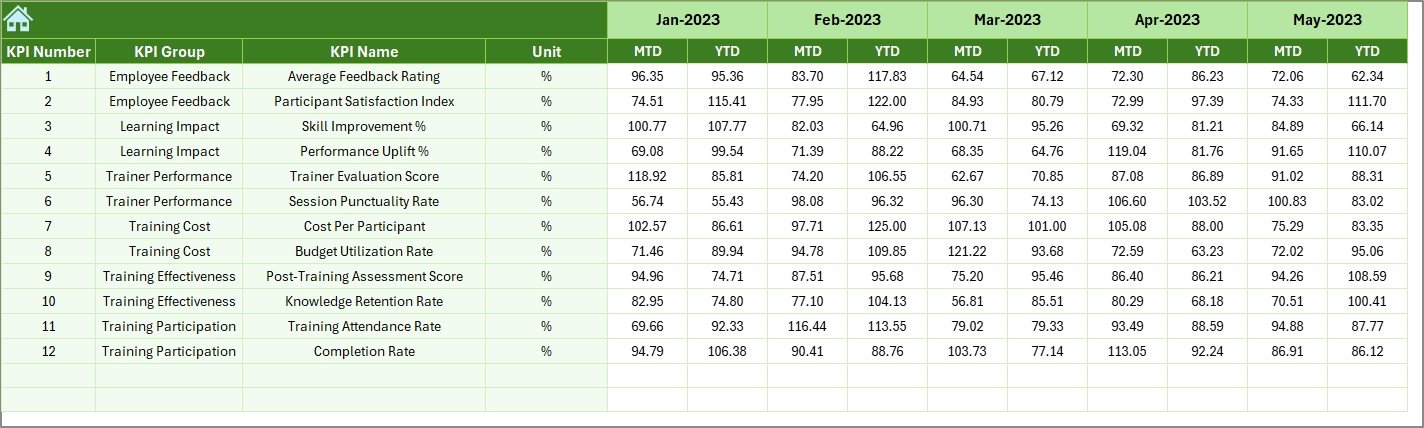
In this sheet, you can record the previous year’s KPI data in the same structure as your current year.
It enables easy performance benchmarking—so you can measure how this year’s results compare to last year’s achievements.
7️⃣ KPI Definition Sheet
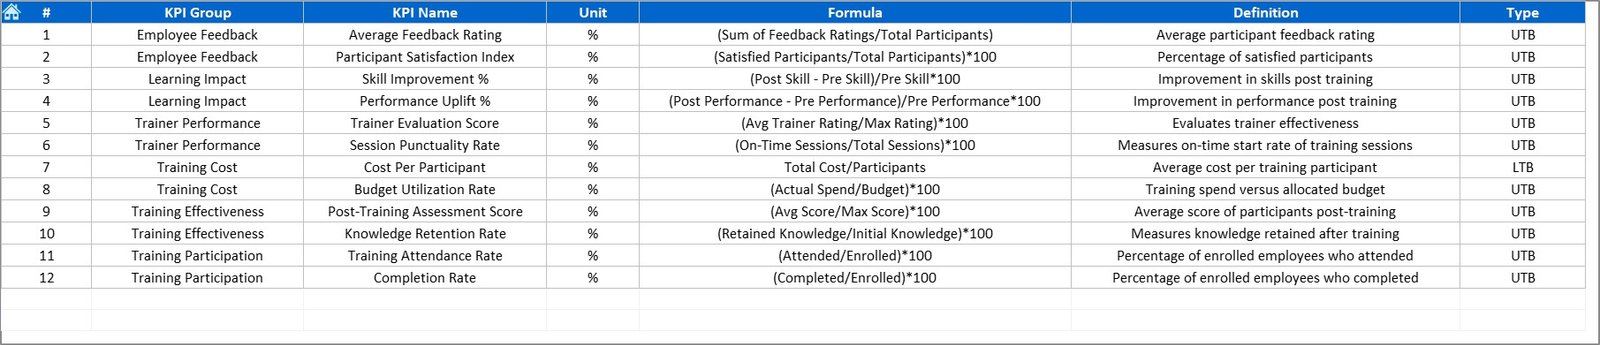
The KPI Definition sheet ensures standardization and clarity across your organization.
Include details such as:
-
KPI Name and Group (e.g., Engagement, Learning Effectiveness, Finance).
-
Unit of Measurement (%, Hours, Cost per Trainee, etc.).
-
Formula used to calculate each KPI.
-
Short Definition describing the KPI’s purpose.
This documentation guarantees consistency and alignment in reporting.
Example KPIs for Corporate Training Dashboard
Here are some common KPIs that you can include in your dashboard:
🎓 Learning Effectiveness
-
Average Test Score (%)
-
Post-Training Knowledge Retention (%)
-
Employee Skill Improvement (%)
💼 Training Operations
-
Number of Programs Conducted
-
Completion Rate (%)
-
Average Training Hours per Employee
💰 Financial Metrics
-
Cost per Trainee
-
Training Budget Utilization (%)
-
ROI on Training (%)
🧑💼 Engagement & Satisfaction
-
Employee Satisfaction Score
-
Attendance Rate (%)
-
Feedback Score (1–10)
These KPIs offer a 360-degree view of how your training efforts contribute to business growth.
Click to Purchases Corporate Training KPI Dashboard in Excel
How to Use the Corporate Training KPI Dashboard Effectively
Follow these steps for best results:
-
List KPIs: Identify metrics that align with business goals.
-
Set Targets: Use the Target sheet to define realistic goals for each KPI.
-
Input Data: Enter monthly values in the Actual Numbers sheet.
-
Monitor Trends: Review charts on the Dashboard and KPI Trend sheets.
-
Compare with Past Data: Use the Previous Year sheet to track year-over-year improvement.
-
Communicate Insights: Present results visually using the Dashboard page for management reports.
Regular analysis ensures you stay on track and continuously improve training outcomes.
Advantages of Using a Corporate Training KPI Dashboard in Excel
Implementing this Excel-based KPI dashboard provides a range of practical benefits:
✅ 1. Real-Time Visibility
Get instant insight into how training programs are performing—no manual calculations required.
✅ 2. Performance Comparison
Easily compare Actual vs Target and Current vs Previous Year performance.
✅ 3. Centralized Data
Store all KPI data, targets, and definitions in one organized file.
✅ 4. Automated Analysis
Excel formulas and conditional formatting eliminate repetitive tasks.
✅ 5. Customizable Layout
Add, remove, or modify KPIs based on your organization’s training needs.
✅ 6. Cost-Effective Tool
Avoid expensive software—Excel provides everything you need in one place.
Best Practices for the Corporate Training KPI Dashboard
To make the most out of your KPI dashboard, follow these best practices:
🧭 Align KPIs with Organizational Goals: Each KPI should support learning and business objectives.
📈 Focus on Quality Metrics: Choose KPIs that measure results, not just activity.
🗓️ Update Regularly: Enter new data each month for accurate trend analysis.
🎨 Use Conditional Formatting: Highlight performance gaps visually.
👥 Collaborate Across Departments: Involve HR, finance, and team leaders in reviewing KPI outcomes.
💡 Review and Refine: Adjust KPIs periodically as training programs evolve.
Applying these practices ensures your dashboard remains an active management tool—not just a reporting sheet.
Click to Purchases Corporate Training KPI Dashboard in Excel
How Excel Empowers Corporate Training Analytics
Excel’s versatility makes it an ideal tool for KPI dashboards. Here’s why professionals rely on it:
-
Interactive Dashboards: Dynamic slicers and charts bring your data to life.
-
Custom Formulas: Tailor calculations to your organization’s unique needs.
-
Data Integration: Import HR and LMS data easily from CSV or databases.
-
Security: Protect sheets and limit editing access.
-
Scalability: Works for small teams or enterprise-level organizations alike.
Excel combines simplicity with analytical depth—perfect for managing corporate training KPIs.
Common Mistakes to Avoid
Avoid these common errors while using your dashboard:
❌ Setting vague or unmeasurable KPIs.
❌ Ignoring trend analysis (focusing only on monthly snapshots).
❌ Forgetting to enter data consistently.
❌ Not comparing with previous year results.
❌ Overloading the dashboard with unnecessary visuals.
Keeping your dashboard simple and focused ensures maximum impact.
Conclusion
The Corporate Training KPI Dashboard in Excel is a powerful, easy-to-use tool that helps organizations monitor, evaluate, and improve training outcomes.
By integrating multiple sheets—Home, Dashboard, KPI Trend, Actual Numbers, Target, Previous Year, and KPI Definition—this dashboard provides a holistic view of your training performance. It enables HR teams to visualize learning effectiveness, financial efficiency, and employee engagement all in one place.
Whether you’re tracking training completion, cost control, or knowledge improvement, this Excel dashboard turns your training data into strategic insights—empowering better decisions and stronger workforce development.
Click to Purchases Corporate Training KPI Dashboard in Excel
Frequently Asked Questions (FAQs)
1. What is a Corporate Training KPI Dashboard?
It’s an Excel tool that tracks performance metrics related to corporate learning and development programs.
2. Why should I use Excel for KPI tracking?
Excel offers flexibility, interactivity, and automation—making it an affordable choice for KPI management.
3. What types of KPIs are included?
KPIs can cover training attendance, costs, completion rates, satisfaction scores, and more.
4. Can I customize this dashboard?
Yes. You can modify KPIs, charts, and layouts based on your specific business needs.
5. How often should I update data?
Monthly updates work best for accurate MTD and YTD tracking.
6. Does it support trend visualization?
Yes. The KPI Trend sheet provides dynamic charts for analyzing performance trends over time.
7. Is it suitable for small organizations?
Absolutely! The dashboard is scalable for companies of any size.
Click to Purchases Corporate Training KPI Dashboard in Excel
Visit our YouTube channel to learn step-by-step video tutorials
Watch the step-by-step video tutorial: