Corporate training programs grow stronger when organizations track the right KPIs. Training managers, HR teams, and Learning & Development professionals need clear insights into training quality, completion patterns, skill growth, and learner performance. Because training impacts employee productivity and organizational success, companies need a reporting solution that brings every KPI together in one place.
A Corporate Training KPI Dashboard in Power BI solves this problem. It offers a clean, visual, and interactive way to track all essential training KPIs in real time. In this article, you will explore the complete structure of this dashboard, its features, advantages, best practices, and answers to the most common questions.
Click to Purchases Corporate Training KPI Dashboard in Power BI
📘 What Is a Corporate Training KPI Dashboard in Power BI?
A Corporate Training KPI Dashboard in Power BI is a ready-to-use reporting tool that analyzes training performance using visual charts, KPI cards, trend analysis, and drill-through insights. Power BI connects to an Excel data source where all training values (Actual, Target, MTD, YTD, PY data) are stored.
Because the dashboard is interactive and dynamic, training managers get real-time insights that guide better decisions. They can track which training programs work, where learners struggle, and which KPIs need attention.
Click to Purchases Corporate Training KPI Dashboard in Power BI
📂 Structure of the Corporate Training KPI Dashboard in Power BI
This dashboard includes three main pages, each built for deeper insight into corporate training performance.
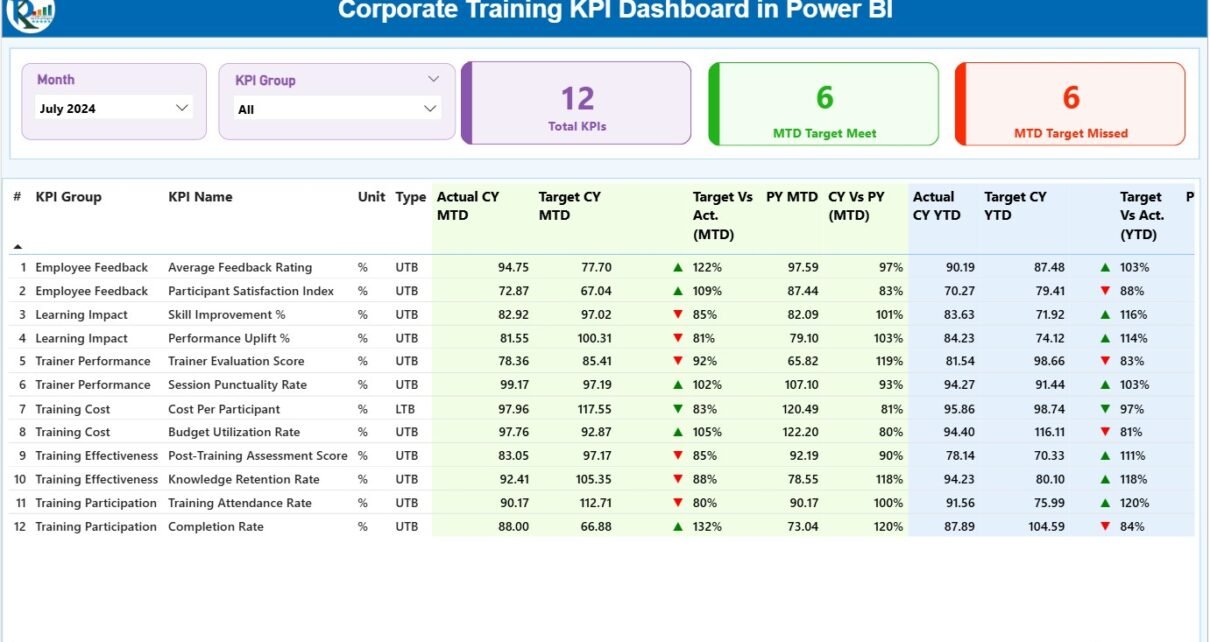
1️⃣ Summary Page – The Main Dashboard

The Summary Page works as the central hub. It gives users a complete view of MTD and YTD performance for all training KPIs.
⭐ Key Highlights on the Summary Page
✔ Month & KPI Group Slicers
On the top of the page, users select:
-
A specific month
-
A KPI group
This helps them view data for targeted training metrics.
✔ KPI Cards
The page shows three main cards:
-
Total KPIs Count
-
MTD Target Meet Count
-
MTD Target Missed Count
These cards allow managers to see how overall training performance looks at a glance.
✔ Detailed KPI Table
The table displays every important metric:
-
KPI Number: Sequence number
-
KPI Group: Category of KPI
-
KPI Name: Name of the training KPI
-
Unit: Measurement unit
-
Type: UTB (Upper the Better) or LTB (Lower the Better)
-
Actual CY MTD: Current Month-to-Date Actual
-
Target CY MTD: Current MTD Target
-
MTD Icon: Arrow ▲ ▼ in green/red showing performance
-
Target vs Actual (MTD %): Formula = Actual ÷ Target
-
PY MTD: Previous Year MTD
-
CY vs PY MTD (%)
-
Actual CY YTD: Current Year YTD Actual
-
Target CY YTD: Current Year YTD Target
-
YTD Icon: Arrow showing YTD performance
-
Target vs Actual (YTD %)
-
PY YTD: Previous Year YTD
-
CY vs PY YTD (%)
This table helps managers understand every KPI in detail.
Click to Purchases Corporate Training KPI Dashboard in Power BI
2️⃣ KPI Trend Page – View Progress Over Time

The KPI Trend Page shows how each training KPI performs month-by-month. This view helps users understand when performance improves or drops.
⭐ What You Can See Here
-
Two Combo Charts:
-
MTD: Actual, Target, and Previous Year
-
YTD: Actual, Target, and Previous Year
-
-
KPI Slicer:
Users select the KPI they want to analyze.
Because this page highlights trends, it helps L&D teams make informed decisions about new training needs or skill gaps.
3️⃣ KPI Definition Page – Drill-Through Information

The KPI Definition Page stores detailed descriptions of each KPI. Although this page stays hidden, users can open it through drill-through functionality on the Summary Page.
⭐ This Page Displays
-
KPI Name
-
KPI Number
-
KPI Group
-
Unit
-
Type (UTB / LTB)
-
Formula
-
KPI Definition
The drill-through feature helps teams understand how each KPI works.
Users can go back to the main page through the Back button on the top left.
Click to Purchases Corporate Training KPI Dashboard in Power BI
📥 Excel Data Source – The Engine Behind the Dashboard
This Power BI dashboard connects to an Excel workbook that contains three sheets.
⭐ 1. Input_Actual Sheet
Record:
-
KPI Name
-
Month (always the first day of the month)
-
MTD Actual numbers
-
YTD Actual numbers
⭐ 2. Input_Target Sheet
Enter:
-
KPI Name
-
Month
-
MTD Targets
-
YTD Targets
⭐ 3. KPI Definition Sheet
Fill in:
-
KPI Number
-
KPI Group
-
KPI Name
-
Unit
-
Formula
-
Definition
-
Type (LTB / UTB)
These sheets make the dashboard dynamic, consistent, and easy to maintain.
Click to Purchases Corporate Training KPI Dashboard in Power BI
🎯 Why Organizations Need a Corporate Training KPI Dashboard
Corporate training programs create long-term value for employees and organizations. However, without proper reporting, training results stay unclear. The KPI dashboard solves this problem because it transforms data into meaningful insights.
Training managers can:
-
Measure program effectiveness
-
Identify skill gaps
-
Align training with business goals
-
Improve decision-making
-
Track progress month-to-month
-
Compare performance with past years
Because the dashboard works visually, users understand insights faster.
Click to Purchases Corporate Training KPI Dashboard in Power BI
🌟 Advantages of the Corporate Training KPI Dashboard in Power BI
✔ 1. Clear Visibility
Users see all KPIs, MTD numbers, YTD values, and target status in one screen.
✔ 2. Faster Decisions
Teams take quick action because the dashboard updates instantly.
✔ 3. Accurate Performance Tracking
Actual vs Target and CY vs PY comparisons provide a complete performance picture.
✔ 4. Customizable Layout
Organizations customize KPIs, charts, colors, and formulas based on their needs.
✔ 5. Engaging Visuals
Charts, KPI cards, slicers, and icons help users understand training performance quickly.
✔ 6. Easy Maintenance
Excel data entry keeps the dashboard simple, cost-effective, and easy to update.
🧭 Best Practices for Using the Training KPI Dashboard
⭐ 1. Update Data Every Month
Regular updates help keep trends accurate.
⭐ 2. Use Clear KPI Definitions
Each KPI must have a simple and consistent meaning.
⭐ 3. Check Target Alignment
Update training targets based on actual performance.
⭐ 4. Analyze Trends Before Taking Action
Trend charts reveal deeper insights about training success.
⭐ 5. Track Both MTD and YTD
Monthly and yearly comparisons help teams evaluate performance better.
⭐ 6. Review KPI Type (UTB/LTB)
Correct classification ensures accurate arrow indicators.
⭐ 7. Add New KPIs When Programs Evolve
Training grows over time, so regularly update KPI lists.
Click to Purchases Corporate Training KPI Dashboard in Power BI
📌 Where Can Organizations Use This Dashboard?
The Corporate Training KPI Dashboard works across multiple environments:
-
Corporate L&D teams
-
HR departments
-
Employee development programs
-
Leadership training
-
Technical skill programs
-
Compliance and regulatory training
-
Performance improvement teams
-
Onboarding and induction programs
Because Power BI is flexible, it fits every type of training program.
🏁 Conclusion
A Corporate Training KPI Dashboard in Power BI helps organizations track training effectiveness with clarity and confidence. With KPI cards, trend charts, actual vs target comparisons, and drill-through features, it becomes a complete performance reporting tool.
The dashboard supports better planning, quicker decisions, and more successful training outcomes. When organizations use this dashboard regularly, training programs grow stronger, more data-driven, and aligned with business goals.
❓ Frequently Asked Questions (FAQs)
1. What is a Corporate Training KPI Dashboard?
It is a Power BI dashboard that tracks training KPIs using visuals, charts, and performance indicators.
2. What data does the dashboard need?
You need Actual numbers, Target numbers, KPI definitions, and monthly training values.
3. Can users customize the dashboard?
Yes, Power BI allows you to adjust KPIs, visuals, formulas, and layout easily.
4. Who uses this dashboard?
HR teams, learning managers, training coordinators, and leadership development teams.
5. What KPIs can the dashboard track?
Training hours, completion rates, assessment scores, trainer performance, attendance, cost per training, and more.
6. How often should the data be updated?
It should be updated monthly for accurate MTD and YTD comparison.
7. Does the dashboard include trend analysis?
Yes, the KPI Trend Page shows MTD and YTD trends for Actual, Target, and Previous Year.
Click to Purchases Corporate Training KPI Dashboard in Power BI
Visit our YouTube channel to learn step-by-step video tutorials