Corporate learning and capability development play an important role in every organization. Companies grow faster when employees learn new skills, complete training programs, and continuously improve performance. Because of this, corporate universities now use structured dashboards to track the progress of their learning programs. A Corporate Universities KPI Dashboard in Excel helps teams understand training output, measure performance, and improve learning effectiveness in a clear and organized way.
This guide explains everything about this dashboard. You will learn how each sheet works, how KPIs flow across the workbook, and how this dashboard supports data-driven decisions for corporate learning and development teams.
Click to Purchases Corporate Universities KPI Dashboard in Excel
What Is a Corporate Universities KPI Dashboard in Excel?
A Corporate Universities KPI Dashboard in Excel is a ready-to-use template designed to monitor training KPIs across different departments, programs, and time periods. It tracks MTD and YTD performance, compares actual numbers with targets, displays previous year data, and provides trend charts for deeper analysis.
This dashboard includes:
-
A clean navigation system
-
A complete KPI summary
-
Trend charts
-
KPI definitions
-
Actual, target, and previous year sheets
-
Automated conditional formatting
-
Monthly selection options
Because Excel is simple, flexible, and widely used, companies prefer this format for managing their learning KPIs. The dashboard provides instant visibility and helps stakeholders understand the health of learning programs across the organization.
How the Dashboard Works: Overview of All 7 Sheets
This dashboard contains 7 well-structured sheets, each designed for a specific purpose. Below is a detailed explanation of each one.
1. Home Sheet – The Navigation Hub
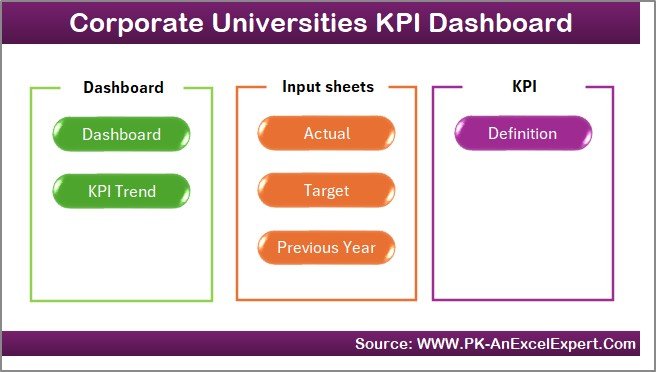
The Home sheet works like an index page. It includes six navigation buttons that take users directly to other sheets. Because of this simple layout, users can jump across the workbook quickly without scrolling through multiple tabs.
This sheet improves accessibility and makes the dashboard easy for anyone to use, including team leaders, trainers, and management.
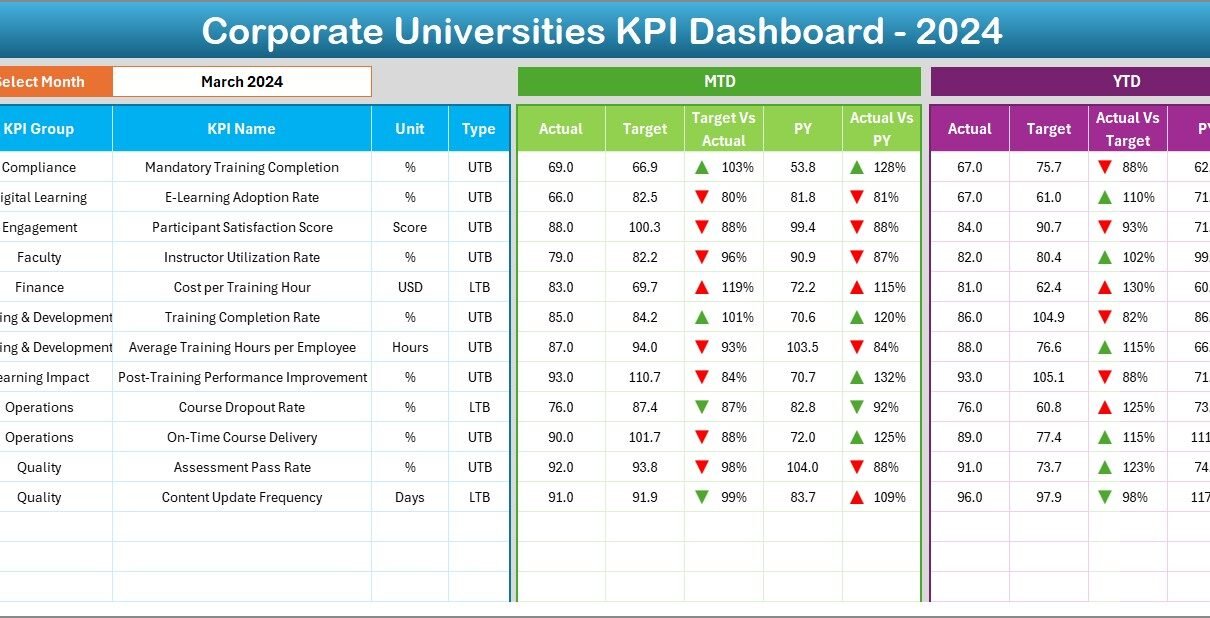
2. Dashboard Sheet – The Main KPI Summary Page
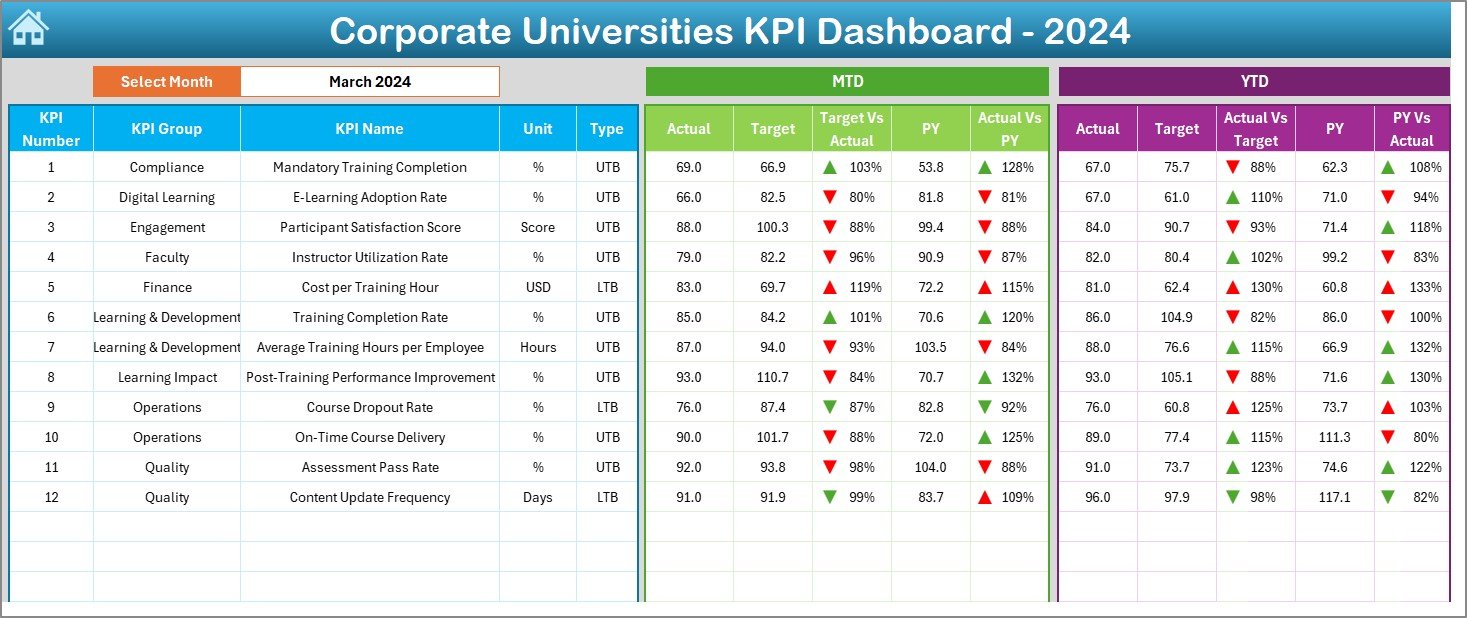
The Dashboard sheet is the most important part of the template. It provides a complete view of all KPIs in one place.
Monthly Selection for Automatic Refresh
At cell D3, you choose the month from a drop-down list. After selecting the month:
-
All KPIs update
-
All MTD values refresh
-
All YTD numbers update
-
All comparisons reorganize automatically
This dynamic update makes it easy to review performance month by month.
MTD and YTD KPI Blocks
For each KPI, this sheet shows:
-
MTD Actual
-
MTD Target
-
MTD Previous Year
-
MTD Target vs Actual
-
MTD PY vs Actual
-
Conditional arrows
Just below that, the dashboard displays:
-
YTD Actual
-
YTD Target
-
YTD Previous Year
-
YTD Target vs Actual
-
YTD PY vs Actual
-
Conditional arrows
Conditional Formatting Indicators
The up/down arrows use:
-
Green ↑ when performance meets or exceeds expectations
-
Red ↓ when performance falls below targets
Because of these indicators, users understand performance within seconds.
Click to Purchases Corporate Universities KPI Dashboard in Excel
3. KPI Trend Sheet – Visualize MTD and YTD Patterns
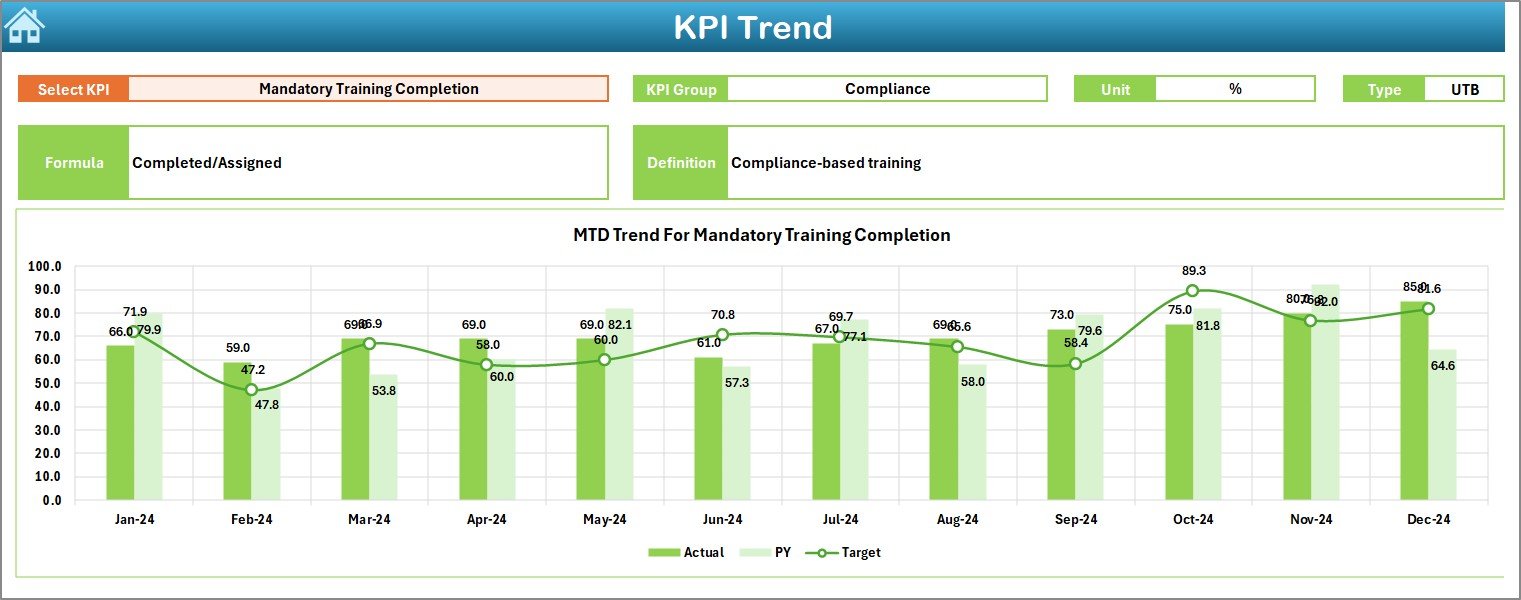
The KPI Trend sheet shows performance movement across months. You choose the KPI at cell C3 from a drop-down.
This sheet displays:
-
KPI Group
-
Unit
-
KPI Type (UTB or LTB)
-
Formula
-
KPI Definition
Trend Charts
Two charts display:
-
MTD Trend for Actual, Target, and Previous Year
-
YTD Trend for Actual, Target, and Previous Year
Trend charts help users see:
-
Which KPIs improve across months
-
Where performance drops
-
How actual performance aligns with targets
-
Whether previous year results show better or worse performance
Because these charts remain simple and visual, everyone understands the performance direction at a glance.
Click to Purchases Corporate Universities KPI Dashboard in Excel
4. Actual Numbers Input Sheet – Record Real MTD and YTD Data
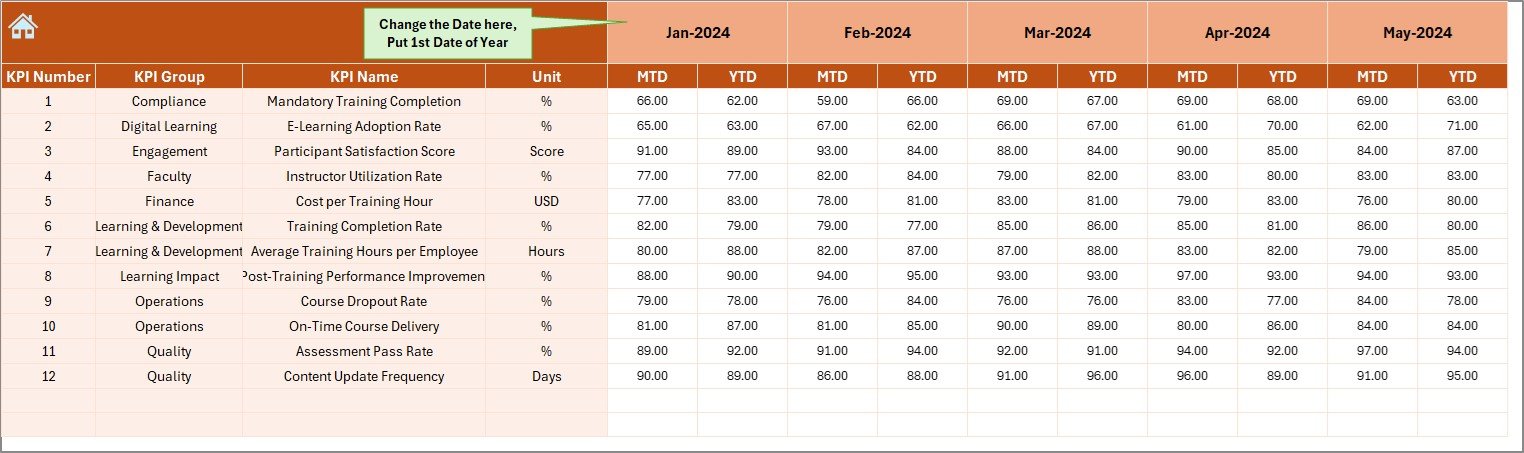
The Actual Numbers Input sheet is where users enter real performance numbers.
It includes:
-
KPI Name
-
MTD Actual
-
YTD Actual
-
Month Value
At the top (cell E1), users enter the first month of the year. Excel formulas automatically adjust the monthly timeline based on this value.
This sheet ensures accurate reporting because all actual numbers flow directly into the dashboard.
5. Target Sheet – Store Monthly MTD and YTD Targets
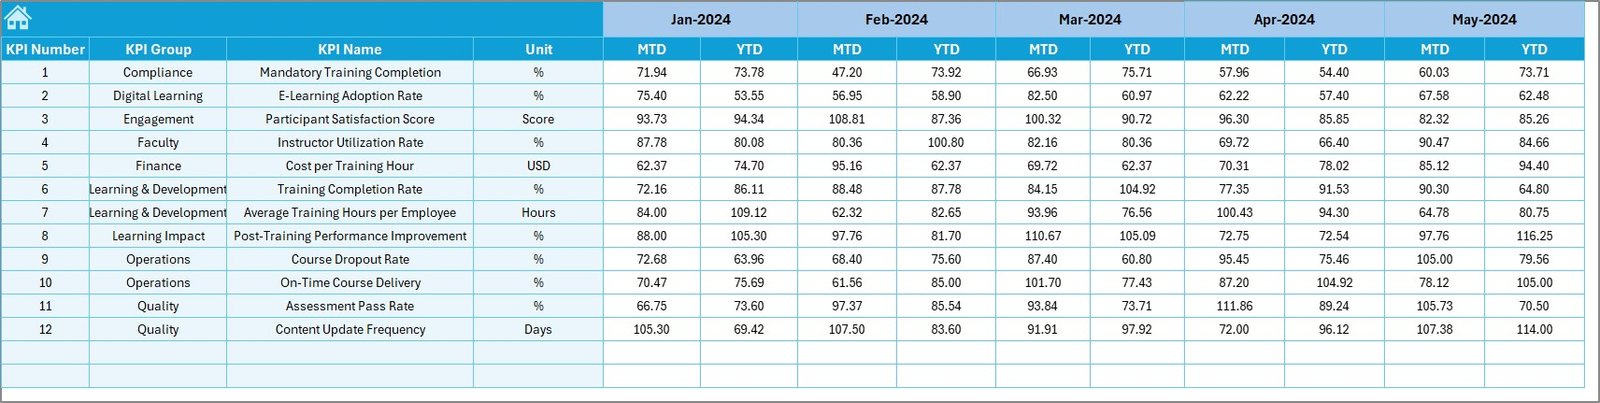
This sheet stores the planned values for every KPI:
-
KPI Name
-
MTD Target
-
YTD Target
-
Month
Targets help organizations track how learning programs should perform throughout the year. When compared with actual results, they show whether the program’s progress stays aligned with expectations.
6. Previous Year Sheet – Compare with Historical Performance
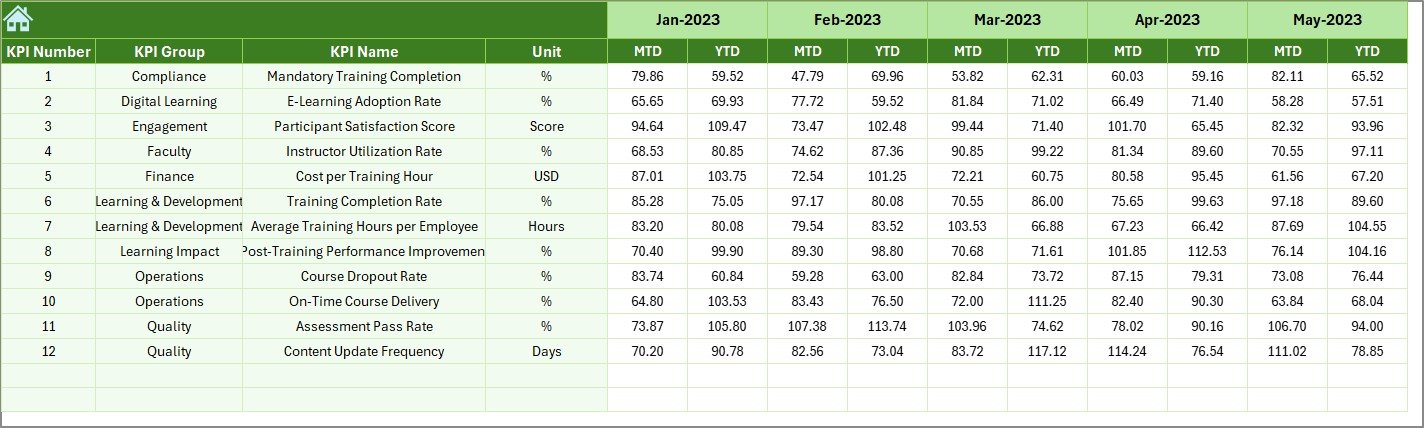
The Previous Year Numbers sheet stores the values for the last year. These include:
-
MTD Previous Year
-
YTD Previous Year
Comparing current numbers with previous year data helps identify:
-
Growth in training volume
-
Improvement in employee participation
-
Shifts in program performance
-
Better or worse learning outcomes
This sheet supports true performance benchmarking.
Click to Purchases Corporate Universities KPI Dashboard in Excel
7. KPI Definition Sheet – The Master List of All KPIs
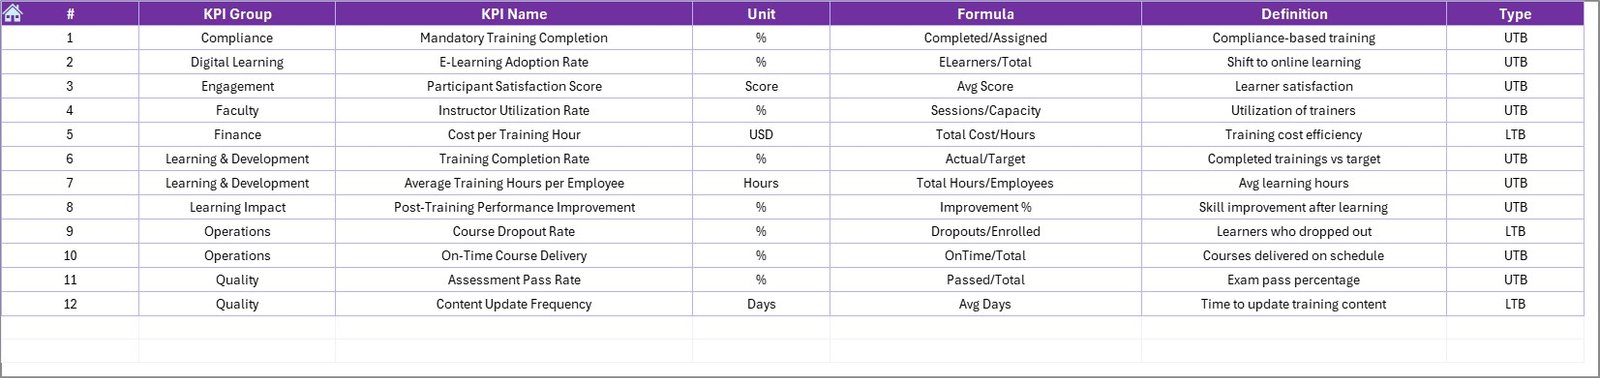
The KPI Definition sheet stores:
-
KPI Name
-
KPI Group
-
Unit
-
KPI Formula
-
KPI Definition
This sheet ensures clarity across the organization. When everyone uses the same KPI definitions, reporting stays accurate and consistent.
It also helps new employees understand how each KPI works.
Why Corporate Universities Need a KPI Dashboard
Corporate universities manage training programs, learning academies, workshops, leadership programs, online learning systems, and more. Without a proper KPI dashboard, L&D teams struggle to understand:
-
How many employees completed training
-
What percentage achieved certification
-
Which departments participate more
-
Which programs need improvement
-
How performance changes across months
-
How targets compare with actual results
A dashboard solves these issues quickly because it displays everything in one clean view.
Key KPIs Tracked in Corporate Universities
Organizations typically track KPIs such as:
-
Total Training Hours Delivered
-
Training Completion Rate
-
Certification Achievement %
-
Learner Participation Rate
-
Average Training Score
-
Employee Skill Growth Index
-
Training Cost Per Employee
-
Program Effectiveness Score
-
E-Learning Usage Rate
-
Learning Satisfaction Score
Because these KPIs use UTB (Upper the Better) and LTB (Lower the Better) logic, the dashboard uses clear indicators to show whether performance stays on track.
Advantages of Corporate Universities KPI Dashboard in Excel
1. Clear Visibility of Learning Performance
Teams understand program performance quickly because the dashboard shows MTD and YTD values in a structured manner.
2. Faster Decision-Making
Leaders respond faster when they see declining performance or areas that need attention.
3. Easy to Use
Excel makes the dashboard simple to operate even for non-technical users.
4. Real-Time Monthly Updates
Users select the month from a drop-down, and the entire dashboard refreshes instantly.
5. Better Trend Analysis
Trend charts help leaders study behavior patterns and long-term improvements.
6. Strong Alignment With Organizational Goals
Targets keep learning programs aligned with the company’s capability goals.
7. Consistent Reporting
The KPI Definition sheet ensures everyone follows the same standards.
8. No Complex Tools Required
The entire solution works within Excel, so companies save time and cost.
Click to Purchases Corporate Universities KPI Dashboard in Excel
Best Practices for Using Corporate Universities KPI Dashboard in Excel
1. Update MTD and YTD Numbers Regularly
Record numbers at the end of each month to maintain accuracy.
2. Keep KPI Names Short and Clear
Simple names help users understand the dashboard quickly.
3. Use Consistent Data Formats
Maintain the same units across all KPIs to avoid confusion.
4. Review Targets Quarterly
Organizations evolve, so update targets to match new learning strategies.
5. Use Trend Charts for Better Insights
Study long-term patterns and adjust training strategies accordingly.
6. Maintain Clean Data Entry Sheets
Keep Actual, Target, and Previous Year sheets error-free.
7. Train Teams on Dashboard Usage
Help stakeholders understand UTB, LTB, formulas, and key indicators.
8. Analyze KPI Groups Separately
Group-level analysis helps identify strengths and weaknesses.
How the Dashboard Supports Learning and Development Strategy
This dashboard improves corporate learning strategies by:
-
Tracking participation levels
-
Identifying low-performing programs
-
Highlighting successful training modules
-
Improving engagement with insights
-
Helping forecast resource needs
-
Revealing talent development gaps
When organizations monitor learning performance with a dashboard, they build a stronger and more skill-ready workforce.
Conclusion
The Corporate Universities KPI Dashboard in Excel provides a complete, ready-to-use solution for tracking learning and development performance. It supports fast decision-making, improves visibility, and helps teams align their efforts with organizational goals.
With seven sheets, trend charts, KPI definitions, MTD and YTD analysis, and comparison with previous year results, this dashboard becomes a strong tool for every L&D team. When used correctly, it improves learning impact, resource planning, and capability building across the organization.
Click to Purchases Corporate Universities KPI Dashboard in Excel
Frequently Asked Questions (FAQs)
1. What does this KPI dashboard track?
It tracks training hours, participation, completion rate, certification rate, scores, and other learning KPIs.
2. Who uses this dashboard?
HR teams, L&D managers, training coordinators, and corporate university leaders.
3. Do I need advanced Excel skills?
No. The dashboard works with drop-downs and clean input sheets.
4. Can I add more KPIs?
Yes. Add them to the KPI Definition sheet and enter data in the input sheets.
5. How often should I update data?
Update MTD and YTD data monthly for accurate reporting.
6. Can I compare current performance with last year?
Yes. The dashboard includes previous year values for comparison.
7. Does the dashboard show trends?
Yes. The KPI Trend sheet displays MTD and YTD charts.
8. Why does it include UTB and LTB?
These indicators help users understand whether higher or lower values are desirable.
Click to Purchases Corporate Universities KPI Dashboard in Excel
Visit our YouTube channel to learn step-by-step video tutorials