In today’s corporate world, employee wellness is no longer a luxury — it is a necessity. Organizations that invest in employee well-being experience higher productivity, reduced absenteeism, and improved morale. To track and measure these outcomes effectively, businesses need structured tools that provide visibility into their wellness initiatives.
That’s where the Corporate Wellness Program Report in Excel becomes an invaluable resource.
This ready-to-use Excel template provides HR professionals, wellness coordinators, and business leaders with a comprehensive framework to plan, track, and evaluate the effectiveness of corporate wellness programs. It combines visual analytics, performance metrics, and employee participation data into a single, interactive report.
Click to Purchases Corporate Wellness Program Report in Excel
What Is a Corporate Wellness Program Report in Excel?
A Corporate Wellness Program Report in Excel is an analytical tool that helps organizations evaluate the performance and impact of their employee wellness initiatives.
It consolidates data such as participation rates, wellness scores, cost utilization, and departmental comparisons into an easy-to-read Excel dashboard. This enables HR teams to measure how effectively wellness activities are improving employee health and engagement.
Using Excel as the foundation allows for flexibility, customization, and scalability. Whether your company runs fitness sessions, mental health workshops, nutrition programs, or annual wellness checks, this report can adapt to your specific data structure.
Purpose of the Corporate Wellness Program Report
The primary purpose of this report is to help decision-makers gain real-time insights into wellness performance. It enables HR teams to:
-
Monitor employee participation and engagement levels
-
Evaluate pre- and post-wellness health scores
-
Track budgets and expenses associated with wellness activities
-
Compare results across departments, genders, and locations
-
Make data-driven decisions to enhance future programs
By visualizing KPIs in one place, this Excel report makes wellness management measurable, efficient, and transparent.
Structure of the Corporate Wellness Program Report in Excel
This report consists of three primary pages and one support sheet, each serving a specific function in the analysis process.
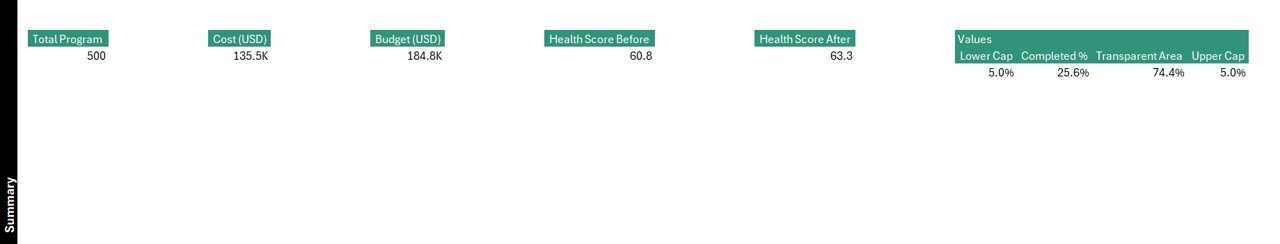
Summary Page
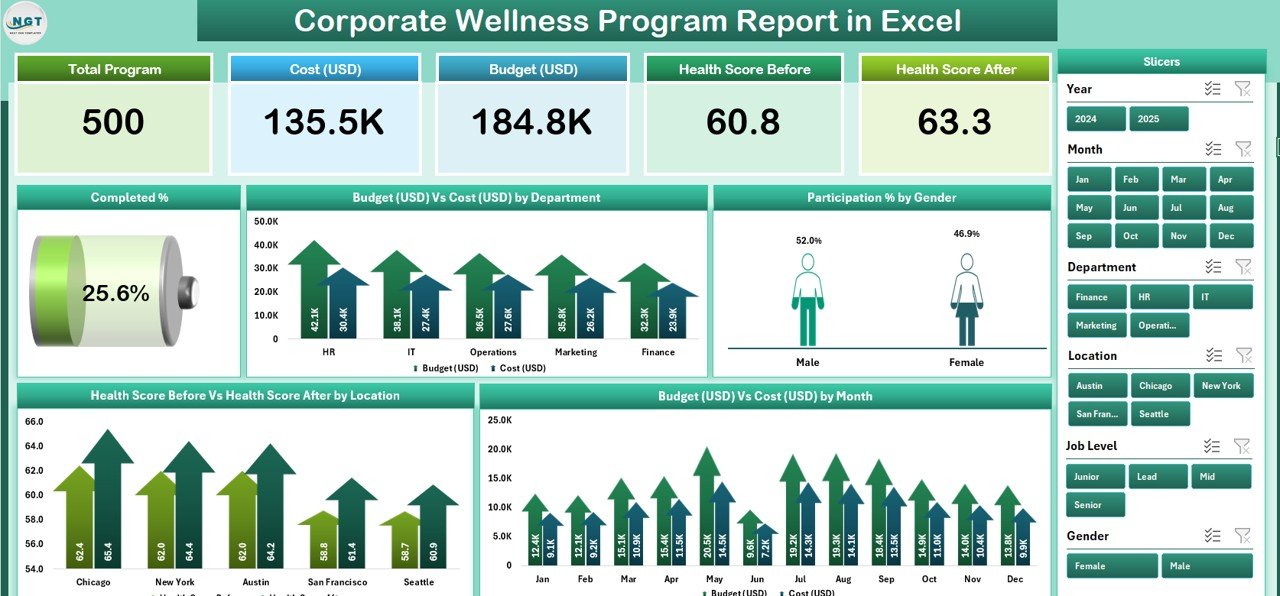
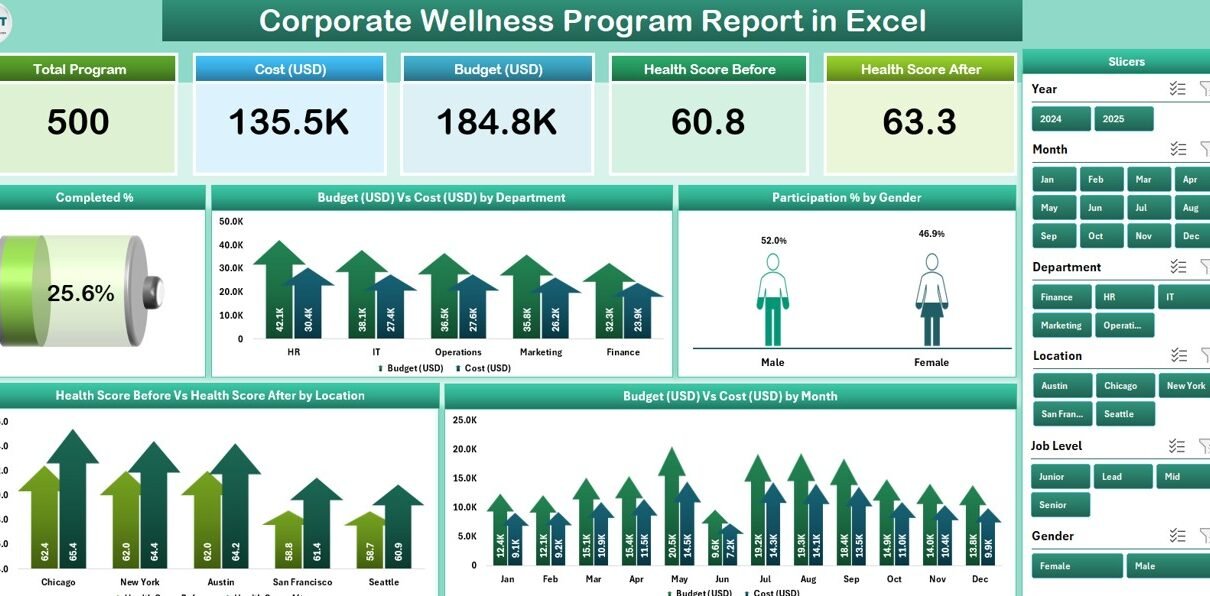
The Summary Page acts as the central dashboard — the heart of your wellness analytics.
At the top, you’ll find five key cards displaying high-level metrics such as:
✅ Total Participants
✅ Average Health Score
✅ Completed %
✅ Budget (USD)
✅ Cost (USD)
On the right-hand side, you’ll find a dynamic slicer that allows users to filter data by department, gender, or location, making analysis fast and interactive.
Charts and Visual Insights
The Summary Page includes five insightful charts:
-
Completed % – Shows overall program completion trends.
-
Budget (USD) vs. Cost (USD) by Department – Compares planned vs. actual wellness spending across departments.
-
Participation % by Gender – Displays engagement levels by gender to ensure inclusivity.
-
Health Score Before vs. After by Location – Measures the real impact of wellness initiatives.
-
Budget (USD) vs. Cost (USD) by Month – Tracks financial efficiency throughout the year.
This visual representation simplifies complex data into actionable insights, enabling HR managers to assess program success instantly.
Report Page
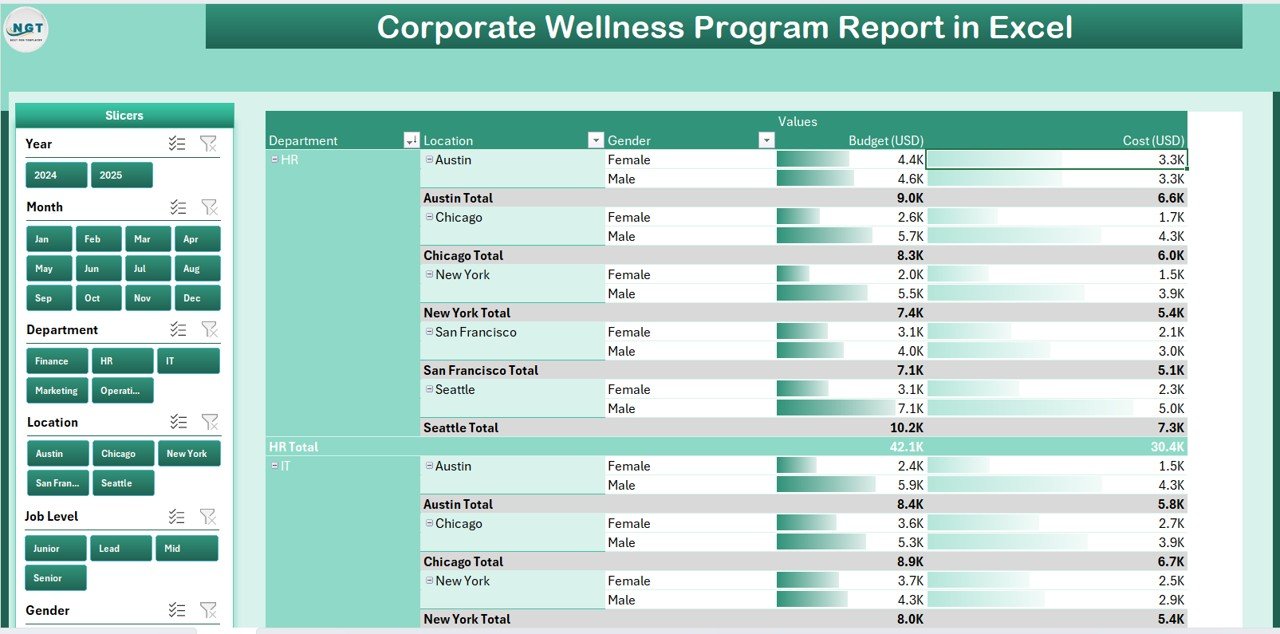
The Report Page provides a more detailed, tabular representation of wellness metrics.
It features a left-side slicer for filtering by department, program type, or date range, and an information table that lists all individual or aggregated data points such as:
-
Employee Name or ID
-
Department
-
Wellness Program Type
-
Participation Status
-
Health Score (Before & After)
-
Program Cost
-
Completion Date
This page is ideal for exporting detailed reports or sharing specific departmental results during management reviews.
Data Sheet
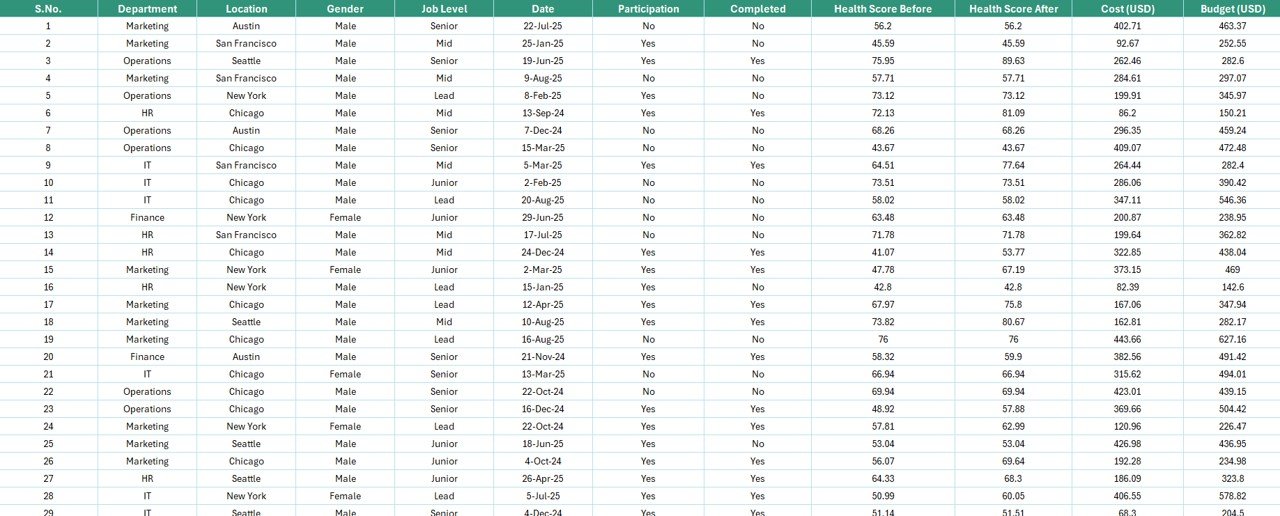
The Data Sheet is the foundation of the report. It stores all raw data collected from wellness initiatives.
Click to Purchases Corporate Wellness Program Report in Excel
Here you’ll find the core data columns such as:
-
Employee ID
-
Department
-
Gender
-
Location
-
Health Score (Before & After)
-
Budget Allocation
-
Actual Cost
-
Participation Status
-
Program Completion %
This sheet feeds data into both the Summary Page and Report Page, ensuring that visualizations and metrics stay updated in real time as new information is added.
Support Sheet
The Support Sheet stores reference lists and lookup values used in dropdown menus and slicers.
It typically includes:
-
Department list
-
Program types
-
Gender and location values
-
Status options (Active, Completed, Pending)
This setup keeps data entry consistent and minimizes human error, making the report both reliable and scalable.
How to Use the Corporate Wellness Program Report in Excel
Using this report is simple, even for beginners. Follow these steps:
-
Input Raw Data
Begin by entering or importing employee wellness data into the Data Sheet. -
Update Reference Lists
Modify the Support Sheet to match your company’s departments and program categories. -
Review Summary Dashboard
Open the Summary Page to view automatic visualizations and KPIs. -
Filter Data
Use the right-side and left-side slicers to analyze wellness performance by department, gender, or region. -
Generate Reports
Export the Report Page or take screenshots from the Summary Page for management presentations.
With Excel’s built-in charting and pivot table features, you can customize views or add additional KPIs to suit your organization’s goals.
Key Metrics Tracked in the Report
The Corporate Wellness Program Report in Excel monitors all essential wellness metrics in one place. Key KPIs include:
-
Participation Rate – Percentage of employees engaged in wellness activities.
-
Program Completion Rate – Ratio of employees who completed a wellness cycle.
-
Average Health Score – Comparison of pre- and post-program wellness scores.
-
Budget vs. Actual Cost – Financial efficiency of the program.
-
Gender Participation – Analysis of inclusivity in participation.
-
Location-wise Performance – Regional variations in health improvement.
-
ROI on Wellness Spending – Evaluation of returns from the wellness investments.
By combining these indicators, HR leaders can measure both tangible and intangible outcomes of their initiatives.
Advantages of Using the Corporate Wellness Program Report in Excel
Implementing this Excel-based wellness report offers numerous benefits for organizations of all sizes.
✅ 1. Easy to Use and Customize
Excel provides a familiar interface. You don’t need advanced technical skills to operate the report. Formulas and slicers are pre-built for instant analysis.
✅ 2. Centralized View of Wellness Performance
All wellness metrics — from participation rates to costs — are consolidated into one dashboard. This saves time and improves accuracy.
✅ 3. Data-Driven Decision Making
With visual comparisons between budget and actual costs, HR teams can optimize future spending and identify underperforming programs.
✅ 4. Encourages Accountability
Since departments can view their own performance, this report promotes healthy competition and accountability within teams.
✅ 5. Tracks Real Impact
Comparing health scores before and after program participation helps HR evaluate the effectiveness of specific initiatives.
✅ 6. Supports Continuous Improvement
Insights derived from the report help organizations fine-tune their wellness strategies for better long-term outcomes.
Best Practices for Using the Corporate Wellness Program Report in Excel
Click to Purchases Corporate Wellness Program Report in Excel
To get the most out of this report, organizations should follow these best practices:
💡 1. Keep Data Updated Regularly
Update your data sheet at least once a month to ensure that metrics and charts reflect current performance.
💡 2. Maintain Consistent Data Entry
Use dropdowns and validation lists from the Support Sheet to avoid discrepancies.
💡 3. Include Both Qualitative and Quantitative Metrics
Apart from numeric scores, add employee feedback or satisfaction ratings to get a holistic view.
💡 4. Track Budgets and ROI Closely
Always compare planned vs. actual spending. This allows you to measure financial efficiency and justify future investments.
💡 5. Analyze Trends Over Time
Use monthly data comparison charts to identify patterns or anomalies in participation and outcomes.
💡 6. Share the Dashboard Across Teams
Encourage transparency by sharing the report during leadership and wellness committee meetings.
💡 7. Automate Data Import (Optional)
Advanced users can link Excel with HR databases or employee survey tools to automate data refreshes.
Tips for Improving Wellness Reporting in Excel
If you want to take your wellness tracking to the next level, consider these expert tips:
-
Add Conditional Formatting: Highlight high or low scores with colors for quick visual interpretation.
-
Use Pivot Tables: Summarize large data sets easily with pivot tables for departments or months.
-
Add Goal Indicators: Use icons like green checkmarks or red crosses to visualize goal achievement.
-
Incorporate Feedback Columns: Add a “Feedback” field in your data sheet to capture employee suggestions.
-
Create an Annual Summary: Combine monthly sheets into one for a year-end performance report.
These enhancements will make your report more interactive and useful during executive reviews.
Why Excel Is Ideal for Corporate Wellness Reporting
While there are many analytics tools available, Excel remains one of the most powerful platforms for wellness reporting because of its:
-
Flexibility: Can adapt to any organization size or structure
-
Affordability: No expensive software licenses required
-
Interactivity: Offers slicers, charts, and conditional formatting
-
Integration: Works seamlessly with other Microsoft and HR tools
-
Portability: Easily shared via email or cloud storage
Excel strikes the perfect balance between simplicity and functionality, making it a favorite among HR professionals.
Conclusion
Employee wellness has become a cornerstone of modern business success. Measuring, monitoring, and improving wellness initiatives ensures that employees remain healthy, engaged, and motivated.
The Corporate Wellness Program Report in Excel is a powerful yet simple solution that helps organizations visualize wellness data, manage costs, and assess program effectiveness. By using this template, HR leaders can make data-driven decisions that strengthen workplace culture and overall productivity.
From tracking participation rates to evaluating health score improvements, this Excel-based report provides all the insights you need to build a thriving and healthy organization.
Frequently Asked Questions (FAQs)
1. What is a Corporate Wellness Program Report in Excel?
It is a ready-to-use Excel template designed to track and analyze the performance of employee wellness programs, including participation rates, costs, and health outcomes.
2. Who can use this report?
HR professionals, wellness coordinators, department heads, and business leaders who want to monitor employee health initiatives can use this tool.
3. What type of data should be included in the report?
Include details like department, gender, health score before and after, budget, cost, participation status, and completion rates.
4. Can this report be customized?
Yes, it’s fully customizable. You can modify KPIs, add charts, or update dropdowns according to your organization’s structure.
5. How often should the report be updated?
Ideally, update it monthly or quarterly, depending on the frequency of your wellness activities.
6. What are the main benefits of using this report?
The report simplifies tracking, ensures transparency, and provides actionable insights to improve employee well-being and program ROI.
7. Does it require advanced Excel skills?
Not at all. The template is beginner-friendly, with pre-built slicers, formulas, and charts for instant analysis.
Visit our YouTube channel to learn step-by-step video tutorials