The cosmetics and skincare industry is highly competitive, fast-moving, and data-driven. Brands must track sales performance, marketing efficiency, production quality, inventory, and customer trends at the same time. However, when data stays scattered across multiple Excel files, decision-making becomes slow and reactive.
Therefore, a Cosmetics and Skincare KPI Dashboard in Excel becomes an essential business tool. It transforms raw numbers into clear KPIs, visual trends, and actionable insights. Moreover, Excel provides flexibility, affordability, and ease of use, which makes this dashboard ideal for small brands, growing businesses, and large cosmetic companies alike.
In this detailed article, you will learn what a Cosmetics and Skincare KPI Dashboard in Excel is, why it matters, how it works, its structure, key features, advantages, best practices, and frequently asked questions. This guide also explains how a 7-worksheet Excel dashboard supports smarter planning and better decision-making in the beauty industry.
Click to Purchases Cosmetics and Skincare KPI Dashboard in Excel
What Is a Cosmetics and Skincare KPI Dashboard in Excel?
A Cosmetics and Skincare KPI Dashboard in Excel is a structured reporting and visualization tool that tracks key performance indicators related to beauty products and skincare operations. Instead of reviewing multiple reports, users monitor performance in one interactive Excel file.
Moreover, this dashboard focuses on MTD (Month-to-Date) and YTD (Year-to-Date) performance. As a result, business owners and managers can compare current results with targets and previous year values instantly.
Because the dashboard uses Excel formulas, charts, and conditional formatting, it remains dynamic, transparent, and easy to customize.
Why Do Cosmetics and Skincare Businesses Need a KPI Dashboard?
The beauty industry faces constant challenges such as changing customer preferences, seasonal demand, and strong competition. Therefore, tracking performance accurately becomes critical.
Here is why a Cosmetics and Skincare KPI Dashboard in Excel is important:
-
It centralizes KPI tracking in one file
-
It improves visibility into sales and operational performance
-
It highlights gaps between targets and actuals
-
It supports faster and data-driven decisions
-
It reduces manual reporting effort
Additionally, Excel dashboards allow teams to update data quickly without technical skills.
Click to Purchases Cosmetics and Skincare KPI Dashboard in Excel
What Are the Key Objectives of a Cosmetics and Skincare KPI Dashboard?
An effective KPI dashboard focuses on performance, growth, and efficiency. Therefore, the main objectives include:
-
Tracking MTD and YTD performance for all KPIs
-
Comparing actual results with targets
-
Analyzing trends over time
-
Identifying underperforming KPIs
-
Supporting strategic planning and forecasting
Because the dashboard updates automatically, stakeholders always work with accurate and current insights.
How Is the Cosmetics and Skincare KPI Dashboard in Excel Structured?
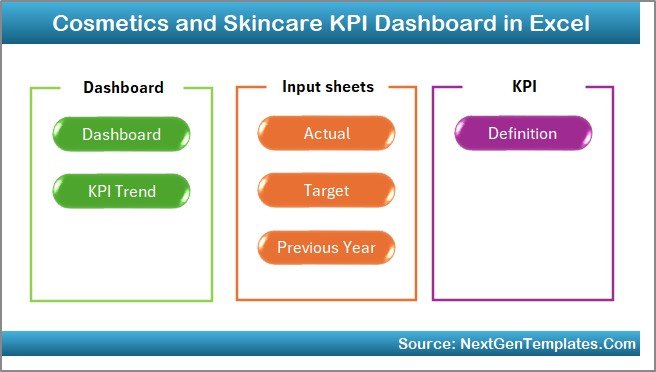
This ready-to-use dashboard contains 7 well-organized worksheets, each serving a specific purpose. Together, they create a complete KPI management system.
Let’s explore each worksheet in detail.
1) What Is the Role of the Home Sheet?
The Home Sheet works as an index or navigation page.
Key Highlights of the Home Sheet
-
It contains 6 navigation buttons
-
Each button links to a specific worksheet
-
It improves user experience and usability
-
It reduces time spent searching for sheets
Because of this design, users can move between dashboard sections with just one click.
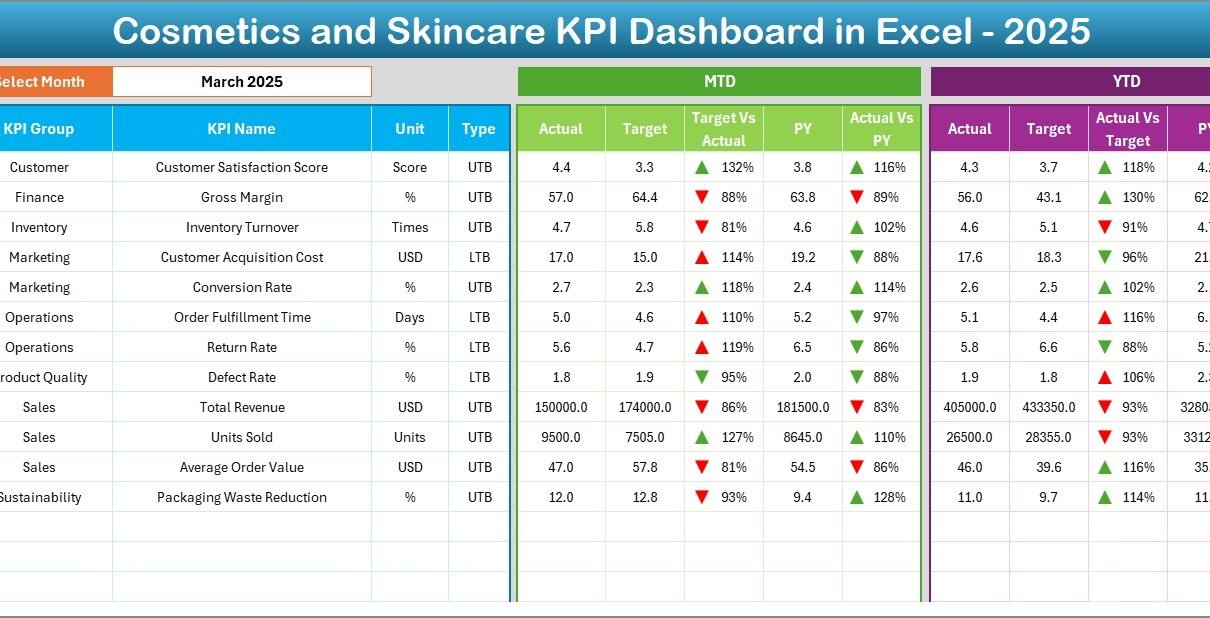
2) What Does the Dashboard Sheet Show?
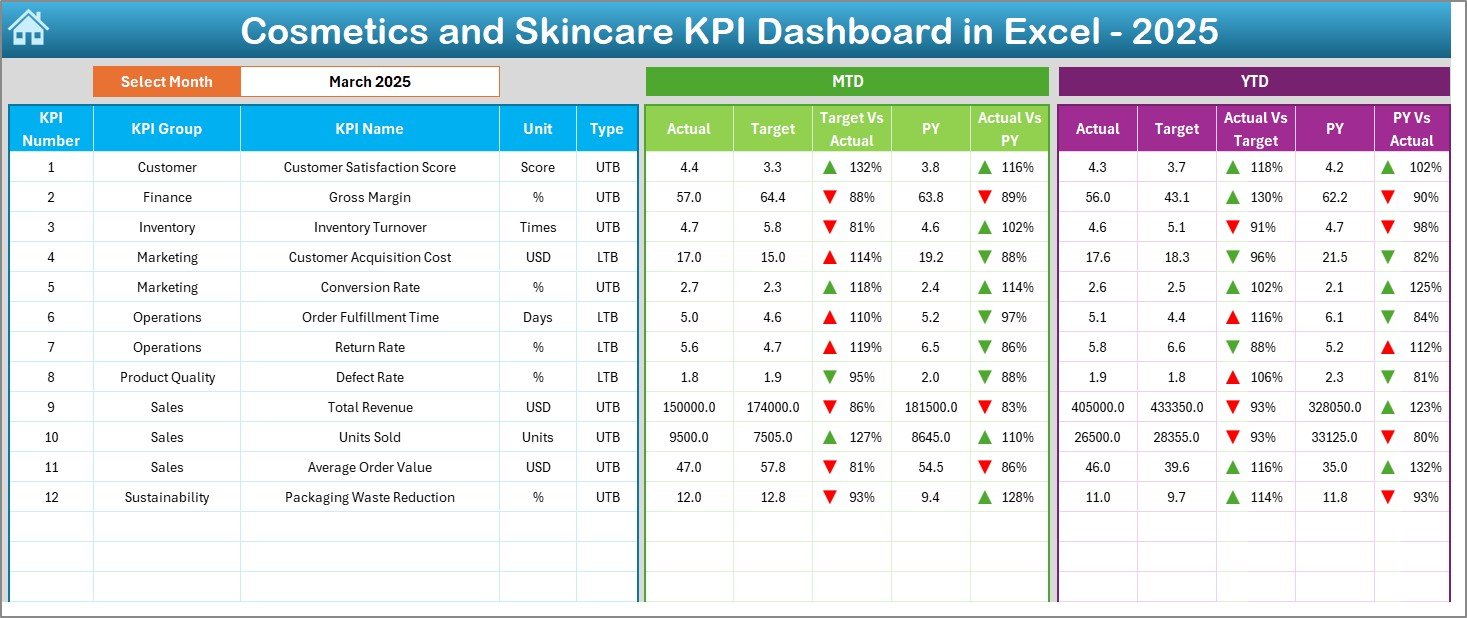
The Dashboard Sheet is the core of the KPI dashboard. It provides a consolidated view of all KPIs.
Month Selection Feature
On cell D3, users select the Month from a dropdown. Once selected, the entire dashboard updates automatically for that month.
KPIs Displayed on the Dashboard
The dashboard shows:
-
MTD Actual values
-
MTD Target values
-
MTD Previous Year (PY) values
-
YTD Actual values
-
YTD Target values
-
YTD Previous Year (PY) values
Variance Analysis with Visual Indicators
To improve clarity, the dashboard includes:
-
Target vs Actual comparison
-
Previous Year vs Actual comparison
-
Conditional formatting with up/down arrows
As a result, users quickly identify positive and negative performance trends.
Click to Purchases Cosmetics and Skincare KPI Dashboard in Excel
3) How Does the KPI Trend Sheet Help Analysis?
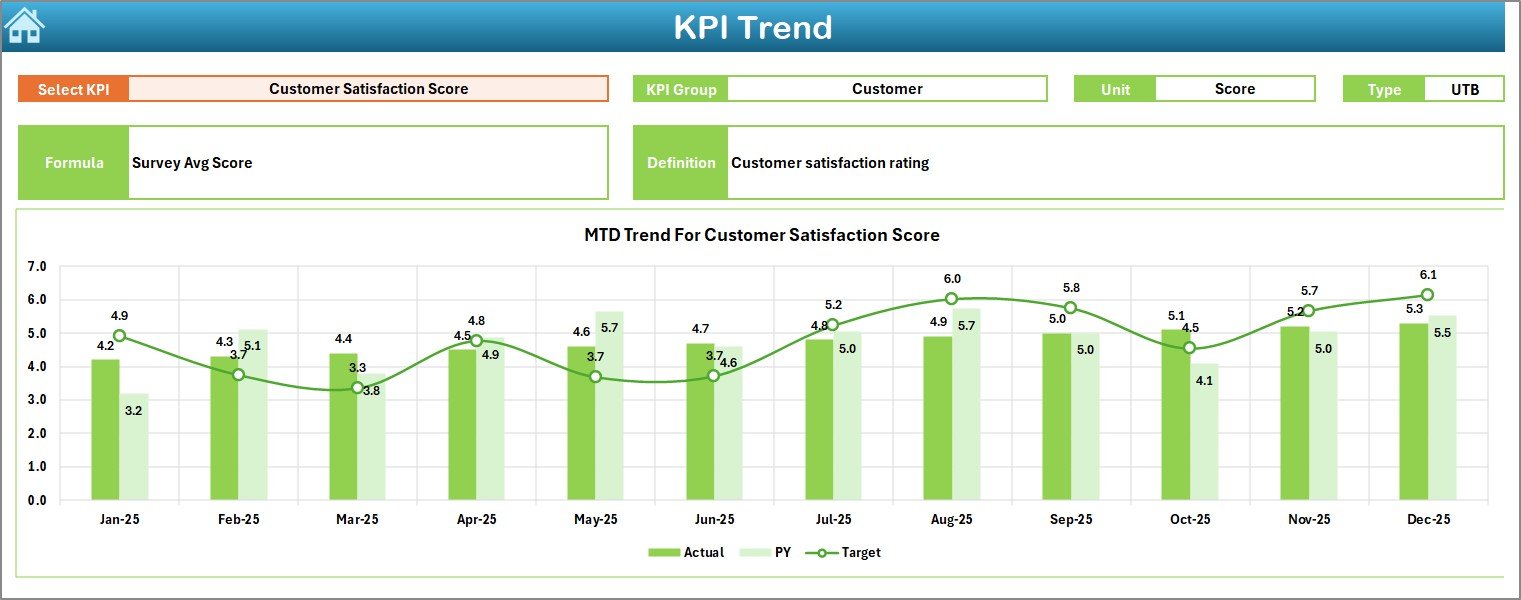
The KPI Trend Sheet provides detailed trend analysis for individual KPIs.
KPI Selection
Users select a KPI Name from a dropdown available in cell C3. Once selected, the sheet updates dynamically.
KPI Details Displayed
This sheet shows:
-
KPI Group
-
KPI Unit
-
KPI Type (LTB – Lower the Better / UTB – Upper the Better)
-
KPI Formula
-
KPI Definition
Trend Charts
Additionally, the sheet displays:
-
MTD trend chart for Actual, Target, and PY
-
YTD trend chart for Actual, Target, and PY
Because of these charts, users understand performance movement over time, not just current results.
Click to Purchases Cosmetics and Skincare KPI Dashboard in Excel
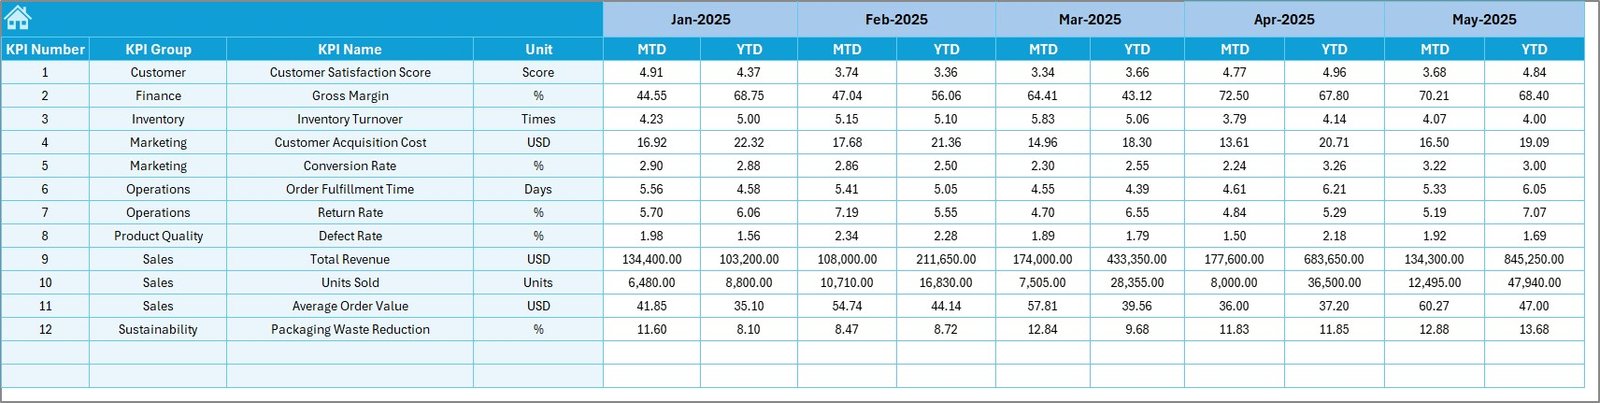
4) What Is the Purpose of the Actual Numbers Input Sheet?
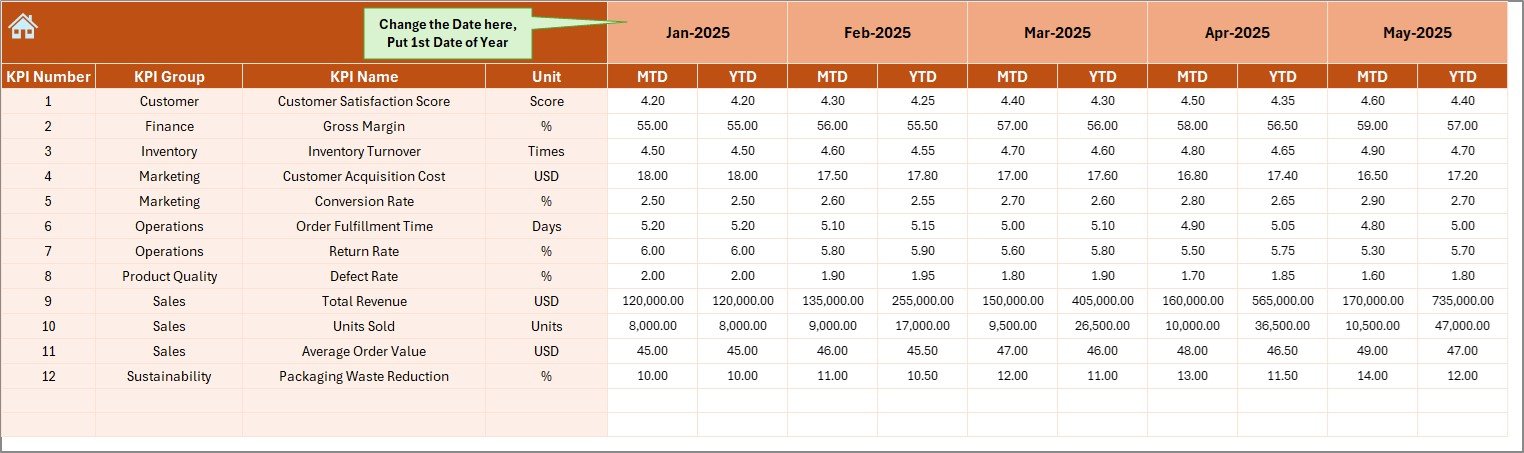
The Actual Numbers Input Sheet is the data entry sheet for current year performance.
How This Sheet Works
-
Users enter MTD and YTD actual values for each KPI
-
The month can be changed from cell E1
-
Users input the first month of the year in cell E1
-
All calculations update automatically
This design ensures data consistency and easy maintenance.
5) How Does the Target Sheet Support Goal Tracking?
The Target Sheet stores planned performance values.
Key Features of the Target Sheet
-
Users enter MTD Target values
-
Users enter YTD Target values
-
Targets align with each KPI
-
The dashboard uses these values for variance analysis
As a result, teams track progress against goals clearly.
6) Why Is the Previous Year Number Sheet Important?
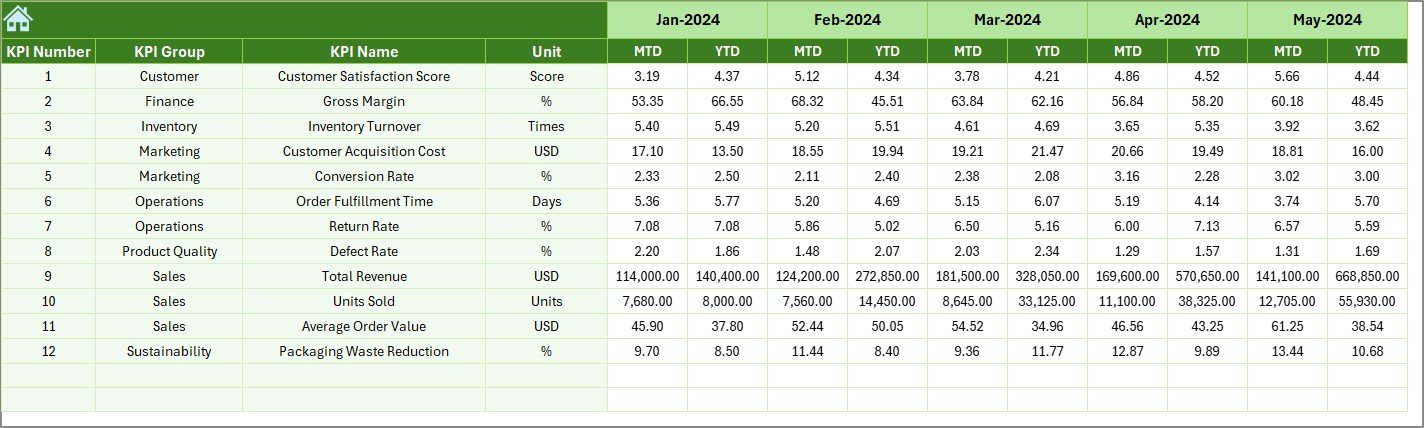
The Previous Year Number Sheet enables year-over-year comparison.
Benefits of This Sheet
-
Stores last year’s MTD and YTD values
-
Enables PY vs Actual comparison
-
Supports growth and trend analysis
-
Improves forecasting accuracy
Because historical data matters, this sheet adds strong analytical depth.
7) What Does the KPI Definition Sheet Contain?
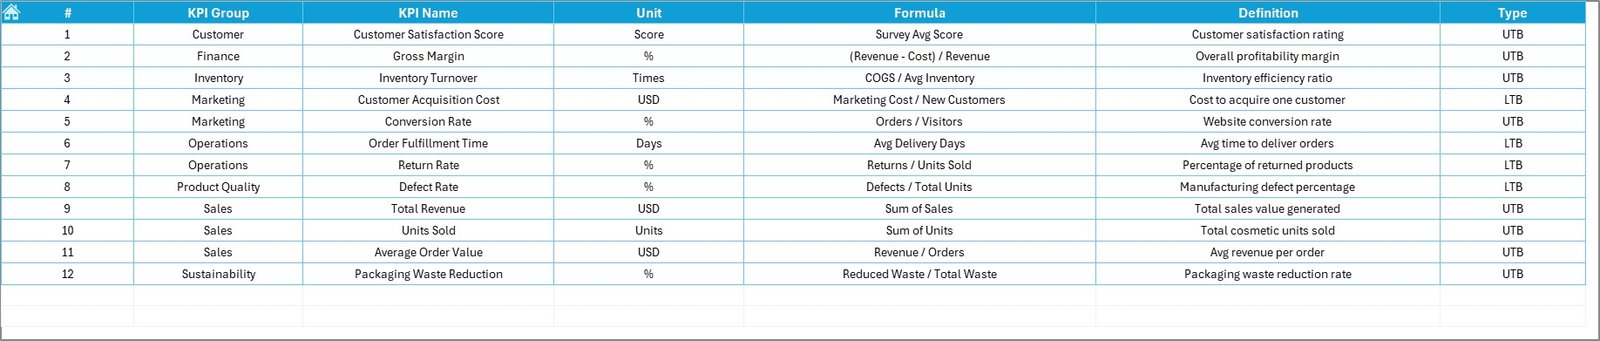
The KPI Definition Sheet acts as a reference guide.
Information Captured in This Sheet
-
KPI Name
-
KPI Group
-
Unit of Measurement
-
KPI Formula
-
KPI Definition
This sheet ensures clarity, consistency, and transparency, especially when multiple users access the dashboard.
What KPIs Can Be Tracked in a Cosmetics and Skincare Dashboard?
A Cosmetics and Skincare KPI Dashboard can track KPIs such as:
-
Sales Revenue
-
Gross Margin %
-
Marketing Spend Efficiency
-
Inventory Turnover
-
Order Fulfillment Rate
-
Customer Return Rate
-
Product Defect Rate
-
Production Yield
-
On-Time Delivery %
-
Customer Satisfaction Score
These KPIs align business performance with operational efficiency.
Click to Purchases Cosmetics and Skincare KPI Dashboard in Excel
Advantages of Cosmetics and Skincare KPI Dashboard in Excel
A Cosmetics and Skincare KPI Dashboard in Excel offers several advantages.
Key Advantages
-
📊 Centralized KPI Tracking
All KPIs appear in one Excel file -
⚡ Faster Insights
Automatic calculations save time -
🎯 Target Monitoring
Clear Target vs Actual comparison -
📈 Trend Analysis
MTD and YTD trends improve forecasting -
💡 Better Decision-Making
Visual indicators highlight issues quickly -
🔧 Easy Customization
Modify KPIs without technical skills
Because of these benefits, Excel dashboards remain a popular choice in the beauty industry.
How Does This Dashboard Support Business Growth?
This dashboard supports growth by:
-
Identifying high-performing KPIs
-
Highlighting weak areas early
-
Improving accountability across teams
-
Supporting data-driven planning
-
Enhancing performance reviews
As a result, leadership focuses on strategic actions instead of manual reporting.
Best Practices for the Cosmetics and Skincare KPI Dashboard in Excel
To get maximum value from your dashboard, follow these best practices.
Best Practices You Should Follow
-
✔️ Define KPIs aligned with business goals
-
✔️ Keep formulas simple and consistent
-
✔️ Update actuals regularly
-
✔️ Review targets periodically
-
✔️ Use conditional formatting wisely
-
✔️ Maintain clean and validated data
-
✔️ Protect formula cells to avoid errors
By following these practices, your dashboard stays accurate, reliable, and user-friendly.
Click to Purchases Cosmetics and Skincare KPI Dashboard in Excel
Who Can Use a Cosmetics and Skincare KPI Dashboard?
This dashboard benefits:
-
Cosmetics brand owners
-
Skincare product managers
-
Sales and marketing teams
-
Operations managers
-
Finance and planning teams
Each role gains insights without needing advanced Excel knowledge.
How Is Excel Better Than Manual Reporting for KPI Tracking?
Manual reports consume time and increase errors. In contrast, Excel dashboards:
-
Automate calculations
-
Update instantly with new data
-
Provide visual insights
-
Improve collaboration
Therefore, Excel dashboards significantly improve productivity.
What Makes This 7-Sheet KPI Dashboard Effective?
This dashboard works effectively because it:
-
Separates input, logic, and output clearly
-
Combines summary and detailed analysis
-
Uses navigation buttons for ease of use
-
Supports MTD, YTD, Target, and PY analysis
Each worksheet plays a clear role, which improves usability.
Conclusion: Why Should You Use a Cosmetics and Skincare KPI Dashboard in Excel?
A Cosmetics and Skincare KPI Dashboard in Excel helps beauty businesses monitor performance, track goals, and analyze trends in a structured way. It reduces reporting effort, improves visibility, and supports data-driven decisions.
Moreover, its 7-worksheet structure ensures clarity, flexibility, and scalability. Whether you manage a small skincare brand or a growing cosmetics company, this dashboard becomes a powerful performance management tool.
Click to Purchases Cosmetics and Skincare KPI Dashboard in Excel
Frequently Asked Questions (FAQs)
What is a Cosmetics and Skincare KPI Dashboard in Excel?
It is an Excel-based tool that tracks beauty industry KPIs with MTD, YTD, Target, and PY analysis.
How many worksheets does this dashboard include?
This dashboard includes 7 worksheets, including Dashboard, Trends, Inputs, Targets, and Definitions.
Can I customize KPIs in this dashboard?
Yes, you can easily add or modify KPIs in the KPI Definition sheet.
Does this dashboard support MTD and YTD analysis?
Yes, it supports both MTD and YTD performance tracking.
Is this dashboard suitable for small beauty brands?
Yes, Excel makes it affordable and easy to use for small and mid-sized businesses.
Do I need advanced Excel skills to use this dashboard?
No, basic Excel knowledge is enough to update and use this dashboard.
Click to Purchases Cosmetics and Skincare KPI Dashboard in Excel
Visit our YouTube channel to learn step-by-step video tutorials