The cosmetics and skincare industry is evolving rapidly. New products launch frequently, customer expectations change quickly, and competition continues to grow. Therefore, beauty brands must track performance accurately, consistently, and visually. However, when KPI data remains scattered across Excel sheets, monitoring performance becomes time-consuming and inefficient.
That is why a Cosmetics and Skincare KPI Dashboard in Power BI becomes a powerful solution. It transforms raw Excel data into interactive visuals, KPI cards, trend analysis, and performance comparisons. Moreover, Power BI enables beauty businesses to track MTD, YTD, targets, and previous year performance in one centralized dashboard.
In this detailed guide, you will learn what a Cosmetics and Skincare KPI Dashboard in Power BI is, why it is important, how it works, its structure, key features, advantages, best practices, and frequently asked questions. This article also explains how a 3-page Power BI dashboard supports smarter and faster decision-making for cosmetics and skincare brands.
Click to Purchases Cosmetics and Skincare KPI Dashboard in Power BI
What Is a Cosmetics and Skincare KPI Dashboard in Power BI?
A Cosmetics and Skincare KPI Dashboard in Power BI is an interactive business intelligence tool designed to monitor and analyze key performance indicators for beauty and skincare businesses. Instead of reviewing multiple spreadsheets, users see all KPIs in one dynamic Power BI report.
Moreover, this dashboard connects to an Excel data source, which makes it easy to maintain and update. Once users update the Excel file, Power BI refreshes the visuals automatically. As a result, stakeholders always work with up-to-date performance data.
Because Power BI supports slicers, drill-through, and combo charts, the dashboard delivers deep insights with minimal effort.
Why Do Cosmetics and Skincare Businesses Need a KPI Dashboard in Power BI?
The beauty industry depends on sales performance, marketing efficiency, operational control, and customer satisfaction. Therefore, tracking KPIs accurately becomes critical.
Here is why a Cosmetics and Skincare KPI Dashboard in Power BI is essential:
-
It centralizes KPI reporting in one dashboard
-
It tracks MTD and YTD performance effortlessly
-
It compares actuals with targets and previous year values
-
It improves transparency across teams
-
It supports faster and data-driven decisions
Additionally, Power BI dashboards reduce manual reporting work and improve data consistency.
What Are the Key Objectives of a Cosmetics and Skincare KPI Dashboard?
An effective KPI dashboard focuses on performance monitoring and continuous improvement. Therefore, its key objectives include:
-
Tracking KPI performance at MTD and YTD levels
-
Monitoring target achievement and gaps
-
Comparing current year performance with previous year
-
Identifying underperforming KPIs early
-
Supporting strategic and operational planning
Because the dashboard updates dynamically, leaders always see accurate and reliable insights.
Click to Purchases Cosmetics and Skincare KPI Dashboard in Power BI
How Is the Cosmetics and Skincare KPI Dashboard in Power BI Structured?
This ready-to-use dashboard includes 3 well-designed pages in the Power BI Desktop file. Each page serves a specific analytical purpose.
Let’s explore each page in detail.
1) What Does the Summary Page Show in the Dashboard?
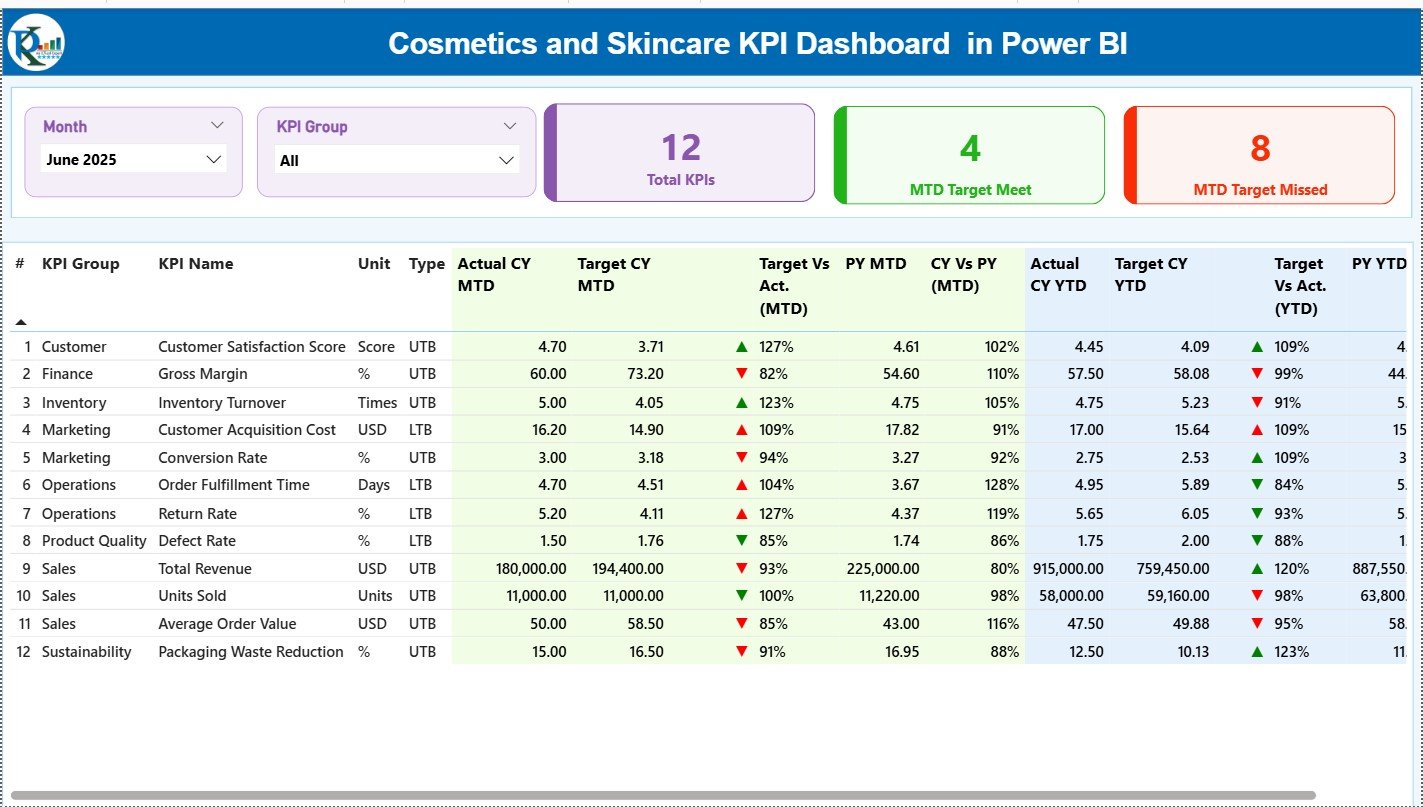
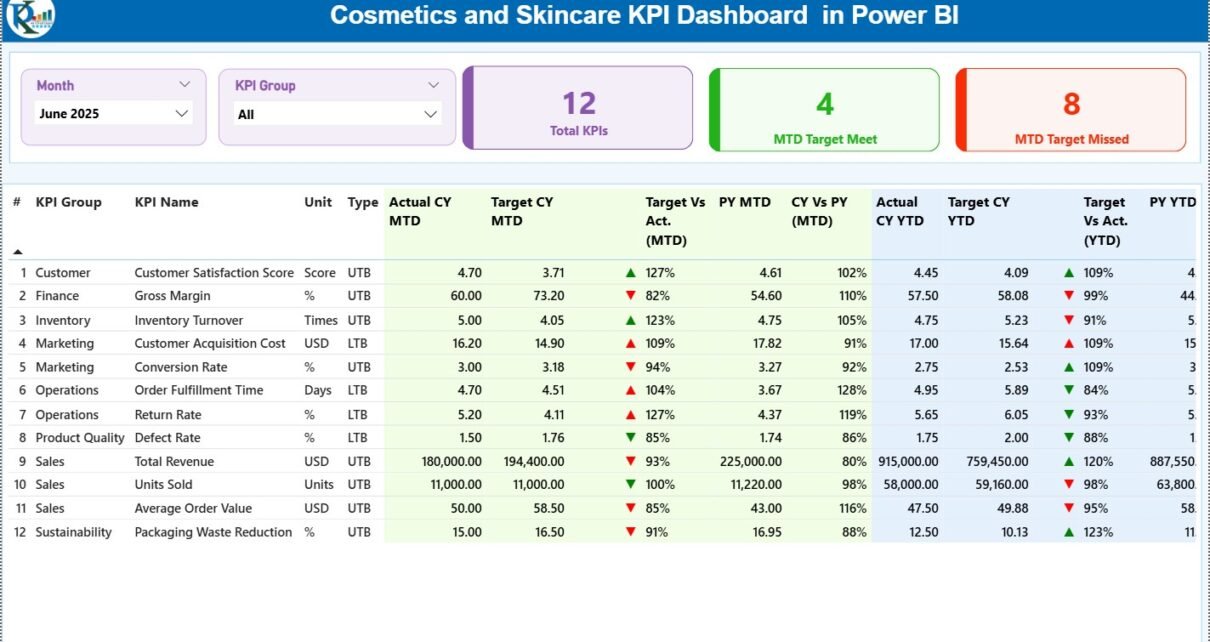
The Summary Page is the main landing page of the dashboard. It provides a complete snapshot of KPI performance.
Slicers on the Summary Page
At the top of the page, the dashboard includes:
-
Month slicer
-
KPI Group slicer
These slicers allow users to filter data instantly. As a result, users can analyze performance for a specific month or KPI category without changing the underlying data.
KPI Cards on the Summary Page
The Summary Page displays 3 KPI cards:
-
Total KPIs Count – Total number of KPIs tracked
-
MTD Target Meet Count – Number of KPIs meeting targets
-
MTD Target Missed Count – Number of KPIs missing targets
These cards provide a quick performance overview for management.
Detailed KPI Table on the Summary Page
Below the cards, the dashboard displays a detailed KPI table. This table forms the core of KPI analysis.
The table includes the following columns:
-
KPI Number – Sequence number of the KPI
-
KPI Group – Category or group of the KPI
-
KPI Name – Name of the KPI
-
Unit – Unit of measurement
-
Type – KPI type (LTB – Lower the Better / UTB – Upper the Better)
MTD Performance Analysis Columns
For MTD analysis, the table shows:
-
Actual CY MTD – Current year actual MTD value
-
Target CY MTD – Current year target MTD value
-
MTD Icon – ▲ or ▼ icons with green/red color to indicate performance
-
Target vs Actual (MTD) – Actual ÷ Target (percentage)
-
PY MTD – Previous year MTD value
-
CY vs PY (MTD) – Current year MTD ÷ Previous year MTD
These columns help users evaluate short-term performance clearly.
YTD Performance Analysis Columns
For YTD analysis, the table includes:
-
Actual CY YTD – Current year actual YTD value
-
Target CY YTD – Current year target YTD value
-
YTD Icon – ▲ or ▼ icons to show YTD performance
-
Target vs Actual (YTD) – Actual ÷ Target (percentage)
-
PY YTD – Previous year YTD value
-
CY vs PY (YTD) – Current year YTD ÷ Previous year YTD
Because of this structure, users analyze both short-term and long-term performance in one view.
Click to Purchases Cosmetics and Skincare KPI Dashboard in Power BI
2) How Does the KPI Trend Page Improve Analysis?
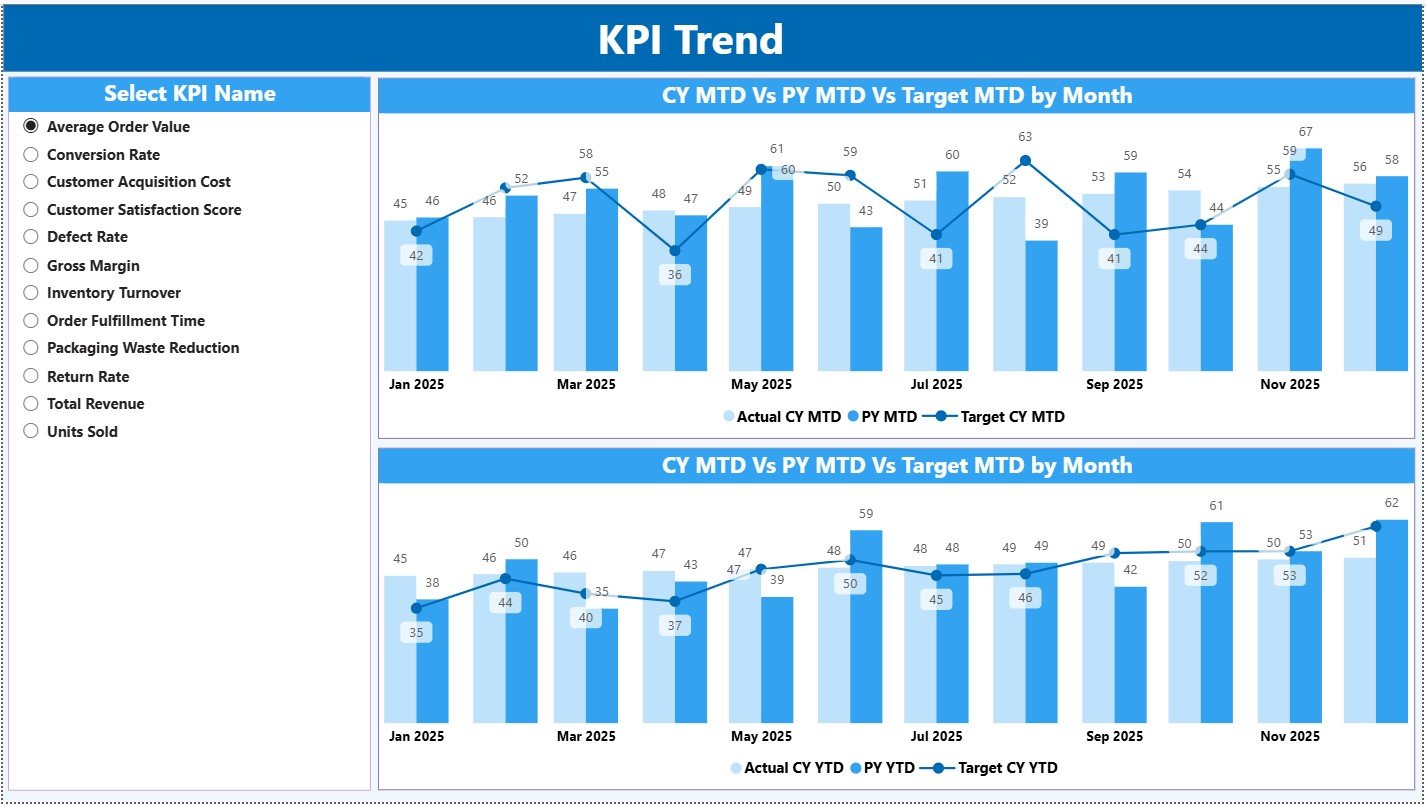
The KPI Trend Page focuses on performance trends over time.
KPI Selection Slicer
On the left side of the page, users select a KPI Name from a slicer. Once selected, the charts update automatically.
Combo Charts on the KPI Trend Page
This page includes 2 combo charts:
-
MTD Trend Chart
-
YTD Trend Chart
Each chart displays:
-
Actual values for the current year
-
Target values
-
Previous year values
Because these charts combine bars and lines, users quickly identify performance gaps and trends.
Why KPI Trends Matter
Trend analysis helps businesses:
-
Detect performance improvement or decline
-
Understand seasonality
-
Identify recurring issues
-
Improve forecasting accuracy
As a result, the KPI Trend Page supports proactive decision-making.
Click to Purchases Cosmetics and Skincare KPI Dashboard in Power BI
3) What Is the Purpose of the KPI Definition Page?
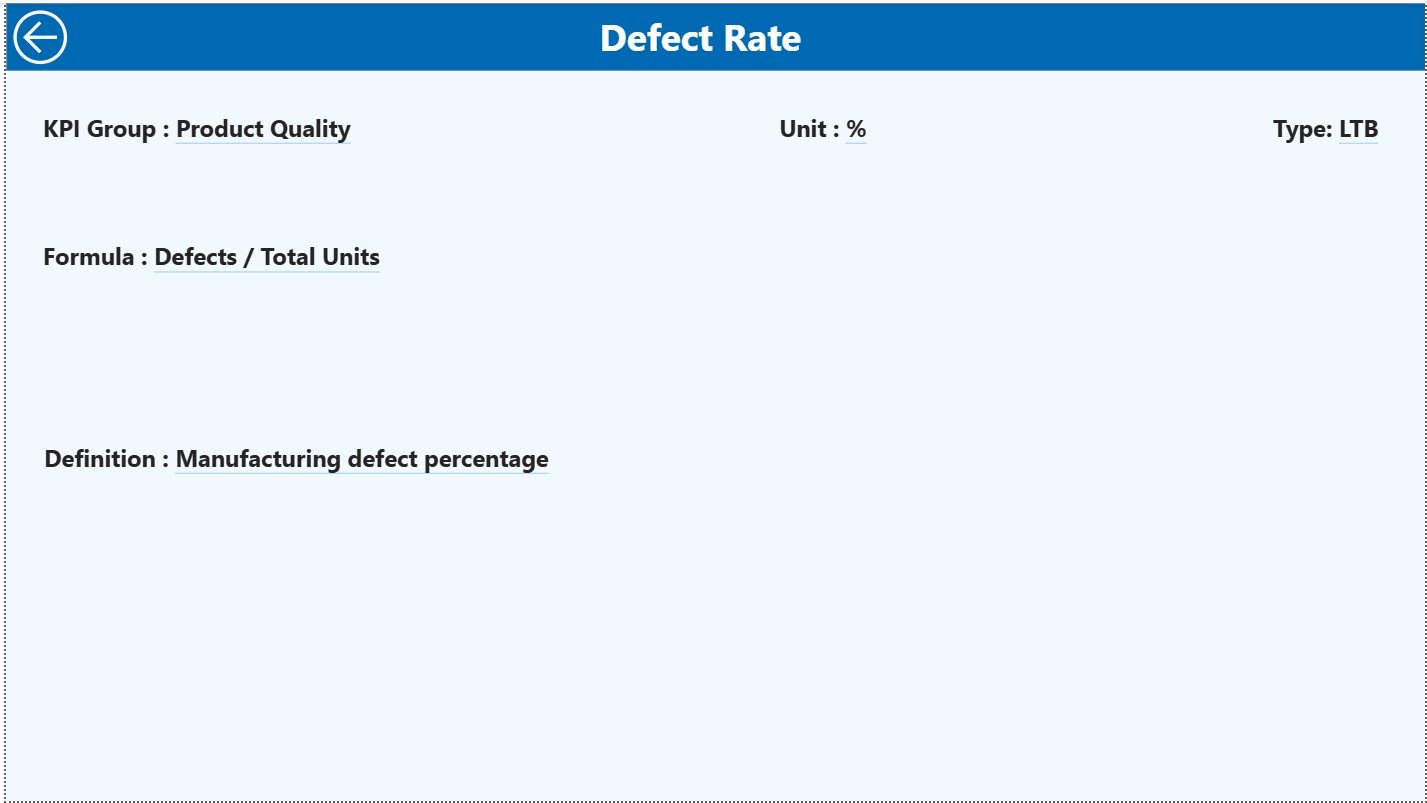
The KPI Definition Page is a drill-through page. It remains hidden from the main navigation.
How Drill-Through Works
From the Summary Page, users can drill through to the KPI Definition Page by selecting a KPI. This action opens detailed KPI information.
Information Shown on the KPI Definition Page
This page displays:
-
KPI Formula
-
KPI Definition
-
KPI context and explanation
Because of this feature, users understand what each KPI means and how it is calculated.
Navigation Back to Summary Page
A Back button is available at the top left corner. Users click it to return to the Summary Page instantly.
Click to Purchases Cosmetics and Skincare KPI Dashboard in Power BI
What Excel Data Structure Supports This Power BI Dashboard?
This dashboard uses an Excel file as the data source. The Excel file includes 3 structured worksheets.
1) Input_Actual Sheet
This sheet stores actual performance data.
Users enter:
-
KPI Name
-
Month (use the first date of the month)
-
MTD Actual value
-
YTD Actual value
This sheet drives all actual performance calculations.
2) Input_Target Sheet
This sheet stores target values.
Users enter:
-
KPI Name
-
Month (use the first date of the month)
-
MTD Target value
-
YTD Target value
Power BI uses this data to calculate Target vs Actual metrics.
3) KPI Definition Sheet
This sheet acts as a master reference.
Users enter:
-
KPI Number
-
KPI Group
-
KPI Name
-
Unit
-
Formula
-
Definition
-
Type (LTB or UTB)
This structure ensures clarity, accuracy, and consistency.
What KPIs Can Be Tracked in a Cosmetics and Skincare Dashboard?
Typical KPIs include:
-
Sales Revenue
-
Gross Margin %
-
Marketing ROI
-
Inventory Turnover
-
Order Fulfillment Rate
-
Customer Return Rate
-
Product Defect Rate
-
On-Time Delivery %
-
Customer Satisfaction Score
These KPIs help beauty brands align sales, operations, and quality.
Advantages of Cosmetics and Skincare KPI Dashboard in Power BI
A Power BI KPI Dashboard offers several advantages.
Key Advantages
-
📊 Centralized KPI Monitoring
Track all KPIs in one dashboard -
⚡ Real-Time Insights
Refresh data instantly from Excel -
🎯 Target Tracking
Identify target achievements and gaps -
📈 Trend Visibility
Analyze MTD and YTD trends easily -
🔍 Deep Analysis
Drill through KPI definitions -
🚀 Scalable Solution
Add new KPIs without redesign
Because of these benefits, Power BI becomes a strategic tool for beauty businesses.
Click to Purchases Cosmetics and Skincare KPI Dashboard in Power BI
How Does This Dashboard Support Business Growth?
This dashboard supports growth by:
-
Improving performance visibility
-
Highlighting underperforming KPIs early
-
Supporting data-driven reviews
-
Enhancing accountability across teams
-
Reducing reporting time
As a result, leaders focus on strategy instead of spreadsheets.
Best Practices for the Cosmetics and Skincare KPI Dashboard in Power BI
To maximize dashboard value, follow these best practices.
Best Practices You Should Follow
-
✔️ Define clear KPIs aligned with business goals
-
✔️ Maintain consistent KPI definitions
-
✔️ Update Excel data regularly
-
✔️ Use slicers for focused analysis
-
✔️ Validate data before refresh
-
✔️ Limit visuals to avoid clutter
-
✔️ Train users on interpretation
By following these practices, your dashboard remains accurate, fast, and user-friendly.
Who Can Use a Cosmetics and Skincare KPI Dashboard in Power BI?
This dashboard benefits:
-
Cosmetics brand owners
-
Skincare product managers
-
Sales and marketing teams
-
Operations managers
-
Finance and planning teams
Each role gains actionable insights without technical complexity.
What Makes This 3-Page Power BI Dashboard Effective?
This dashboard works effectively because it:
-
Separates summary, trends, and definitions
-
Combines financial and operational KPIs
-
Uses interactive slicers and drill-through
-
Connects easily with Excel data
Each page answers a specific business question, which improves clarity.
Conclusion: Why Should You Use a Cosmetics and Skincare KPI Dashboard in Power BI?
A Cosmetics and Skincare KPI Dashboard in Power BI helps beauty businesses track performance, monitor targets, and analyze trends in a structured and visual way. It replaces manual reports with interactive analytics and supports faster decision-making.
Moreover, its 3-page design ensures simplicity, flexibility, and scalability. Whether you manage a small skincare brand or a growing cosmetics company, this dashboard becomes an essential performance management tool.
Click to Purchases Cosmetics and Skincare KPI Dashboard in Power BI
Frequently Asked Questions (FAQs)
What is a Cosmetics and Skincare KPI Dashboard in Power BI?
It is an interactive Power BI report that tracks beauty industry KPIs using Excel as a data source.
How many pages does this dashboard include?
This dashboard includes 3 pages: Summary, KPI Trend, and KPI Definition.
Does the dashboard support MTD and YTD analysis?
Yes, it supports both MTD and YTD performance tracking.
Can I customize KPIs in this dashboard?
Yes, you can easily modify or add KPIs using the Excel KPI Definition sheet.
Is this dashboard suitable for small beauty brands?
Yes, Power BI and Excel make it scalable and cost-effective.
Do I need advanced Power BI skills to use this dashboard?
No, basic Power BI knowledge is enough to use and maintain this dashboard.
Click to Purchases Cosmetics and Skincare KPI Dashboard in Power BI
Visit our YouTube channel to learn step-by-step video tutorials