Managing credit risk has become more complex than ever. Financial institutions, lenders, investors, and risk teams must continuously monitor ratings, exposure, probability of default, revenue, and debt across agencies, industries, countries, and time. However, when teams rely on static reports or scattered spreadsheets, they lose clarity and speed.
That is exactly where a Credit Rating Agencies Dashboard in Power BI delivers real value.
This article explains everything you need to know about a Credit Rating Agencies Dashboard in Power BI, including what it is, why it matters, how it works, its page-wise structure, advantages, best practices, and common questions. By the end, you will clearly understand how this ready-to-use Power BI dashboard helps organizations track credit performance, control exposure, and make confident, data-driven decisions.
Click to Purchases Credit Rating Agencies Dashboard in Power BI
What Is a Credit Rating Agencies Dashboard in Power BI?
A Credit Rating Agencies Dashboard in Power BI is an interactive analytics solution designed to monitor and analyze credit ratings data across multiple dimensions.
Instead of manually reviewing agency reports or exporting data into Excel files, users can view all critical metrics on a single Power BI dashboard. As a result, teams gain faster insights and better control over credit risk.
This dashboard typically consolidates data from credit rating agencies and internal systems to track:
-
Active rating performance
-
Exposure amount by rating changes
-
Probability of default trends
-
Revenue and debt distribution
-
Agency-wise, industry-wise, country-wise, and month-wise performance
Because Power BI powers this dashboard, users can apply slicers, drill down into details, and instantly update insights.
Why Do Organizations Need a Credit Rating Agencies Dashboard in Power BI?
Credit risk directly impacts profitability, compliance, and long-term stability. Therefore, organizations need a structured and visual way to monitor rating movements and exposure.
A Credit Rating Agencies Dashboard in Power BI helps because:
-
Credit data often comes from multiple agencies
-
Manual analysis increases the risk of errors
-
Static reports delay decision-making
-
Risk teams need real-time visibility
-
Management expects quick, visual insights
With Power BI, teams can centralize all rating data and analyze it from multiple angles without technical complexity.
How Does a Credit Rating Agencies Dashboard in Power BI Work?
The dashboard works by connecting rating data from structured sources such as Excel files, databases, or data warehouses.
Here is how the process flows:
-
Data Collection
Credit rating data, exposure amounts, revenue, debt, and probability of default values get stored in a structured format. -
Data Modeling
Power BI models the data to link agencies, industries, countries, and time periods. -
Visual Design
Interactive charts, cards, and slicers present insights in a clear format. -
User Interaction
Users apply slicers to filter by agency, industry, country, or month. -
Decision Support
Management uses the insights to manage risk, adjust exposure, and plan strategy.
Because of this flow, the dashboard stays dynamic and easy to maintain.
What Are the Key Pages in the Credit Rating Agencies Dashboard in Power BI?
This ready-to-use Credit Rating Agencies Dashboard in Power BI includes five structured pages, each designed for a specific type of analysis.
What Does the Overview Page Show?
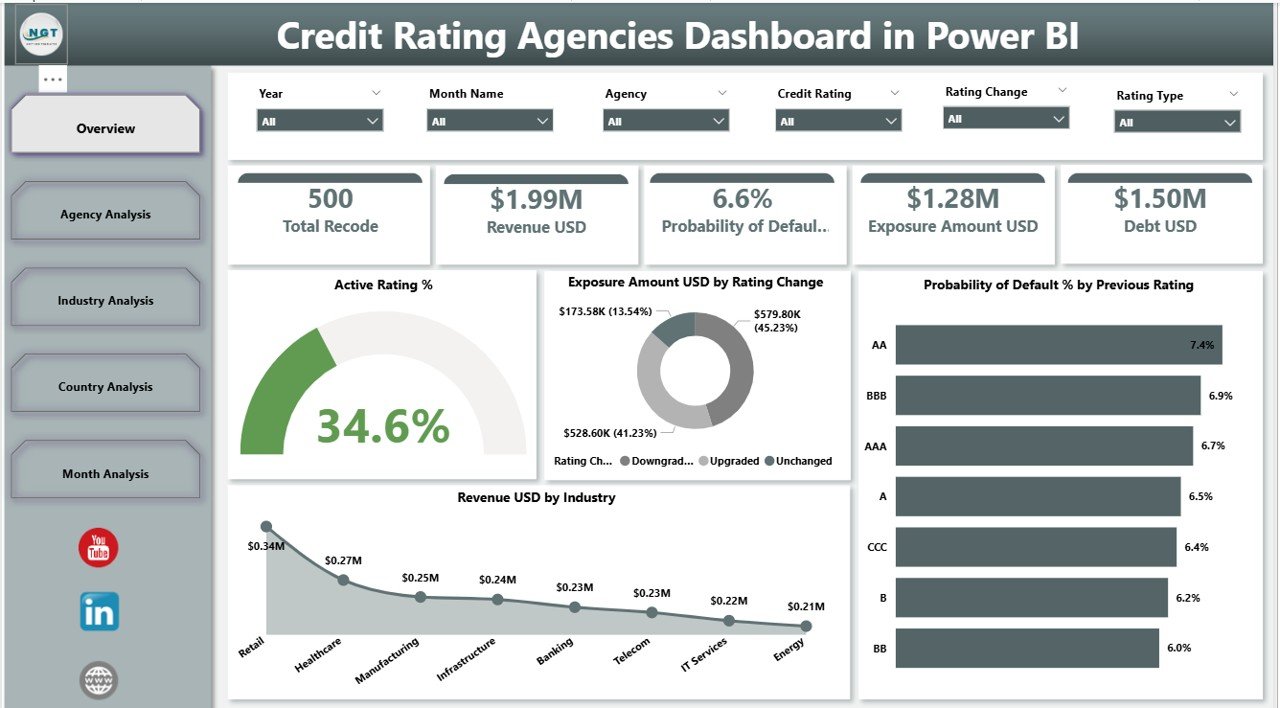
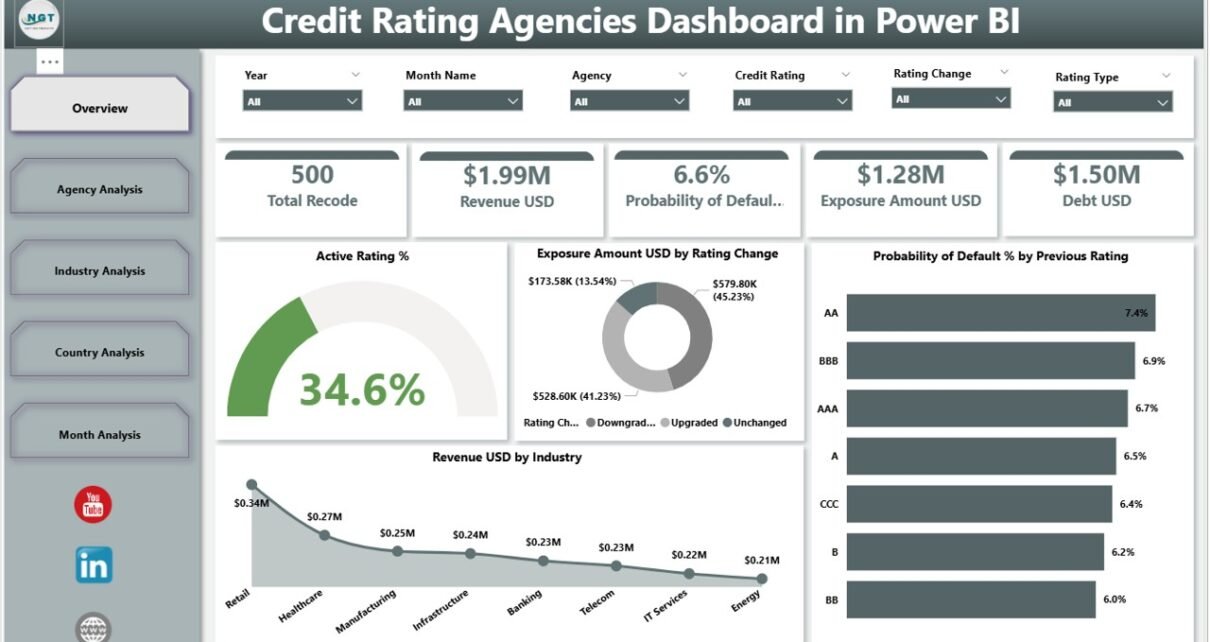
The Overview Page acts as the main entry point of the dashboard. It gives a high-level summary of overall credit performance.
Key Features of the Overview Page
On this page, users can apply slicers to filter the data. As a result, all visuals update instantly.
The page includes five KPI cards, such as:
-
Active Rating %
Shows the percentage of active credit ratings. -
Exposure Amount USD by Rating Change
Highlights exposure based on rating upgrades or downgrades. -
Probability of Default % by Previous Rating
Displays default risk based on earlier ratings. -
Revenue USD by Industry
Shows revenue distribution across industries.
These cards help decision-makers quickly understand the current credit risk position.
Click to Purchases Credit Rating Agencies Dashboard in Power BI
How Does the Agency Analysis Page Help?
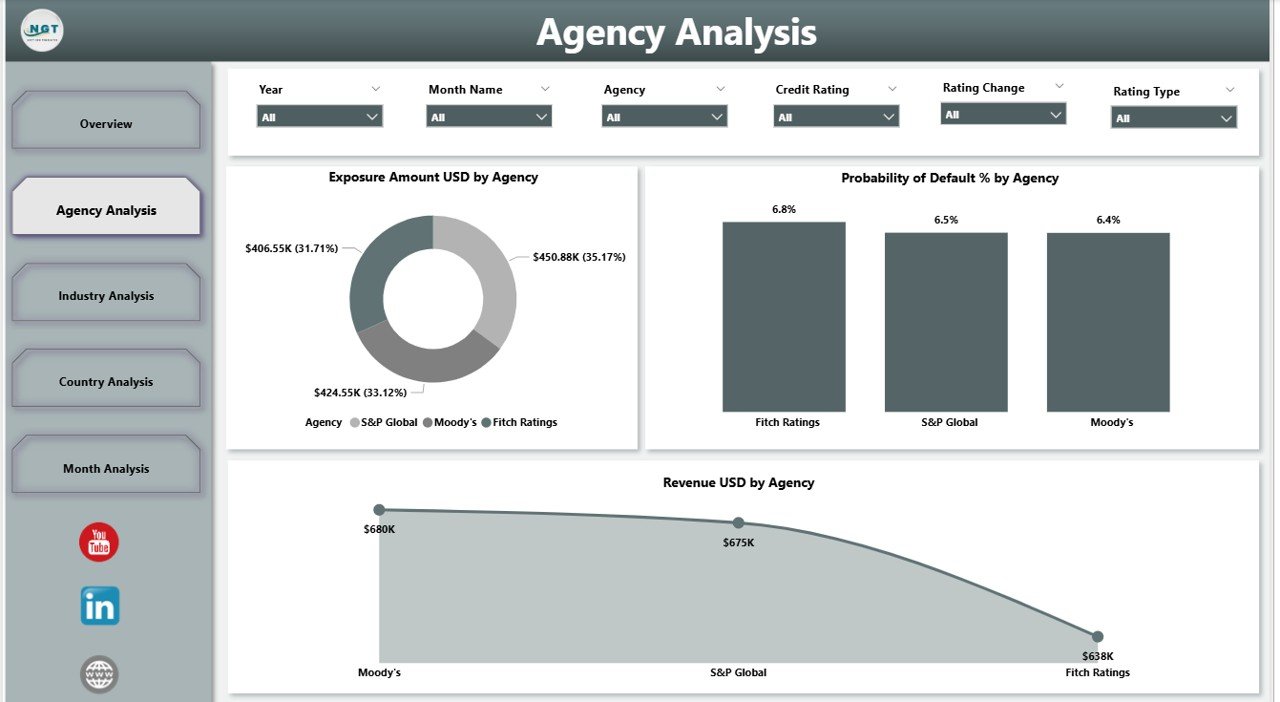
The Agency Analysis Page focuses on comparing performance across different credit rating agencies.
Why Agency-Level Analysis Matters
Different agencies often assign different ratings. Therefore, organizations must track exposure and risk by agency.
Key Charts on the Agency Analysis Page
This page includes slicers and three powerful charts:
-
Exposure Amount USD by Agency
Shows how exposure distributes across rating agencies. -
Probability of Default % by Agency
Highlights risk levels associated with each agency. -
Revenue USD by Agency
Displays revenue linked to ratings from each agency.
Because of this layout, users can quickly identify agency-specific risks.
What Insights Does the Industry Analysis Page Provide?
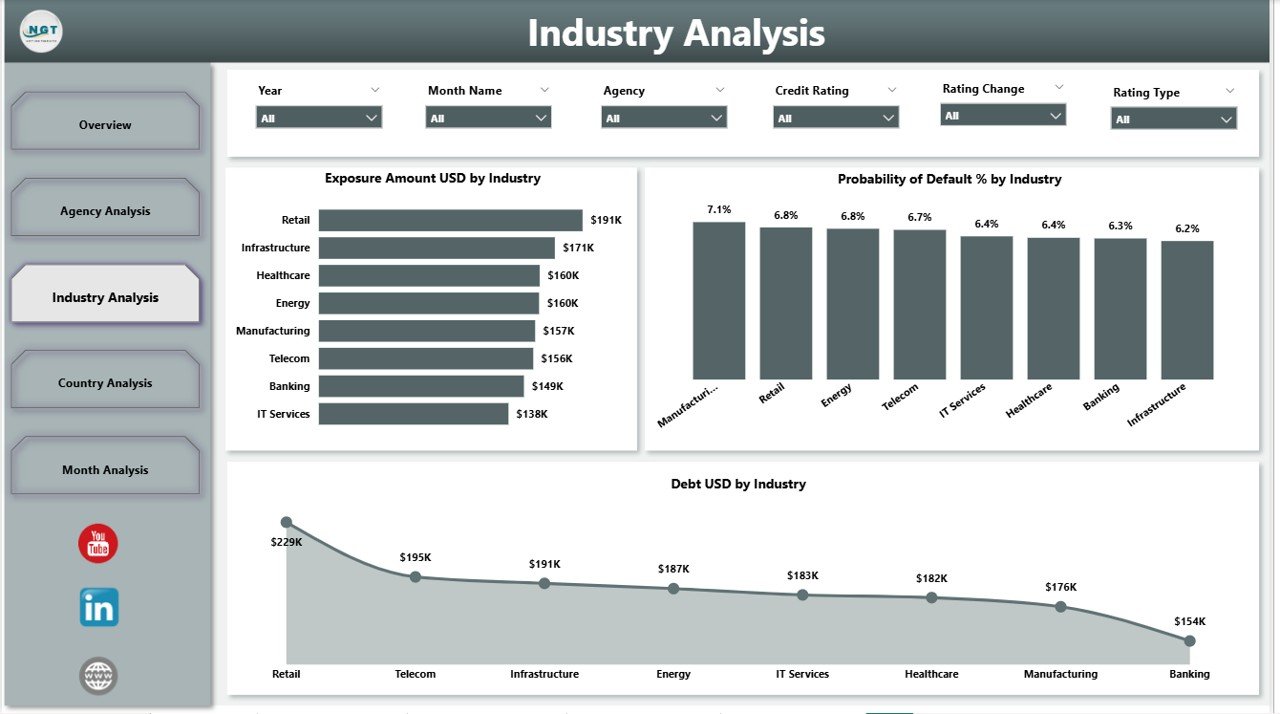
The Industry Analysis Page helps users understand how credit exposure and risk vary across industries.
Why Industry Analysis Is Critical
Some industries carry higher risk due to market cycles, regulations, or economic pressure. Therefore, tracking ratings by industry improves risk control.
Key Charts on the Industry Analysis Page
This page includes slicers and three charts:
-
Exposure Amount USD by Industry
Shows exposure concentration across sectors. -
Probability of Default % by Industry
Highlights industry-level default risk. -
Debt USD by Industry
Displays debt distribution by sector.
As a result, risk teams can quickly identify high-risk industries.
Click to Purchases Credit Rating Agencies Dashboard in Power BI
What Does the Country Analysis Page Cover?
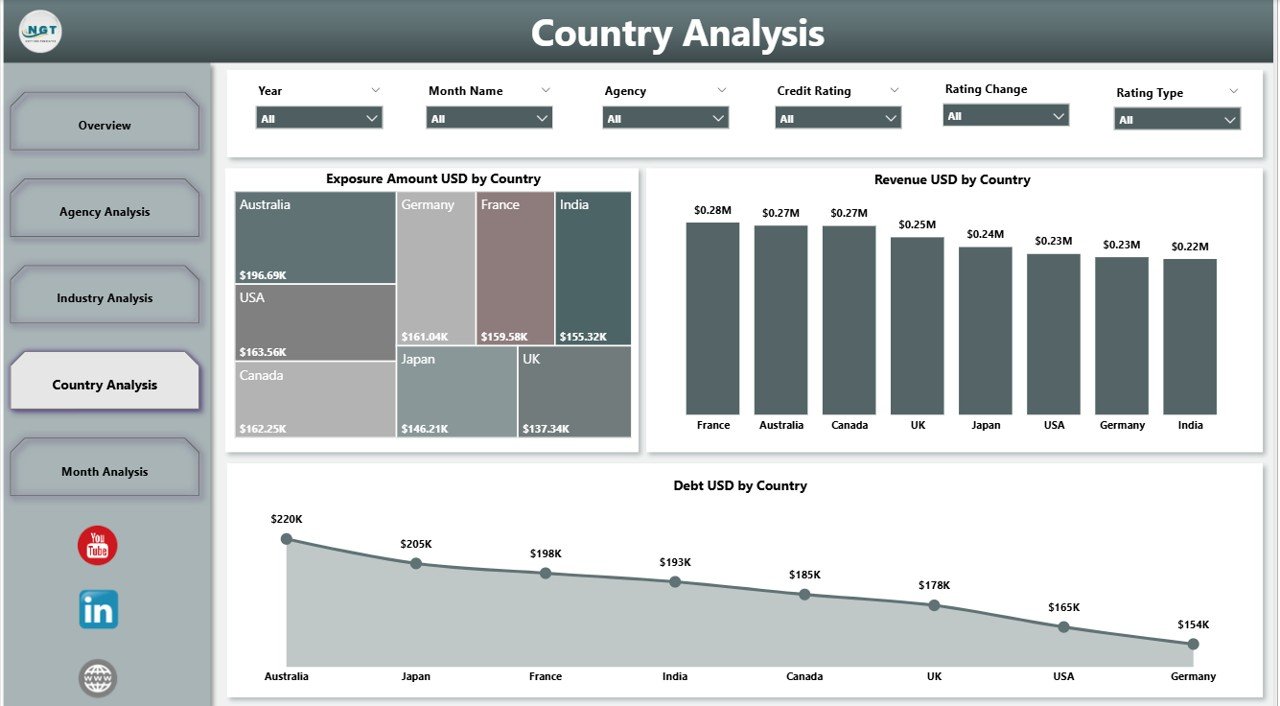
The Country Analysis Page focuses on geographic exposure and performance.
Why Country-Level Analysis Matters
Economic conditions, political stability, and regulations differ by country. Therefore, geographic insights play a vital role in credit decisions.
Key Charts on the Country Analysis Page
This page includes slicers and three charts:
-
Exposure Amount USD by Country
Shows exposure distribution across countries. -
Revenue USD by Country
Highlights revenue by geography. -
Debt USD by Country
Displays country-wise debt levels.
With these visuals, organizations can manage regional risk more effectively.
How Does the Month Analysis Page Support Trend Tracking?
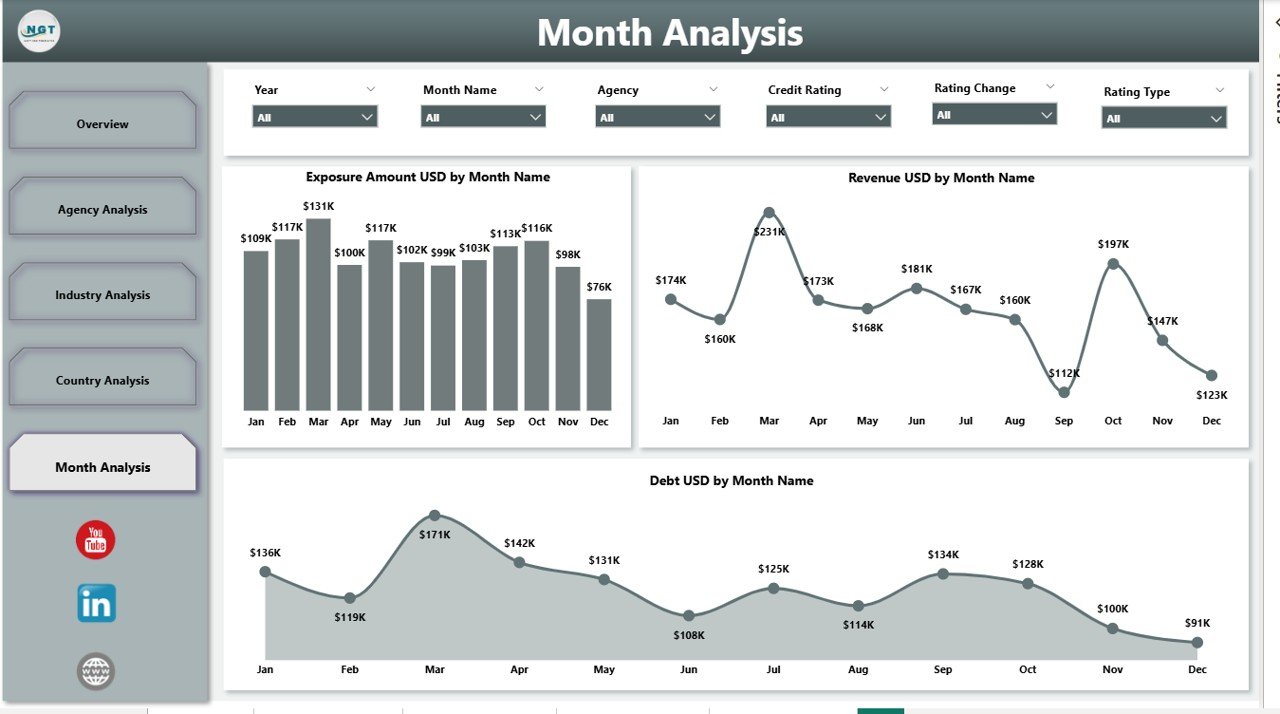
The Month Analysis Page helps users analyze trends over time.
Why Time-Based Analysis Is Important
Credit risk changes over time due to economic shifts and market behavior. Therefore, trend analysis supports proactive risk management.
Key Charts on the Month Analysis Page
This final page includes:
-
Exposure Amount USD by Month
-
Revenue USD by Month
-
Debt USD by Month
These charts help users track growth, risk buildup, and performance patterns over time.
Advantages of Credit Rating Agencies Dashboard in Power BI
Using a Credit Rating Agencies Dashboard in Power BI offers several clear advantages.
1. Centralized Credit Risk Visibility
Instead of managing multiple reports, users see all rating data in one dashboard. As a result, teams save time and reduce confusion.
2. Faster Decision-Making
Interactive visuals and slicers allow instant analysis. Therefore, management can respond quickly to rating changes.
3. Improved Risk Management
By tracking probability of default and exposure, organizations can control risk more effectively.
4. Better Agency Comparison
Click to Purchases Credit Rating Agencies Dashboard in Power BI
The dashboard allows easy comparison across agencies. As a result, users understand differences in ratings and impact.
5. Industry and Country Insights
Industry and country pages highlight concentration risk. Therefore, teams can rebalance portfolios proactively.
6. Time Trend Analysis
Month-wise analysis helps identify early warning signs. Consequently, organizations can take preventive action.
7. Professional and Scalable Design
Power BI ensures a clean, professional layout that scales as data grows.
Who Should Use a Credit Rating Agencies Dashboard in Power BI?
This dashboard fits many roles and industries, including:
-
Banks and financial institutions
-
Credit risk managers
-
Investment firms
-
Corporate finance teams
-
Risk and compliance teams
-
CFOs and senior management
Anyone responsible for monitoring credit exposure can benefit from this solution.
Best Practices for the Credit Rating Agencies Dashboard in Power BI
To get the maximum value, follow these best practices.
1. Maintain Clean and Consistent Data
Ensure rating names, agencies, industries, and countries follow consistent formats. Clean data improves accuracy.
2. Update Data Regularly
Schedule regular data refreshes. As a result, users always see the latest insights.
3. Use Clear Slicer Labels
Label slicers clearly so users understand how to filter data.
4. Limit Overcrowding
Avoid placing too many visuals on one page. Clean layouts improve readability.
5. Focus on Key KPIs
Highlight metrics that directly support decision-making, such as exposure and probability of default.
6. Validate Calculations
Regularly validate exposure, revenue, and debt calculations to avoid misleading insights.
7. Train End Users
Provide basic training so users understand how to interact with the dashboard effectively.
How Does This Dashboard Improve Business Decisions?
A Credit Rating Agencies Dashboard in Power BI improves decisions by turning raw data into actionable insights.
Because users can analyze exposure by agency, industry, country, and month, they can:
-
Reduce high-risk exposure
-
Adjust lending strategies
-
Improve portfolio balance
-
Support compliance reporting
-
Strengthen financial planning
As a result, organizations gain both control and confidence.
Conclusion: Why Credit Rating Agencies Dashboard in Power BI Is a Smart Investment
A Credit Rating Agencies Dashboard in Power BI transforms complex credit data into clear, actionable insights. Instead of struggling with manual reports, teams gain a dynamic and interactive view of ratings, exposure, risk, and performance.
With structured pages like Overview, Agency Analysis, Industry Analysis, Country Analysis, and Month Analysis, this dashboard supports smarter and faster decisions. Moreover, its professional design and scalability make it suitable for both operational teams and senior leadership.
In today’s risk-driven financial environment, investing in a Power BI credit rating dashboard is not just useful—it is essential.
Frequently Asked Questions About Credit Rating Agencies Dashboard in Power BI
What is the main purpose of a Credit Rating Agencies Dashboard in Power BI?
The main purpose is to monitor credit ratings, exposure, probability of default, revenue, and debt in one interactive platform.
Can this dashboard handle data from multiple rating agencies?
Yes, the dashboard supports analysis across multiple credit rating agencies with easy comparison.
Does the dashboard support industry and country analysis?
Yes, it includes dedicated pages for industry-wise and country-wise analysis.
Can users analyze trends over time?
Yes, the Month Analysis page allows users to track exposure, revenue, and debt trends.
Is this dashboard suitable for senior management?
Absolutely. The overview page provides high-level KPIs, while detailed pages support deeper analysis.
Can the dashboard be customized?
Yes, Power BI allows full customization of visuals, KPIs, and layouts based on business needs.
Does this dashboard reduce manual reporting effort?
Yes, it eliminates repetitive manual work by automating analysis and visualization.
Is Power BI required to use this dashboard?
Yes, users need Power BI Desktop or Power BI Service to view and interact with the dashboard.
Visit our YouTube channel to learn step-by-step video tutorials