Credit rating agencies play an important role in global financial stability. They evaluate the creditworthiness of governments, corporations, financial institutions, and investment products. Because their ratings influence investments, lending decisions, and market confidence, agencies must monitor their own performance with clear, accurate, and timely KPIs.
A Credit Rating Agencies KPI Dashboard in Power BI helps you measure operational efficiency, rating accuracy, review timelines, compliance performance, and team productivity. This all-in-one dashboard gives decision-makers a real-time view of business performance so they can take quick and informed actions.
In this article, we explore everything about this dashboard. You will learn how it works, what it includes, why it matters, and how Power BI transforms raw numbers into meaningful insights. We will also cover its advantages, best practices, and provide useful FAQs at the end.
Click to Purchases Credit Rating Agencies KPI Dashboard in Power BI
What Is a Credit Rating Agencies KPI Dashboard in Power BI?
A Credit Rating Agencies KPI Dashboard in Power BI is an interactive reporting solution designed to track, monitor, and analyze key performance indicators across rating operations. It displays rating timelines, review counts, compliance performance, accuracy trends, and year-to-date (YTD) goals in a structured and visually clear format.
Because the dashboard runs on Power BI, you can filter data, drill down to specific KPIs, compare results, and track monthly targets using dynamic visuals and slicers. It also helps rating analysts, compliance teams, and senior management evaluate performance with real-time updates from Excel-based datasets.
This dashboard becomes a powerful tool for credit rating agencies that want to improve transparency, reduce rating delays, strengthen compliance, and enhance rating quality.
Click to Purchases Credit Rating Agencies KPI Dashboard in Power BI
Why Do Credit Rating Agencies Need a KPI Dashboard?
Credit rating agencies handle large volumes of financial, operational, and compliance-related data. Without a structured dashboard:
-
Rating timelines become difficult to track
-
Review quality becomes inconsistent
-
Analyst productivity reduces
-
Compliance and audit checks become slow
-
Trend analysis becomes time-consuming
A KPI dashboard solves these problems because:
-
It centralizes all performance indicators
-
It creates a single source of truth
-
It highlights issues early
-
It improves accountability across teams
-
It enables data-driven decision-making
Therefore, the dashboard becomes essential for agencies that want efficient, accurate, and transparent operations.
Click to Purchases Credit Rating Agencies KPI Dashboard in Power BI
What Are the Key Features of the Credit Rating Agencies KPI Dashboard in Power BI?
This dashboard includes three main pages built in Power BI Desktop. Each page serves a specific purpose and gives unique insights.
Let us explore them one by one.
1. Summary Page – What Does It Show?
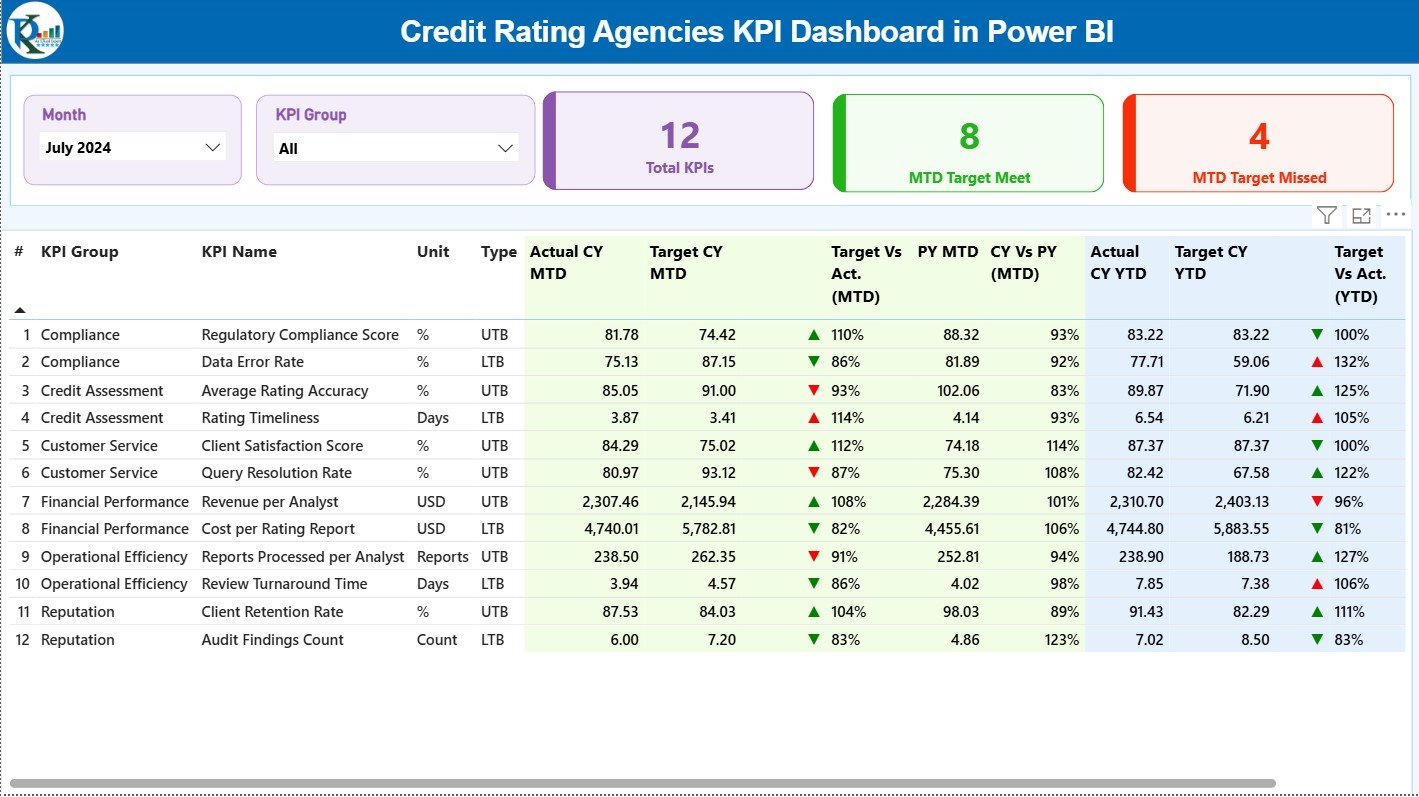
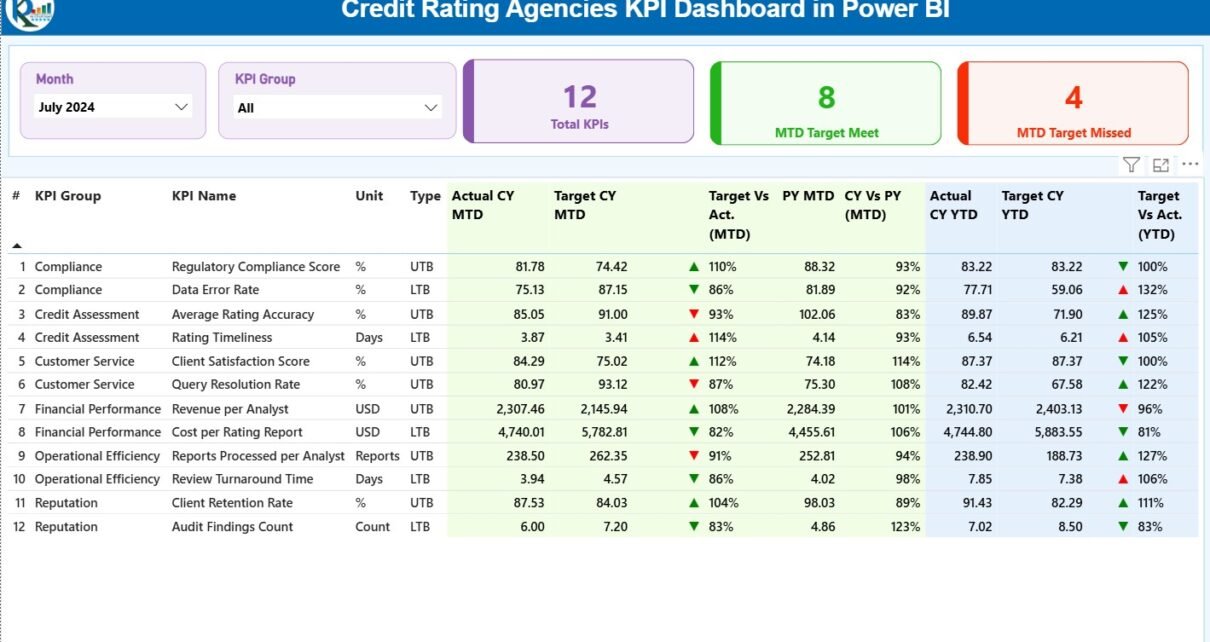
The Summary Page is the main page that gives a complete overview of all KPIs. It shows the performance of every KPI for both Month-To-Date (MTD) and Year-To-Date (YTD) numbers. The top area includes slicers so you can filter the dashboard quickly.
Top Section Highlights
-
Month Slicer – Choose any month to view MTD & YTD performance.
-
KPI Group Slicer – Filter KPIs by categories such as operations, compliance, analyst productivity, rating quality, etc.
-
Three KPI Cards
-
Total KPIs Count
-
MTD Target Met Count
-
MTD Target Missed Count
-
These cards instantly show how the agency performs for the selected month.
Detailed KPI Table
Below the cards, you see a detailed table with all KPI-related information. This includes:
-
KPI Number – The unique ID or sequence number.
-
KPI Group – The category or department of the KPI.
-
KPI Name – The title of the KPI.
-
Unit – The measurement unit (days, %, count, etc.).
-
Type (LTB/UTB) –
-
Lower The Better (LTB)
-
Upper The Better (UTB)
-
-
Actual CY MTD – Current month-to-date actual numbers.
-
Target CY MTD – Current month-to-date target numbers.
-
MTD Icon – ▲ or ▼ icons showing whether the KPI meets the target.
-
Target vs Actual (MTD %) – Performance percentage using:
Actual MTD / Target MTD -
PY MTD – Same period performance from last year.
-
CY vs PY (MTD %) – Monthly performance comparison using:
Current MTD / Previous MTD -
Actual CY YTD – Current year-to-date numbers.
-
Target CY YTD – Year-to-date targets.
-
YTD Icon – ▲ or ▼ to show performance status.
-
Target vs Actual (YTD %) – Calculation uses:
Actual YTD / Target YTD -
PY YTD – Previous year-to-date value.
-
CY vs PY (YTD %) – YTD performance comparison.
This page gives a complete KPI snapshot in one place so managers can review all performance scores quickly.
Click to Purchases Credit Rating Agencies KPI Dashboard in Power BI
2. KPI Trend Page – What Insights Does It Provide?
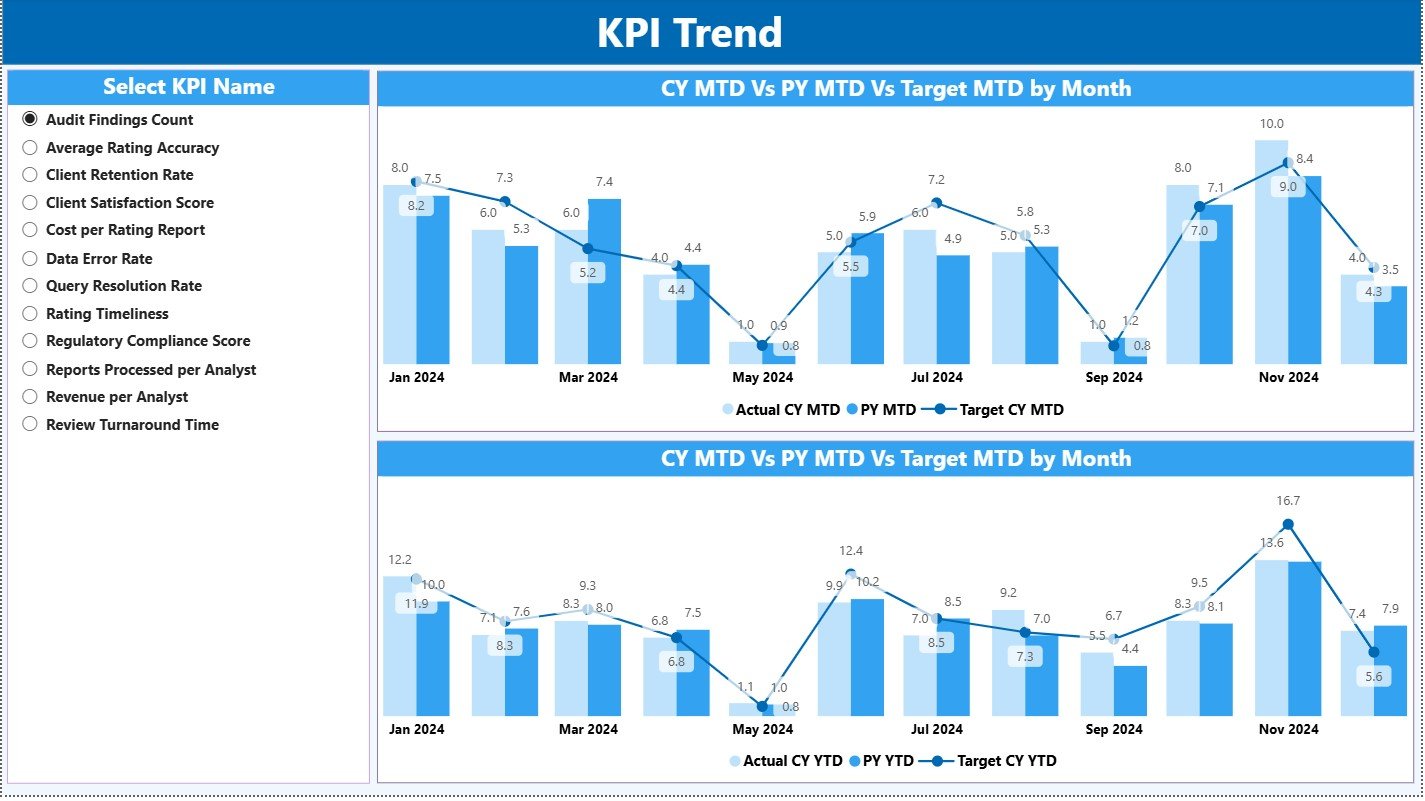
The KPI Trend page focuses on visualization. It helps you analyze patterns, spot deviations, and understand performance progress across months.
Key Elements
-
Two Combo Charts
-
One chart displays Actual CY, PY, and Target for MTD
-
The second chart displays Actual CY, PY, and Target for YTD
-
-
KPI Name Slicer
You can select any KPI to see its detailed trend over the year.
With these charts, you can compare:
-
How this year performs against last year
-
How actual numbers perform against monthly and yearly targets
-
How consistency changes each month
This page becomes very important when you present rating performance to top management, auditors, or regulatory teams.
Click to Purchases Credit Rating Agencies KPI Dashboard in Power BI
3. KPI Definition Page – What Does It Include?
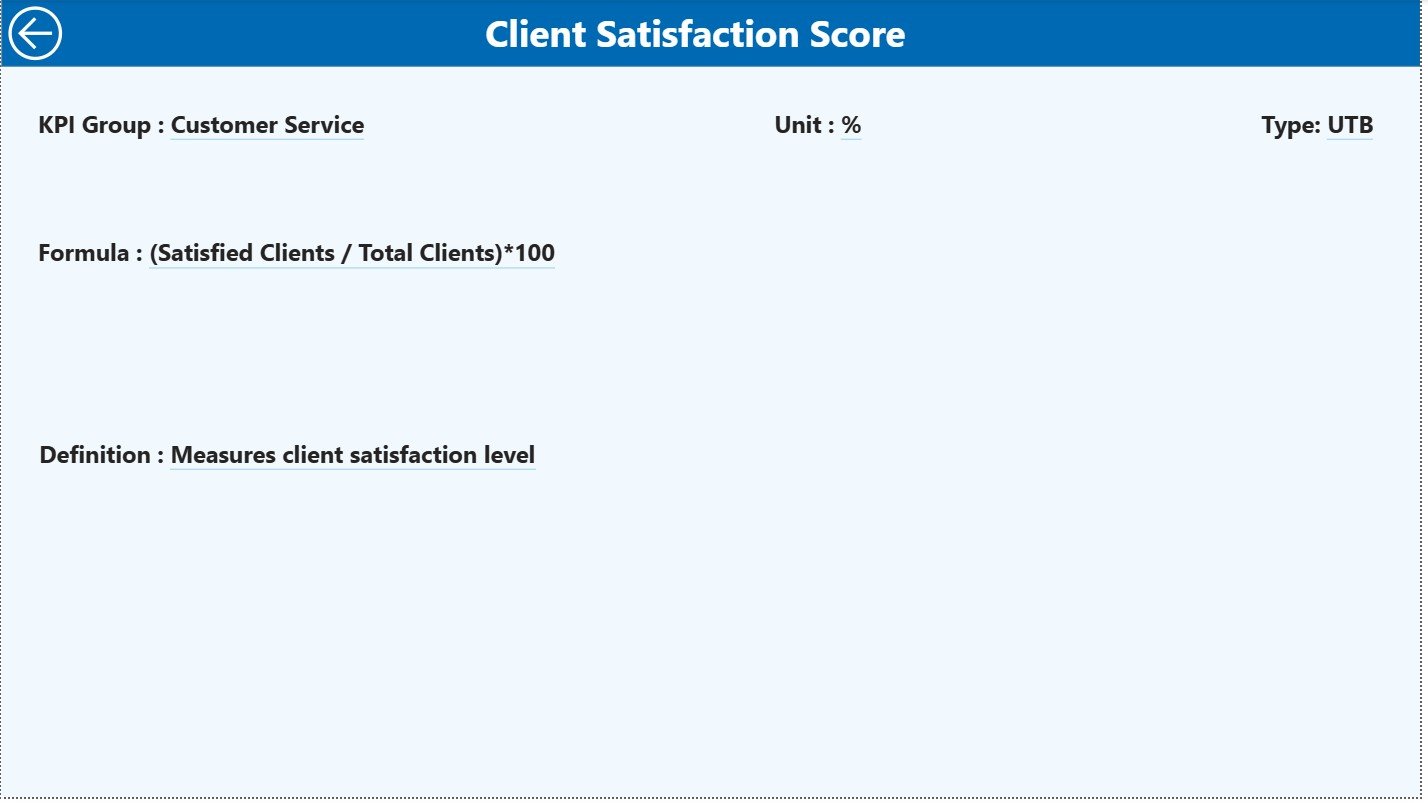
The KPI Definition Page works as a drill-through page. You do not see this page directly because it remains hidden, but you can access it through the Summary page.
When you right-click on a KPI and choose “Drill Through,” you see:
-
KPI Number
-
KPI Group
-
KPI Name
-
Unit
-
Type (LTB or UTB)
-
Formula
-
KPI Definition
This page ensures everyone understands the meaning and calculation behind each KPI.
This page also prevents confusion because each KPI uses a standard definition across analysts and departments.
How Do You Provide Data to This Dashboard?
The dashboard uses Excel as its data source. You must fill three worksheets:
1. Input_Actual Sheet Tab
Here, you enter actual performance data for each KPI.
Columns include:
-
KPI Name
-
Month (use the first day of each month)
-
MTD Actual
-
YTD Actual
2. Input_Target Sheet Tab
Here, you enter target values for each KPI.
Columns include:
-
KPI Name
-
Month
-
MTD Target
-
YTD Target
3. KPI Definition Sheet
You enter all supporting information here.
Columns include:
-
KPI Number
-
KPI Group
-
KPI Name
-
Unit
-
Formula
-
Definition
-
Type (LTB/UTB)
Once you update these sheets, Power BI refreshes the dashboard automatically.
Click to Purchases Credit Rating Agencies KPI Dashboard in Power BI
What KPIs Should Credit Rating Agencies Track?
Below are common KPI categories for rating agencies:
Operational KPIs
-
Rating completion time
-
Number of ratings completed
-
Average review cycle time
-
Backlog of pending ratings
Compliance KPIs
-
Compliance review completion rate
-
Accuracy of rating models
-
Internal audit issues resolved
-
Regulatory reporting timelines
Quality KPIs
-
Rating accuracy %
-
Review quality score
-
Error rate in rating reports
Analyst Productivity KPIs
-
Ratings completed per analyst
-
Review completion rate
-
Turnaround time per rating
Client Relationship KPIs
-
Client satisfaction score
-
Number of complaints
-
Response time to client queries
When these KPIs stay updated in the dashboard, decision-making becomes faster and more reliable.
Click to Purchases Credit Rating Agencies KPI Dashboard in Power BI
Advantages of a Credit Rating Agencies KPI Dashboard in Power BI
The dashboard offers many advantages that help agencies work with clarity and efficiency.
1. Real-Time Insights for Faster Decisions
Managers can view MTD and YTD scores within seconds. Therefore, they take better decisions without waiting for reports.
2. Complete Visibility Across the Organization
Because the dashboard combines data from multiple sources, everyone sees:
-
Which KPIs meet targets
-
Which KPIs require improvement
-
How departments perform month after month
3. Improved Accuracy in Reporting
Power BI formulas and visuals help avoid manual calculation errors. This increases accuracy in both internal and regulatory reporting.
4. Better Team Accountability
Teams understand where they stand every month. Therefore, analysts and managers maintain better discipline and responsibility.
5. Stronger Compliance and Quality Standards
Rating accuracy, validation reviews, and audit checkpoints become easy to track. As a result, agencies maintain better compliance.
6. Simplified Monthly and Yearly Comparisons
The dashboard compares:
-
CY MTD vs PY MTD
-
CY YTD vs PY YTD
-
Target vs Actual
These comparisons highlight growth, gaps, and opportunities.
7. Easy Data Entry Using Excel
You do not need complex systems. Simply update three Excel sheets, and the dashboard displays everything automatically.
Best Practices for Using the Credit Rating Agencies KPI Dashboard
To get maximum value from this dashboard, follow these best practices:
1. Update Data Monthly and Keep It Accurate
Ensure you enter data before the first reporting cycle. Clean and accurate data creates meaningful insights.
2. Use KPI Groups Wisely
Group KPIs under:
-
Operations
-
Compliance
-
Quality
-
Productivity
-
Customer Service
This improves filtering and analysis.
3. Review MTD and YTD Icons Regularly
The ▲ (green) and ▼ (red) icons help you identify issues early. Act immediately when you see a downward trend.
4. Compare With Previous Year Trends
Always check CY vs PY ratios to understand real growth. A positive trend shows better performance.
5. Drill Through for KPI Definitions
Use the KPI Definition page to understand the logic behind each KPI. This ensures everyone interprets KPIs the same way.
6. Use the Trend Page for Goal Planning
Trend charts help you set realistic future targets. Analyze patterns before deciding next year’s goals.
7. Automate the Refresh Schedule
If possible, use automatic refresh so the dashboard stays updated every day or every week.
Conclusion
A Credit Rating Agencies KPI Dashboard in Power BI gives a clear, accurate, and powerful view of rating performance, compliance, and operational efficiency. It helps agencies track monthly and yearly targets, compare with previous-year results, and improve decision-making. Because the dashboard is dynamic, interactive, and easy to use, every credit rating agency can use it to improve accuracy, transparency, and productivity.
By following the best practices in this article, you can build a strong KPI monitoring system that supports smarter decisions and better financial governance.
Click to Purchases Credit Rating Agencies KPI Dashboard in Power BI
Frequently Asked Questions (FAQs)
1. What data do I need for the Credit Rating KPI Dashboard?
You need three types of data: actual values, target values, and KPI definitions. These go into three Excel sheets.
2. Can I customize the KPIs in this dashboard?
Yes. You can edit KPI names, formulas, groups, and definitions in the Excel sheets.
3. Can this dashboard track both MTD and YTD performance?
Yes. The dashboard fully supports MTD and YTD metrics along with previous-year comparisons.
4. Do I need advanced Power BI skills to use this dashboard?
No. Basic Power BI knowledge is enough because the dashboard works with simple refresh and slicer options.
5. Can I add more KPIs later?
Yes. You can add more KPIs to the Excel sheets, and Power BI will update the dashboard after refresh.
Click to Purchases Credit Rating Agencies KPI Dashboard in Power BI
Visit our YouTube channel to learn step-by-step video tutorials