In today’s data-driven financial environment, credit unions must monitor their performance efficiently to stay competitive and deliver better member experiences. Managing multiple KPIs (Key Performance Indicators) across loan portfolios, deposits, member growth, and operational efficiency can be overwhelming without a structured system.
The Credit Unions KPI Dashboard in Excel provides a simple, dynamic, and effective way to track, analyze, and visualize all essential KPIs in one place. Built entirely in Microsoft Excel, this dashboard empowers financial managers and teams to make data-backed decisions, compare results month over month, and identify areas of improvement quickly.
Click to Purchases Credit Unions KPI Dashboard in Excel
📊 What Is a Credit Unions KPI Dashboard in Excel?
A Credit Unions KPI Dashboard is a pre-built Excel tool designed to consolidate data and display real-time performance insights using interactive visuals, trends, and charts. It transforms raw financial data into meaningful insights—allowing credit unions to measure growth, profitability, and service quality efficiently.
Instead of manually analyzing multiple spreadsheets, this dashboard provides a centralized control system where all performance metrics are updated automatically once data is entered.
It’s perfect for credit union managers, CFOs, analysts, and teams who want an easy-to-use, yet comprehensive Excel solution to measure success across various departments.
Click to Purchases Credit Unions KPI Dashboard in Excel
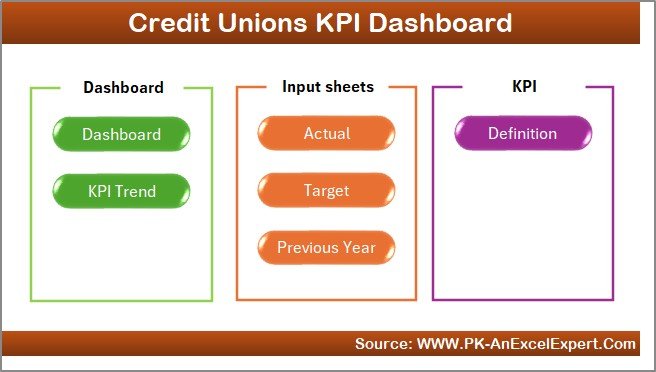
🧩 Structure of the Credit Unions KPI Dashboard
The Credit Unions KPI Dashboard in Excel comes with 7 organized worksheets, each with a specific purpose. Let’s explore them in detail:
1️⃣ Home Sheet
The Home sheet acts as the central index or navigation panel.
It contains six interactive buttons that allow users to jump directly to the desired sheet—making navigation quick and intuitive.
Whether you want to view the main dashboard, update targets, or review definitions, this sheet ensures a smooth workflow.
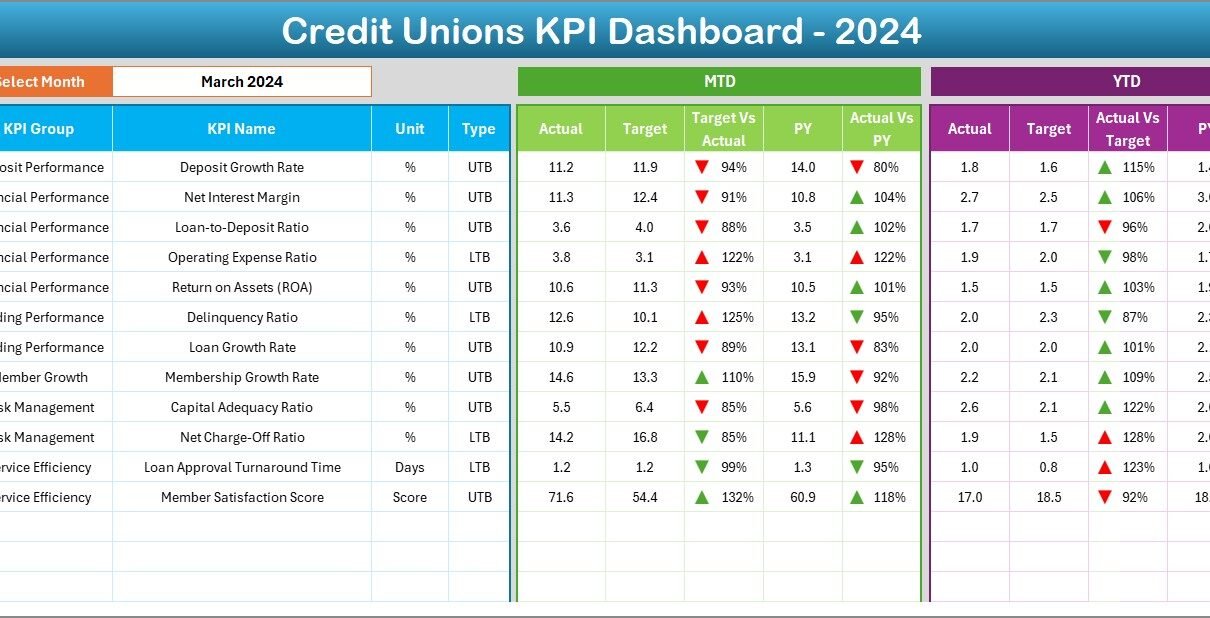
2️⃣ Dashboard Sheet Tab
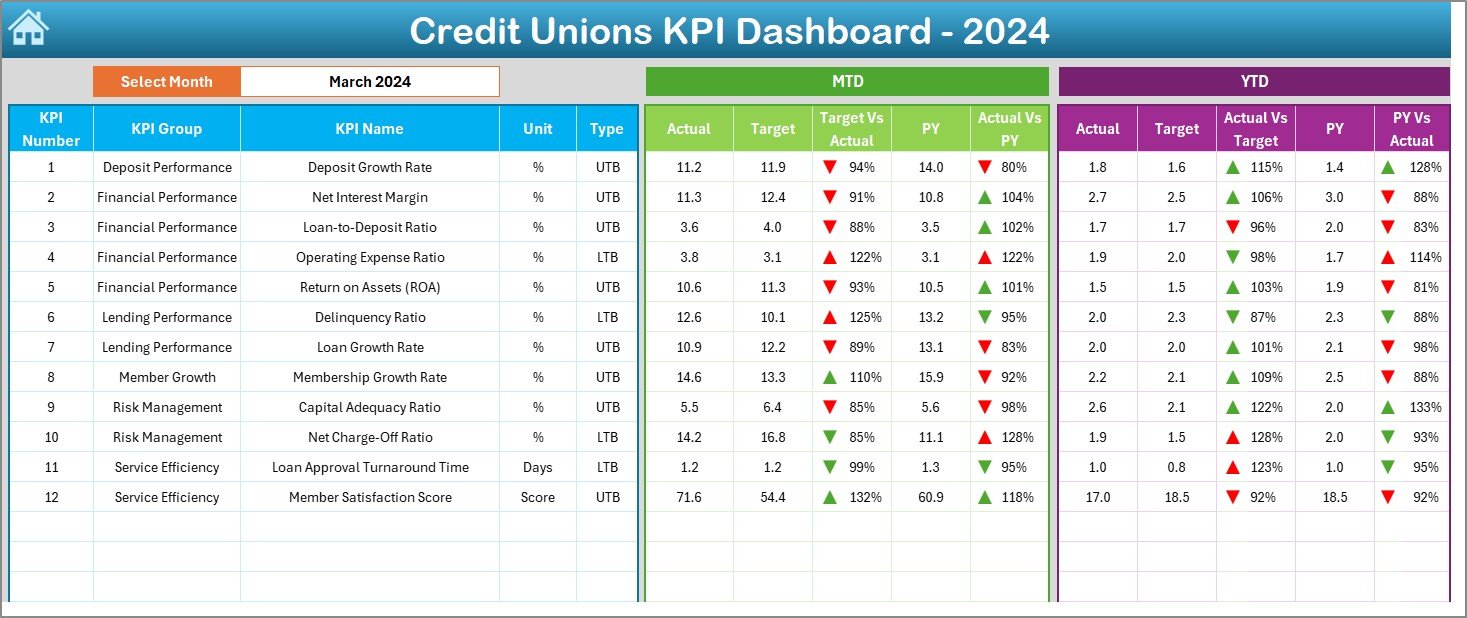
This is the core of the entire dashboard—the main control and analysis area.
-
You can select any month using the dropdown at cell D3.
Once selected, the entire dashboard refreshes automatically for that month’s data. -
Displays MTD (Month-to-Date) and YTD (Year-to-Date) data for:
-
Actual performance
-
Targets
-
Previous Year values
-
-
Automatically calculates:
-
Target vs Actual variance
-
Previous Year vs Actual variance
-
-
Includes conditional formatting with up and down arrows that visually indicate improvement or decline in performance.
This layout helps users quickly interpret financial trends without manual calculations.
3️⃣ KPI Trend Sheet Tab
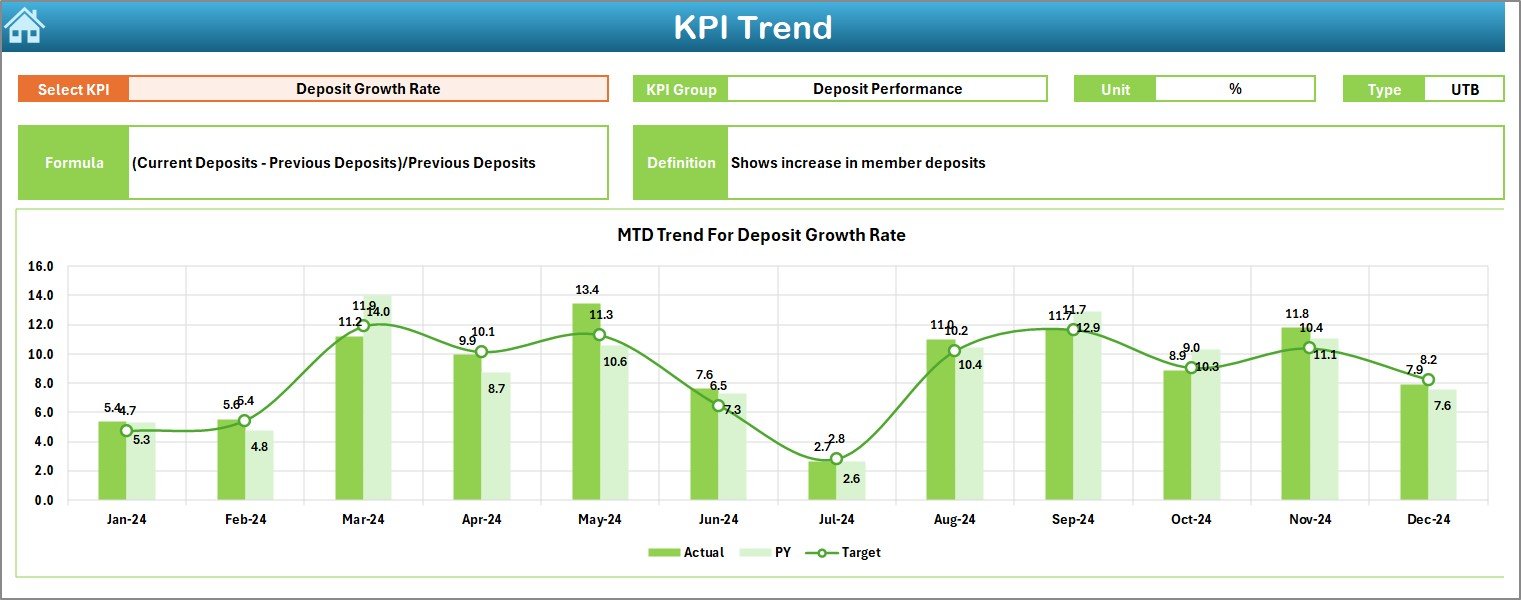
The KPI Trend sheet offers a deeper look at the historical performance of each KPI.
-
Select any KPI name from the dropdown in cell C3.
-
Displays key details:
-
KPI Group
-
Unit of measurement
-
KPI Type (Lower the Better or Upper the Better)
-
KPI Formula
-
KPI Definition
-
-
Shows both MTD and YTD trend charts comparing Actual, Target, and Previous Year values.
This feature helps visualize how a specific KPI performs over time, enabling managers to make strategic adjustments.
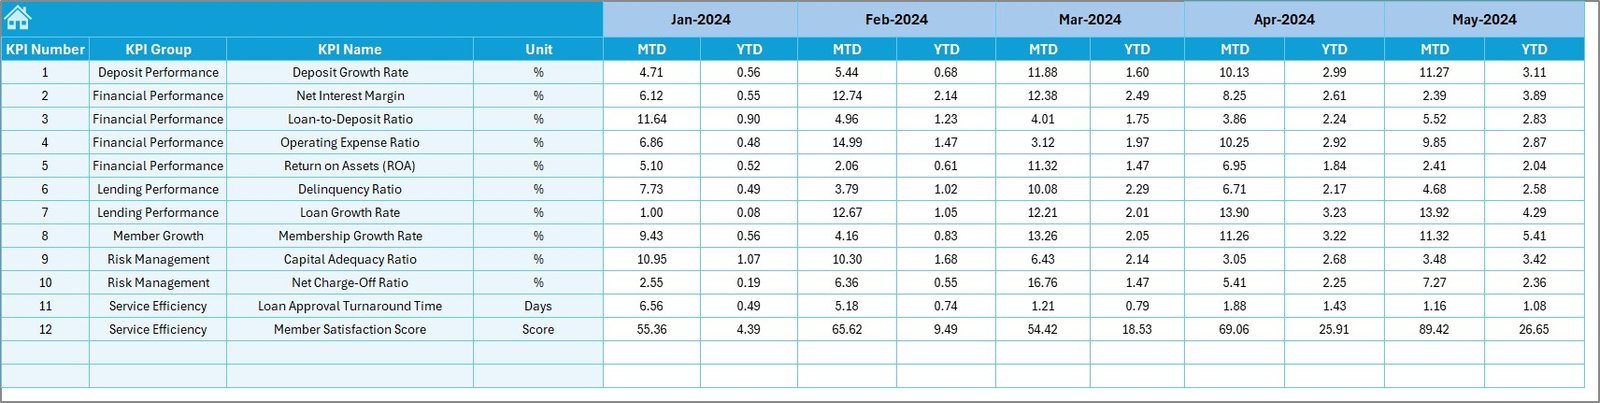
4️⃣ Actual Numbers Input Sheet
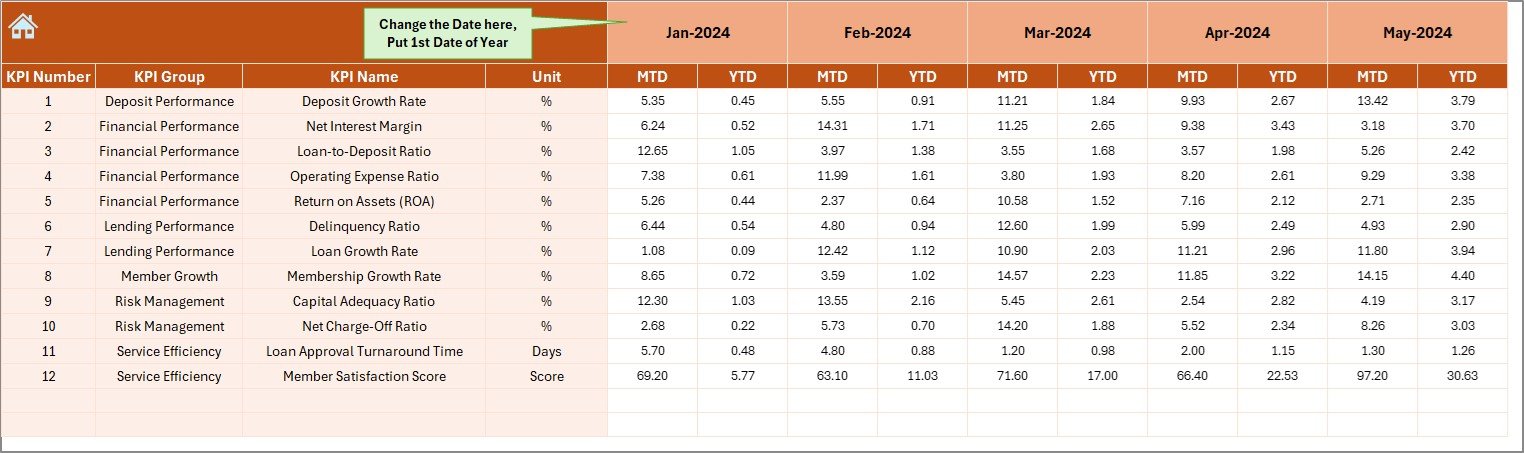
This is the data input area for real-world performance figures.
-
Enter monthly Actual numbers for MTD and YTD values.
-
The dashboard will auto-update all charts and summaries.
-
Change the starting month of the year easily from cell E1 to align with your organization’s reporting calendar.
This makes data entry straightforward and adaptable to any financial year.
5️⃣ Target Sheet Tab
The Target sheet is used to define the monthly and yearly goals for each KPI.
-
Enter Target MTD and YTD numbers for every KPI.
-
These targets automatically integrate into the dashboard visuals, allowing quick comparisons with actual performance.
This ensures all departments align with strategic goals and can measure progress clearly.
6️⃣ Previous Year Number Sheet Tab
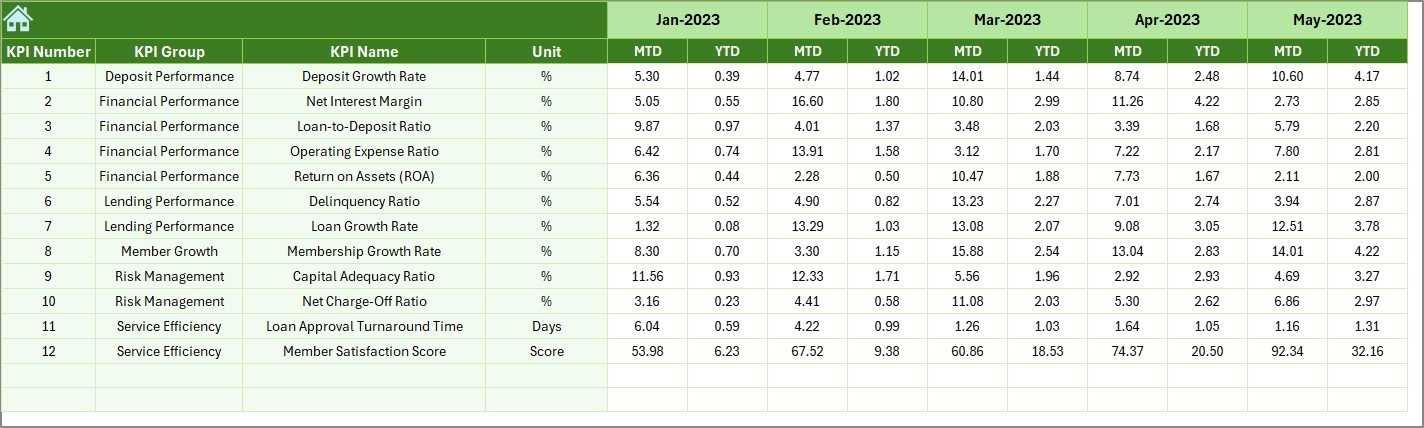
This sheet stores the previous year’s MTD and YTD data for every KPI.
Comparing past performance with current numbers gives insights into growth patterns and long-term improvements.
By entering prior year data, the dashboard enables year-over-year (YoY) comparison and helps assess performance consistency.
7️⃣ KPI Definition Sheet Tab
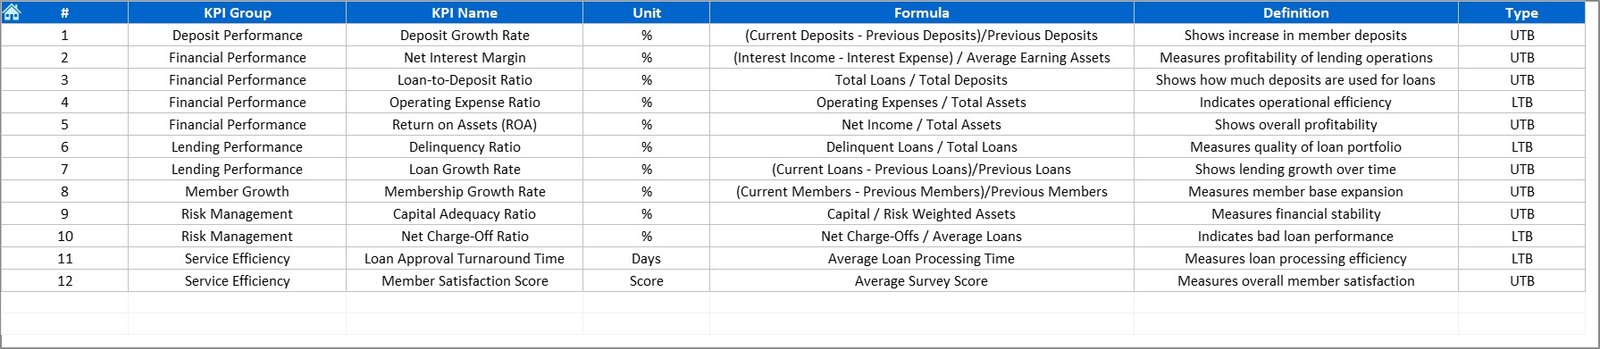
This sheet provides the backbone for KPI understanding and data accuracy.
-
List out each KPI along with:
-
KPI Name
-
KPI Group
-
Unit
-
Formula
-
Definition
-
-
This sheet acts as a reference guide to maintain standardization and ensure every team member understands each metric clearly.
💡 Why Do Credit Unions Need a KPI Dashboard?
Credit unions operate in a highly competitive financial sector. Tracking key performance indicators is essential to ensure financial stability, member satisfaction, and operational excellence.
However, manual tracking can lead to:
-
Inconsistent reporting
-
Human errors
-
Delayed insights
-
Ineffective decision-making
The Credit Unions KPI Dashboard in Excel solves these problems by offering a real-time, visual, and structured approach to performance measurement.
Click to Purchases Credit Unions KPI Dashboard in Excel
📈 Key Metrics You Can Track with This Dashboard
Some of the most common and valuable KPIs you can monitor include:
-
Loan Growth Rate – Measures the percentage growth in total loans compared to the previous period.
-
Deposit Growth Rate – Indicates how effectively the credit union is attracting member deposits.
-
Net Interest Margin (NIM) – Shows profitability from lending and investing activities.
-
Loan-to-Share Ratio – Evaluates the balance between loans granted and member shares.
-
Return on Assets (ROA) – Assesses how efficiently assets generate earnings.
-
Operating Expense Ratio – Helps control costs by comparing operating expenses to total income.
-
Delinquency Ratio – Identifies the portion of loans that are overdue or defaulted.
-
Member Growth – Tracks how well the credit union is attracting and retaining members.
-
Capital Adequacy Ratio (CAR) – Ensures the credit union maintains a healthy capital buffer.
-
Productivity per Employee – Measures efficiency and output per staff member.
These metrics, when visualized in one dashboard, provide a complete financial health overview.
🖥️ How the Credit Unions KPI Dashboard Works
-
Data Entry
Input actual, target, and previous year data in their respective sheets. -
Dashboard Update
Once data is entered, Excel formulas and links automatically update all visual elements. -
Interactive Selection
Choose the desired month from the dropdown to instantly view month-specific results. -
Variance Calculation
Automatically see how actual results compare to targets and previous years using color-coded indicators. -
Trend Analysis
Explore the KPI Trend tab to view historical performance charts and track improvement patterns.
🔍 Benefits of Using the Credit Unions KPI Dashboard in Excel
1. Centralized Performance Monitoring
All financial and operational KPIs appear in one location, saving time and effort.
2. Real-Time Decision-Making
Instant calculations and visuals allow faster insights, helping management respond promptly to performance trends.
3. Easy Customization
Users can add or remove KPIs, modify formulas, or adjust the time period to fit their reporting structure.
4. Visual Insights
Conditional formatting and charts provide intuitive understanding without reading long reports.
5. No Complex Software Needed
Since it runs on Excel, there’s no need for additional tools, making it budget-friendly and easy to share.
⚙️ How This Dashboard Enhances Strategic Decision-Making
With this dashboard, leadership teams can:
-
Identify top-performing departments or branches.
-
Detect underperforming areas early.
-
Set realistic growth targets based on historical data.
-
Analyze trends to forecast future performance.
-
Ensure compliance and financial stability through consistent monitoring.
This systematic view helps ensure every strategic decision is backed by accurate data.
🌟 Advantages of the Credit Unions KPI Dashboard in Excel
-
✅ Ease of Use: Simple Excel interface with drop-downs and buttons.
-
✅ Comprehensive Coverage: Tracks all vital financial, operational, and member-related KPIs.
-
✅ Automation: Reduces manual errors with auto-calculated metrics.
-
✅ Trend Visualization: Clear trend charts highlight growth or decline patterns.
-
✅ Improved Accountability: Each KPI is defined with ownership and targets.
-
✅ Scalability: Adaptable to any credit union size—from small cooperatives to large institutions.
-
✅ Data Transparency: Standardized KPIs ensure every team interprets results consistently.
These advantages make the dashboard a must-have performance tool for credit unions.
🧭 Best Practices for Using the Credit Unions KPI Dashboard
To get the most out of this Excel dashboard, follow these proven best practices:
1. Keep Data Updated Regularly
Update actual and target numbers monthly to ensure accuracy and relevance.
2. Use Consistent KPI Definitions
Refer to the KPI Definition sheet to avoid confusion and maintain reporting uniformity.
3. Monitor Both MTD and YTD Values
Compare month-to-month and year-to-date progress for balanced insights.
4. Review Trends, Not Just Numbers
Focus on direction—whether KPIs improve or decline—to guide long-term decisions.
5. Involve All Departments
Encourage cross-department participation to promote transparency and shared accountability.
6. Automate Data Imports (Optional)
Advanced users can connect data sources or use VBA scripts for automatic data loading.
🚀 Real-Life Use Cases for Credit Unions
-
Branch Performance Review: Compare loan growth and deposits across multiple branches.
-
Financial Health Tracking: Measure ROA, CAR, and NIM to ensure profitability.
-
Member Service Quality: Track member satisfaction or complaint resolution metrics.
-
Operational Efficiency: Identify high expense ratios or productivity gaps.
-
Compliance Monitoring: Ensure regulatory standards are consistently met.
By adapting the dashboard to specific organizational needs, credit unions can streamline both strategy and execution.
Click to Purchases Credit Unions KPI Dashboard in Excel
🧾 How to Get Started
-
Download the Dashboard File
Obtain the ready-to-use Excel template. -
Enter Your KPIs and Data
Fill in all actual, target, and previous year figures. -
Customize KPI Definitions
Modify KPI names or formulas according to your financial structure. -
Start Monitoring Results
Navigate between sheets using the Home menu and begin your performance review instantly.
Within minutes, your dashboard becomes a real-time command center for financial management.
🧠 Why Excel Is the Best Tool for Credit Union KPI Tracking
-
Universally accessible—no special software needed.
-
Easy to customize and share within the team.
-
Supports pivot charts, slicers, and conditional formatting.
-
Offers flexibility for advanced users (formulas, Power Query, VBA).
-
Integrates easily with other systems for importing/exporting data.
Excel combines simplicity with analytical power—perfect for modern credit unions.
🏁 Conclusion
The Credit Unions KPI Dashboard in Excel is more than a reporting tool—it’s a strategic decision-making system.
It empowers managers to track key metrics, monitor performance trends, and take timely action for growth.
With its clear visuals, real-time insights, and easy customization, this dashboard eliminates guesswork and enhances efficiency. Whether you manage a single branch or an entire credit union network, this Excel solution helps you stay ahead in performance management.
Click to Purchases Credit Unions KPI Dashboard in Excel
❓ Frequently Asked Questions (FAQs)
1. What is a KPI dashboard for credit unions?
A KPI dashboard helps track key financial and operational metrics such as loan growth, deposits, ROA, and member growth in one Excel file.
2. Can I customize the KPIs?
Yes, you can easily modify existing KPIs or add new ones in the KPI Definition sheet.
3. Does this dashboard work on all Excel versions?
Yes, it works on Microsoft Excel 2016 and later versions for both Windows and Mac.
4. How often should I update the data?
Update monthly or quarterly for the most accurate insights.
5. Can this dashboard handle multiple branches?
Yes, you can add branch-level filters or separate data sheets to compare multiple branches.
6. Do I need advanced Excel skills to use it?
No. It’s built for all users, with simple drop-downs and pre-linked formulas—no coding needed.
7. Can it calculate YoY growth automatically?
Yes. Once you enter Previous Year data, YoY variance and percentage change calculate automatically.
Click to Purchases Credit Unions KPI Dashboard in Excel
Visit our YouTube channel to learn step-by-step video tutorials