Customer Relationship Management (CRM) is at the heart of every successful business. Whether you run a small startup or a large enterprise, understanding how well your customer-facing activities perform determines your long-term growth. That’s where a CRM KPI Scorecard in Excel becomes a game-changer.
This article explains everything you need to know about the CRM KPI Scorecard — what it is, how it works, its structure, advantages, best practices, and FAQs to help you use it effectively.
Click to Purchases CRM KPI Scorecard in Excel
🌟 What Is a CRM KPI Scorecard in Excel?
A CRM KPI Scorecard in Excel is a structured performance management tool that helps organizations measure, monitor, and analyze customer relationship metrics. Instead of scattered reports or complex BI software, this ready-to-use Excel template provides a clear and visual representation of how your CRM goals align with business objectives.
You can easily compare actual vs. target performance, track month-to-date (MTD) and year-to-date (YTD) results, and make data-driven decisions to enhance customer engagement, retention, and satisfaction.
The best part? You don’t need to be a data expert — the scorecard is fully automated, visually rich, and simple to use.
📊 Why Use a CRM KPI Scorecard?
CRM data can be overwhelming — from leads and conversions to retention rates and customer satisfaction. Without a structured dashboard, this data stays underutilized.
The CRM KPI Scorecard in Excel converts raw data into meaningful insights. It allows teams to:
-
Evaluate CRM strategies effectively.
-
Identify improvement areas across departments.
-
Visualize progress toward sales and service goals.
-
Make informed decisions based on measurable KPIs.
-
Maintain alignment between marketing, sales, and customer support teams.
🧾 Structure of the CRM KPI Scorecard in Excel
This ready-to-use Excel template includes four well-designed worksheets, each serving a distinct purpose for CRM performance management.
Click to Purchases CRM KPI Scorecard in Excel
1️⃣ Scorecard Sheet
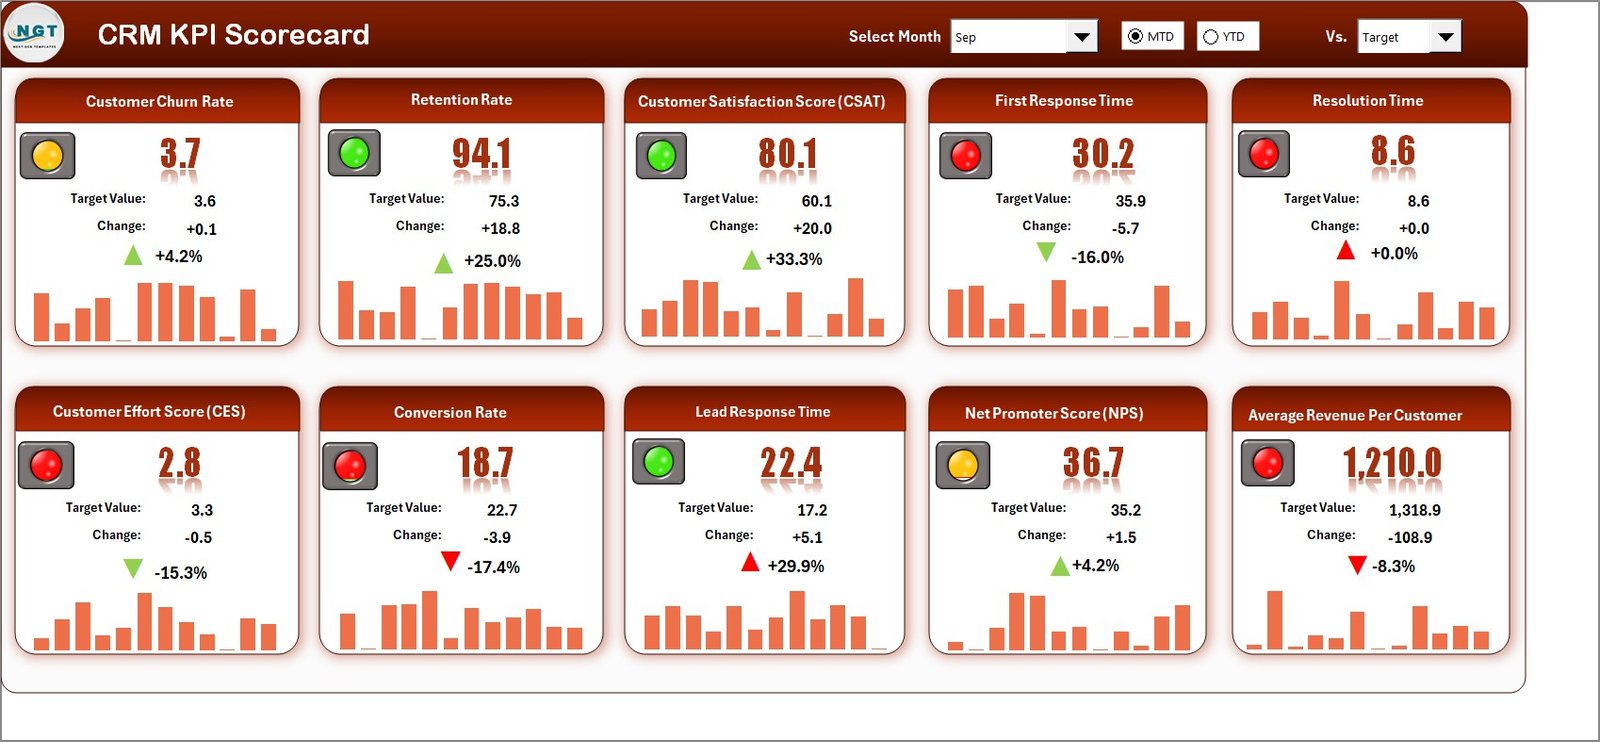
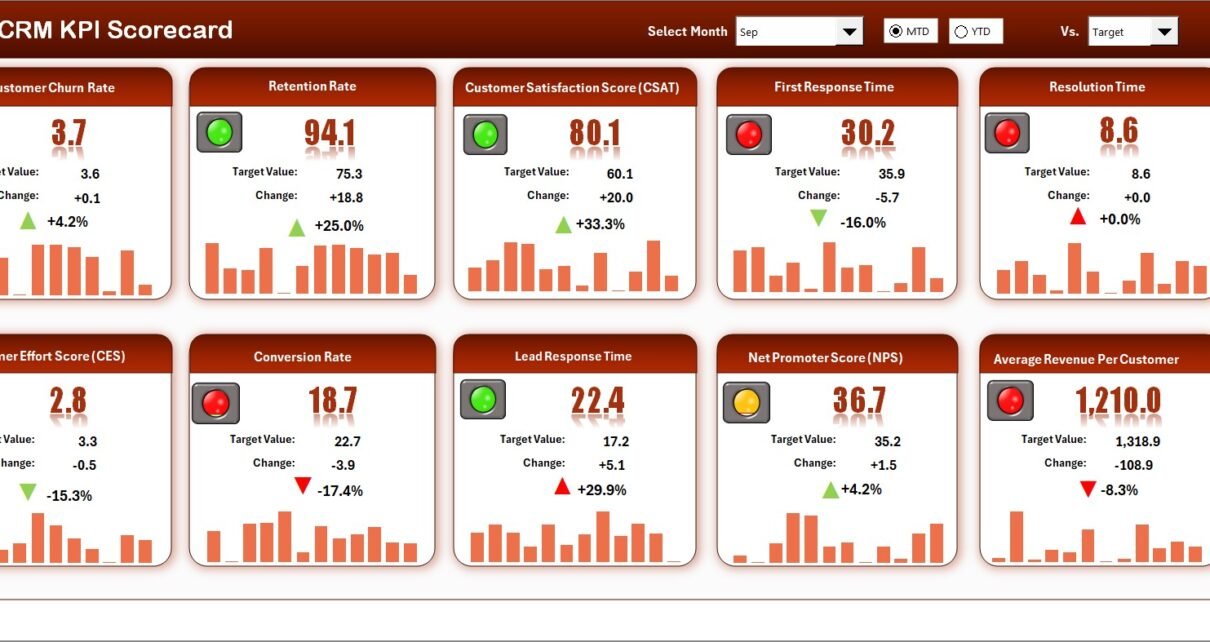
The Scorecard sheet is the main interface where you can view KPI performance. It’s designed with clarity and visual appeal to make analysis quick and effective.
Key Features:
-
🎯 Dropdown Menus: Choose a specific month or toggle between MTD (Month-to-Date) and YTD (Year-to-Date) performance.
-
📈 Actual vs Target Values: Instantly compare performance metrics against predefined targets.
-
🟢 Visual Indicators: Use conditional formatting and color coding (green for achieved, red for underperformance).
-
📊 Comprehensive Overview: Display detailed information for all KPIs, including definitions, formulas, and category grouping.
The Scorecard sheet acts as your command center — one glance tells you which KPIs are on track and which need attention.
2️⃣ KPI Trend Sheet
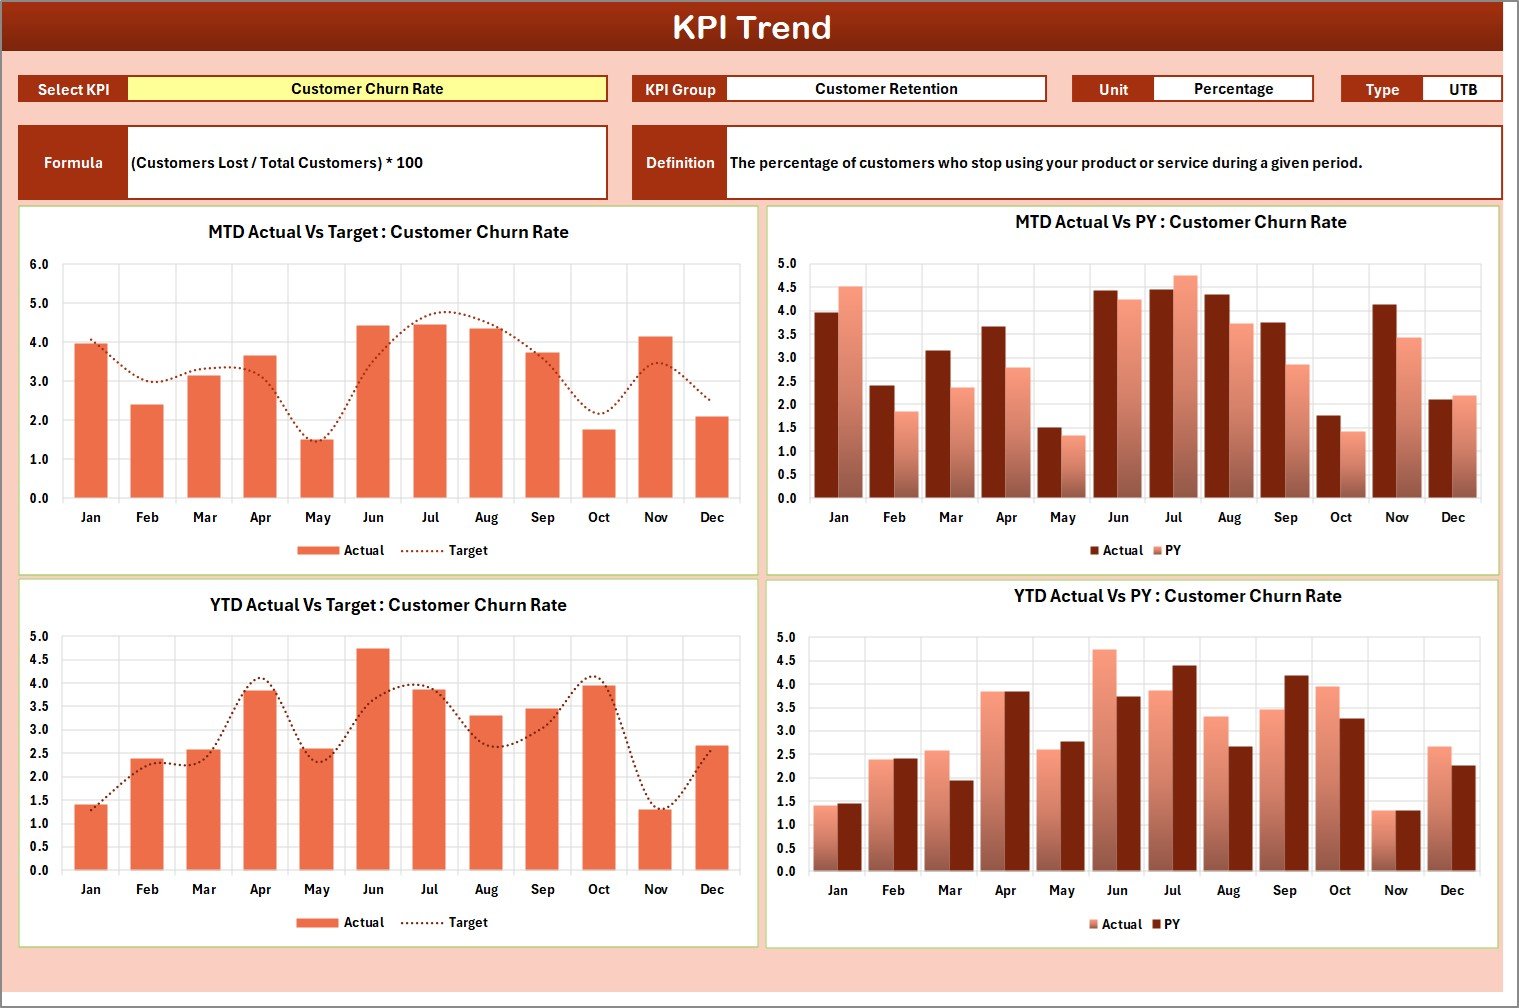
The KPI Trend sheet adds a dynamic element to your analysis. It provides a time-based visualization of KPI movement over months.
Highlights:
-
🧩 KPI Selection Dropdown: Located at cell C3 — allows you to pick any KPI for focused analysis.
-
📚 KPI Details: Shows KPI Group, Unit, Type (LTB or UTB), Formula, and Definition.
-
📉 Trend Charts: Displays MTD and YTD charts for Actual, Target, and Previous Year (PY) performance.
-
🔍 Visual Comparison: Identify patterns, growth, or declines in CRM performance trends.
This sheet helps you see the bigger picture — not just where you stand, but how you’ve evolved over time.
3️⃣ Input Data Sheet
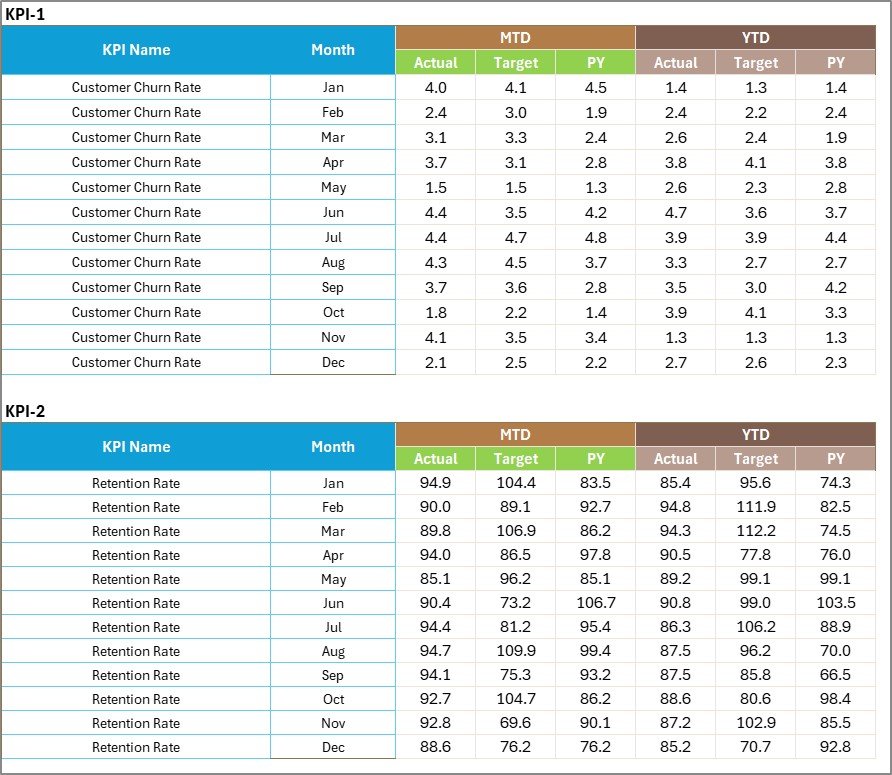
Data entry has never been easier. The Input Data sheet is where you record all KPI data points.
Features:
-
💾 Simple Data Entry: Input monthly actual values, targets, and previous year numbers for each KPI.
-
🔄 Real-Time Updates: As soon as you enter new data, the entire scorecard updates automatically.
-
🧠 User-Friendly Layout: Organized columns for quick data entry and error-free updates.
This design ensures your CRM performance dashboard always reflects the most accurate and up-to-date information.
4️⃣ KPI Definition Sheet
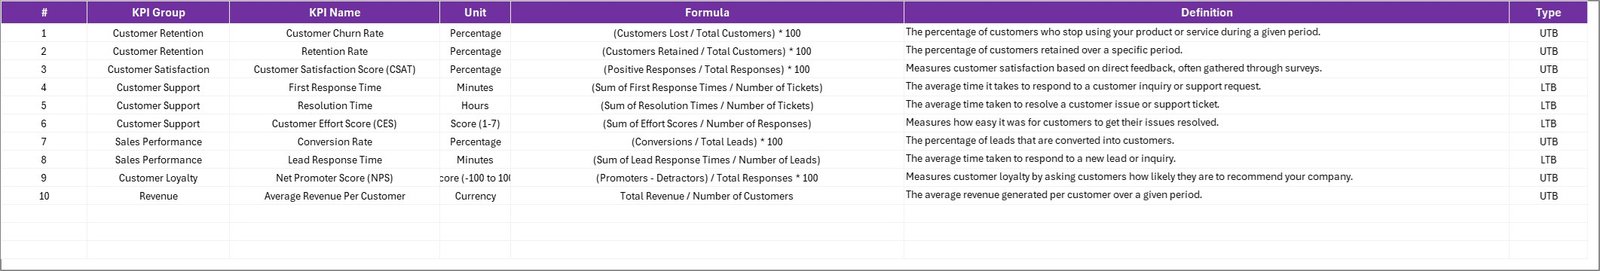
The KPI Definition sheet acts as your reference library.
Details captured include:
-
📌 KPI Name
-
📂 KPI Group (e.g., Sales, Customer Support, Marketing)
-
📏 Unit of Measurement (%, count, ratio, etc.)
-
🔣 Formula (used to calculate the KPI)
-
📝 Definition (brief explanation of what the KPI measures)
This sheet ensures consistency in data interpretation. Everyone across departments understands each KPI the same way, avoiding confusion or misreporting.
🧩 How the CRM KPI Scorecard Works
The CRM KPI Scorecard operates on a simple yet powerful logic:
-
You enter your monthly data into the Input Data sheet.
-
Excel formulas automatically calculate comparisons and performance metrics.
-
Conditional formatting highlights results visually.
-
The Scorecard and KPI Trend sheets refresh to reflect the latest numbers.
This automation saves time, reduces manual errors, and ensures all stakeholders access accurate information instantly.
Click to Purchases CRM KPI Scorecard in Excel
⚙️ How to Use the CRM KPI Scorecard Step-by-Step
1️⃣ Download the Template: Open the Excel file and explore all four sheets.
2️⃣ Enter Data: Go to the Input Data sheet and fill in your Actual, Target, and PY values for each KPI.
3️⃣ Set KPI Definitions: In the KPI Definition sheet, enter all KPI details — name, unit, formula, and description.
4️⃣ Analyze Performance: Navigate to the Scorecard sheet to view performance cards and tables.
5️⃣ View Trends: Open the KPI Trend sheet to visualize month-wise or year-wise trends.
6️⃣ Make Decisions: Use insights from the dashboard to optimize CRM processes, train teams, or adjust strategies.
📈 Advantages of Using a CRM KPI Scorecard in Excel
Using a CRM KPI Scorecard offers multiple benefits that make your customer management system smarter and more efficient.
✅ 1. Centralized Data Management
Keep all CRM performance data in one place, accessible to everyone in your team.
✅ 2. Real-Time Performance Tracking
Instantly visualize whether your KPIs are meeting, exceeding, or missing their targets.
✅ 3. Better Decision-Making
Gain actionable insights from real-time data to make informed business decisions.
✅ 4. Cost-Effective and Easy to Use
Unlike expensive CRM analytics software, Excel provides a familiar and flexible interface at zero additional cost.
✅ 5. Enhanced Collaboration
Share your scorecard easily with teams or stakeholders for transparent communication and aligned goals.
✅ 6. Visual Storytelling
Charts and conditional formatting make data interpretation quick and intuitive.
Click to Purchases CRM KPI Scorecard in Excel
🚀 Opportunities for Improvement
While Excel-based scorecards are powerful, you can further enhance their capabilities:
-
🔧 Add Power Query Integration: Automate data imports from CRM systems like HubSpot or Salesforce.
-
📊 Use Power BI Integration: Extend your Excel scorecard into a Power BI dashboard for real-time visualization.
-
💬 Add Comments and Notes: Record insights or improvement actions directly beside each KPI.
-
📈 Automate Reports: Use macros or VBA to generate monthly performance summaries automatically.
-
🧮 Include Forecasting Models: Predict future performance using Excel’s trendline or regression features.
These additions can make your CRM scorecard even more robust and intelligent.
🏆 Best Practices for Using the CRM KPI Scorecard in Excel
Implementing best practices ensures you get maximum value from your scorecard.
💡 1. Define Clear KPIs
Ensure every KPI aligns with your business objectives. Avoid vanity metrics that don’t impact growth.
💡 2. Keep the Data Clean
Regularly validate and clean your CRM data to avoid misleading insights.
💡 3. Review Monthly and Annually
Use both MTD and YTD analyses to track short-term and long-term progress.
💡 4. Involve Multiple Departments
Include insights from marketing, sales, and customer support to build a comprehensive CRM view.
💡 5. Use Conditional Formatting Wisely
Color-coding results improves readability but should remain consistent throughout the scorecard.
💡 6. Maintain Version Control
When sharing the Excel file, maintain version numbers to prevent confusion between updates.
💬 Real-World Example
Imagine a software company tracking customer satisfaction, retention, and lead conversions.
-
The marketing team measures campaign ROI and lead generation.
-
The sales team focuses on conversion rate and follow-up completion.
-
The support team monitors ticket resolution time and customer satisfaction.
By using the CRM KPI Scorecard, the company identifies that response times are slowing down during peak seasons. This insight leads them to hire additional support staff — improving customer satisfaction scores within a month.
Click to Purchases CRM KPI Scorecard in Excel
📘 Conclusion
A CRM KPI Scorecard in Excel is more than a reporting tool — it’s a roadmap for continuous improvement. It helps businesses monitor customer relationships with precision, align departmental goals, and foster a data-driven culture.
With its structured layout, dynamic charts, and intuitive interface, this template offers everything you need to manage CRM KPIs effectively. Whether you are a sales manager, marketer, or business owner, this tool will simplify your workflow and enhance your decision-making power.
Start using it today — and turn your customer data into actionable insights.
❓ Frequently Asked Questions (FAQs)
1️⃣ What is a CRM KPI Scorecard?
A CRM KPI Scorecard is a structured Excel tool used to measure and track key performance indicators related to customer relationship management, such as conversion rates, retention, and satisfaction.
2️⃣ How do I customize the KPIs in this scorecard?
Go to the KPI Definition sheet, edit or add new KPIs, and update their formulas or definitions. The Scorecard and Trend sheets will update automatically.
3️⃣ Can I use this scorecard for multiple departments?
Yes! You can categorize KPIs by department (e.g., Sales, Marketing, Support) and track their performance separately or together.
4️⃣ What Excel features power this dashboard?
It uses dropdown menus, data validation lists, conditional formatting, lookup formulas, and chart visualizations for trend analysis.
5️⃣ Is this template suitable for beginners?
Absolutely. It’s designed for users with basic Excel knowledge. Clear instructions and intuitive layouts make it simple to use.
6️⃣ Can I integrate this with CRM software?
Yes. You can import data from CRM tools such as Salesforce or HubSpot using Power Query or VBA automation for seamless updates.
7️⃣ How often should I update the data?
Ideally, update the Input Data sheet monthly. For real-time insights, you can automate data refreshes if your CRM connects directly to Excel.
8️⃣ Does the template include visual analytics?
Yes. The Scorecard and Trend sheets feature charts and visual indicators to simplify complex data interpretation.
Click to Purchases CRM KPI Scorecard in Excel
Visit our YouTube channel to learn step-by-step video tutorials