Modern agriculture has become increasingly data-driven. Farmers, agricultural consultants, agribusiness companies, and government agencies now rely heavily on analytics to make better decisions. Crop advisory platforms collect large volumes of agricultural data related to crop performance, costs, risks, and revenues. However, raw data alone does not help decision-makers. Instead, professionals need clear insights that allow them to monitor farm performance, analyze advisory effectiveness, and identify improvement opportunities.
Therefore, businesses and agricultural organizations increasingly use Power BI dashboards to visualize and analyze crop advisory data.
One powerful solution is the Crop Advisory Platforms Dashboard in Power BI. This dashboard helps agricultural professionals analyze costs, revenues, advisory performance, and crop risks using interactive visualizations. As a result, users can quickly identify trends, evaluate advisory effectiveness, and improve farm profitability.
Moreover, Power BI dashboards transform complex agricultural datasets into simple visual reports. Consequently, farmers, agronomists, and decision-makers can monitor performance across crops, regions, advisory channels, and time periods.
In this comprehensive guide, we will explore the Crop Advisory Platforms Dashboard in Power BI, including its structure, key features, advantages, and best practices for effective use.
Click to buy Crop Advisory Platforms Dashboard in Power BI
What Is a Crop Advisory Platforms Dashboard in Power BI?
A Crop Advisory Platforms Dashboard in Power BI is an interactive business intelligence solution designed to analyze agricultural advisory data.
Crop advisory platforms provide recommendations related to:
- Crop management
- Fertilizer usage
- Pest and disease control
- Irrigation scheduling
- Soil health
- Yield optimization
However, agricultural organizations often collect advisory data from multiple sources. Therefore, analyzing this data manually becomes difficult.
A Power BI dashboard solves this problem. It organizes data into interactive charts, KPIs, and analytical views. As a result, users can easily monitor performance indicators such as cost reduction, revenue growth, risk levels, and profit margins.
Additionally, the dashboard compares costs before advisory and costs after advisory, allowing stakeholders to measure the impact of advisory services.
Consequently, agricultural businesses can improve operational efficiency, reduce farming risks, and increase profitability.
Why Do Agricultural Organizations Need Crop Advisory Analytics?
Agriculture faces many uncertainties. Weather changes, pest outbreaks, soil conditions, and market fluctuations affect crop performance.
Therefore, agricultural organizations must continuously monitor crop performance and advisory impact.
A crop advisory dashboard helps organizations:
- Evaluate advisory effectiveness
- Monitor crop profitability
- Identify high-risk regions
- Analyze advisory adoption trends
- Track seasonal performance
- Improve farming strategies
Furthermore, data visualization helps users understand trends faster. Instead of reviewing spreadsheets, decision-makers can instantly see insights through visual reports.
Key Features of the Crop Advisory Platforms Dashboard in Power BI
This Crop Advisory Platforms Dashboard in Power BI contains five analytical pages inside the Power BI desktop file. Each page focuses on a specific aspect of agricultural advisory performance.
These pages include:
- Overview Page
- Crop Analysis
- Advisory Type Analysis
- Region Analysis
- Month Analysis
Each page provides unique insights that help agricultural organizations make better decisions.
Overview Page: What Insights Does It Provide?
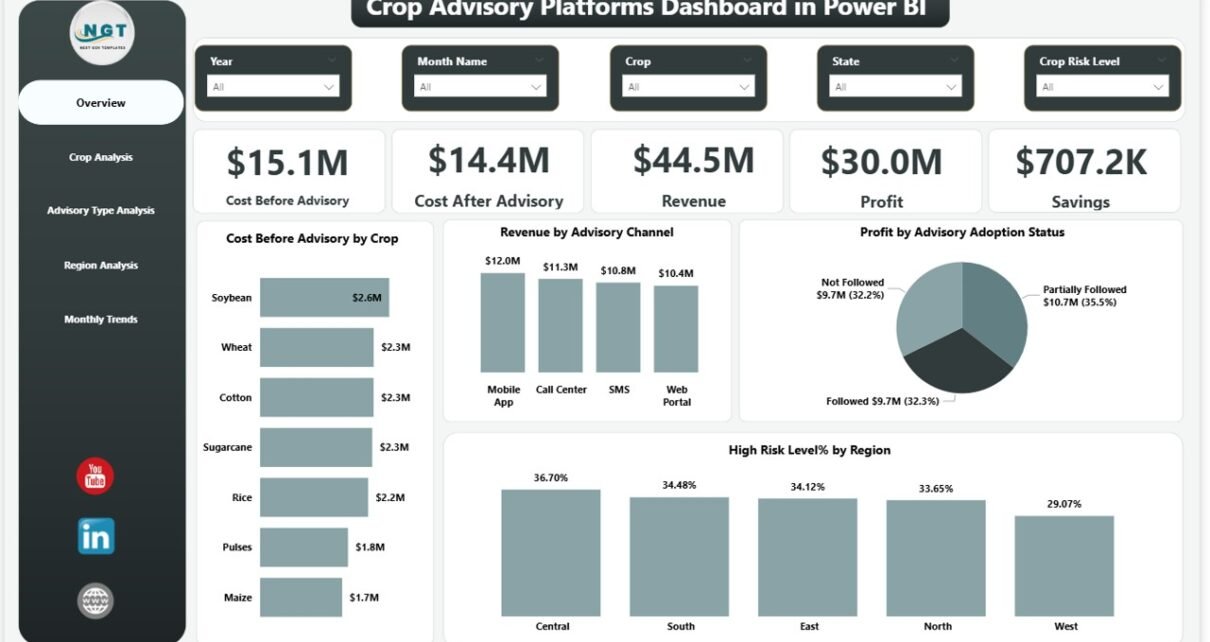
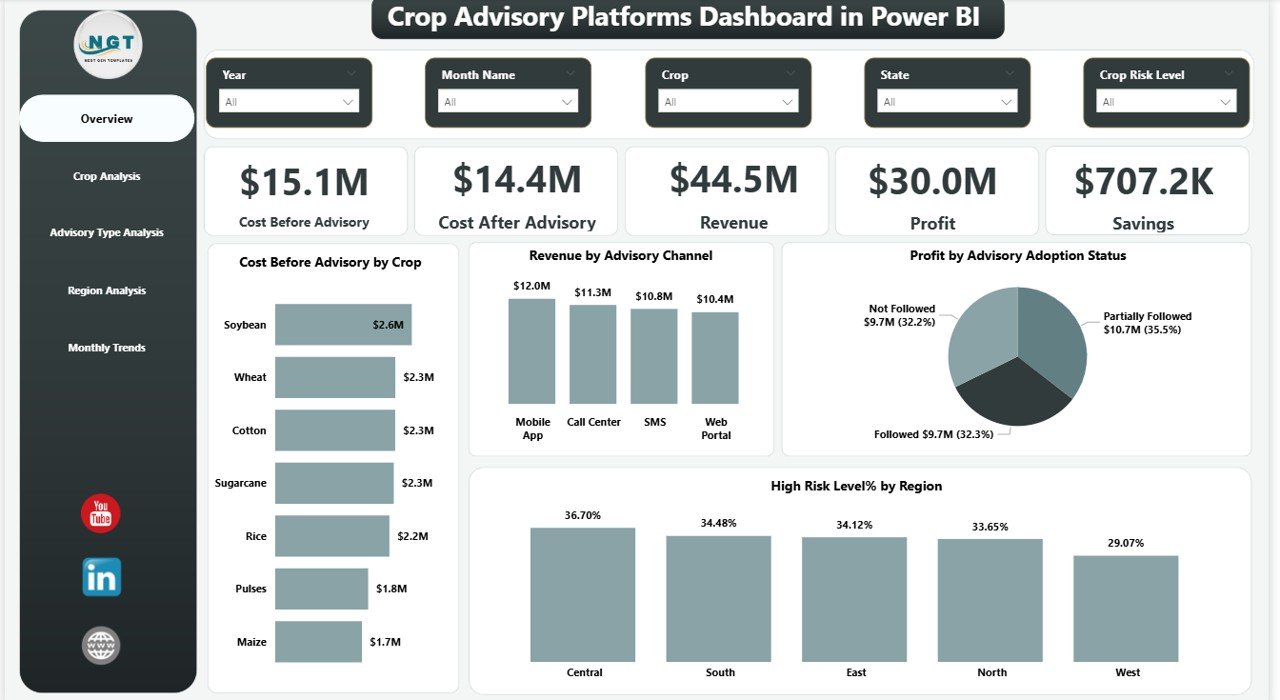
The Overview Page acts as the central control panel of the dashboard. It provides a quick summary of the entire crop advisory system.
Users can immediately see key financial and performance indicators.
KPI Cards on the Overview Page
The dashboard displays five important KPI cards:
- Cost Before Advisory – Shows farming cost before advisory recommendations.
- Cost After Advisory – Displays the cost after implementing advisory suggestions.
- Revenue – Represents total crop revenue.
- Profit – Displays net profit after deducting costs.
- Saving – Highlights cost reduction achieved through advisory services.
These KPIs help stakeholders quickly evaluate the financial impact of crop advisory programs.
Charts on the Overview Page
The page also includes four analytical charts:
- Cost Before Advisory Analysis
- Revenue by Advisory Channel
- Profit by Advisory Adoption Status
- High Risk Level % by Region
These visualizations provide valuable insights. For example, users can identify which advisory channels generate higher revenue or which regions face higher agricultural risk.
As a result, organizations can allocate resources more effectively.
Click to buy Crop Advisory Platforms Dashboard in Power BI
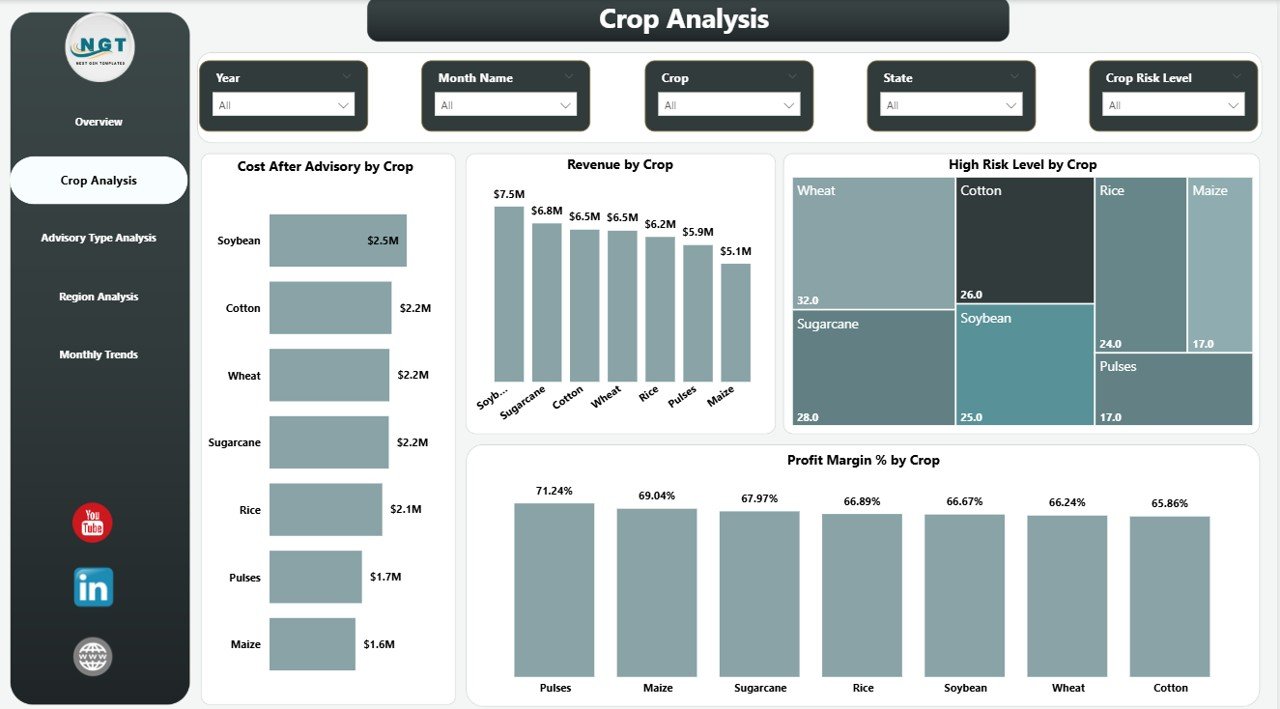
Crop Analysis: How Does It Help Farmers Understand Crop Performance?
The Crop Analysis page focuses on crop-level insights. It allows agricultural experts to compare the performance of different crops.
This analysis helps decision-makers identify which crops benefit most from advisory services.
Charts Available in Crop Analysis
This page includes four analytical charts:
- Cost After Advisory by Crop
- Revenue by Crop
- High Risk Level by Crop
- Profit Margin % by Crop
These charts help answer important questions such as:
- Which crops generate the highest profit?
- Which crops carry the highest risk?
- Which crops respond best to advisory recommendations?
Consequently, agricultural managers can prioritize profitable crops and improve crop planning.
Click to buy Crop Advisory Platforms Dashboard in Power BI
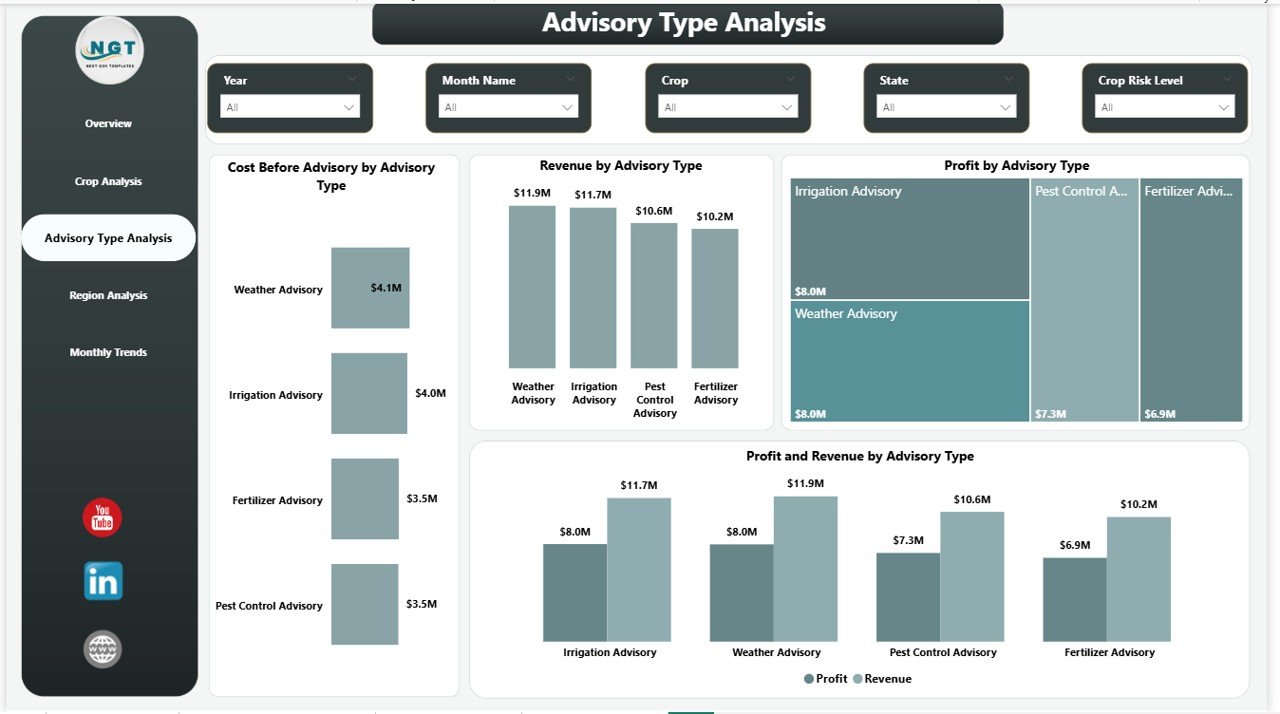
Advisory Type Analysis: Which Advisory Methods Work Best?
Different advisory methods influence agricultural outcomes differently. Therefore, organizations must analyze advisory performance carefully.
The Advisory Type Analysis page evaluates the impact of different advisory approaches.
Charts Included in Advisory Type Analysis
This page contains four charts:
- Cost Before Advisory by Advisory Type
- Revenue by Advisory Type
- Profit by Advisory Type
- Profit and Revenue Comparison by Advisory Type
These charts allow users to compare different advisory channels, such as:
- Digital advisory platforms
- Mobile advisory applications
- Field consultant advisory
- SMS-based advisory systems
By analyzing these channels, organizations can identify the most effective advisory method.
Consequently, they can invest more resources in the most successful advisory platforms.
Click to buy Crop Advisory Platforms Dashboard in Power BI
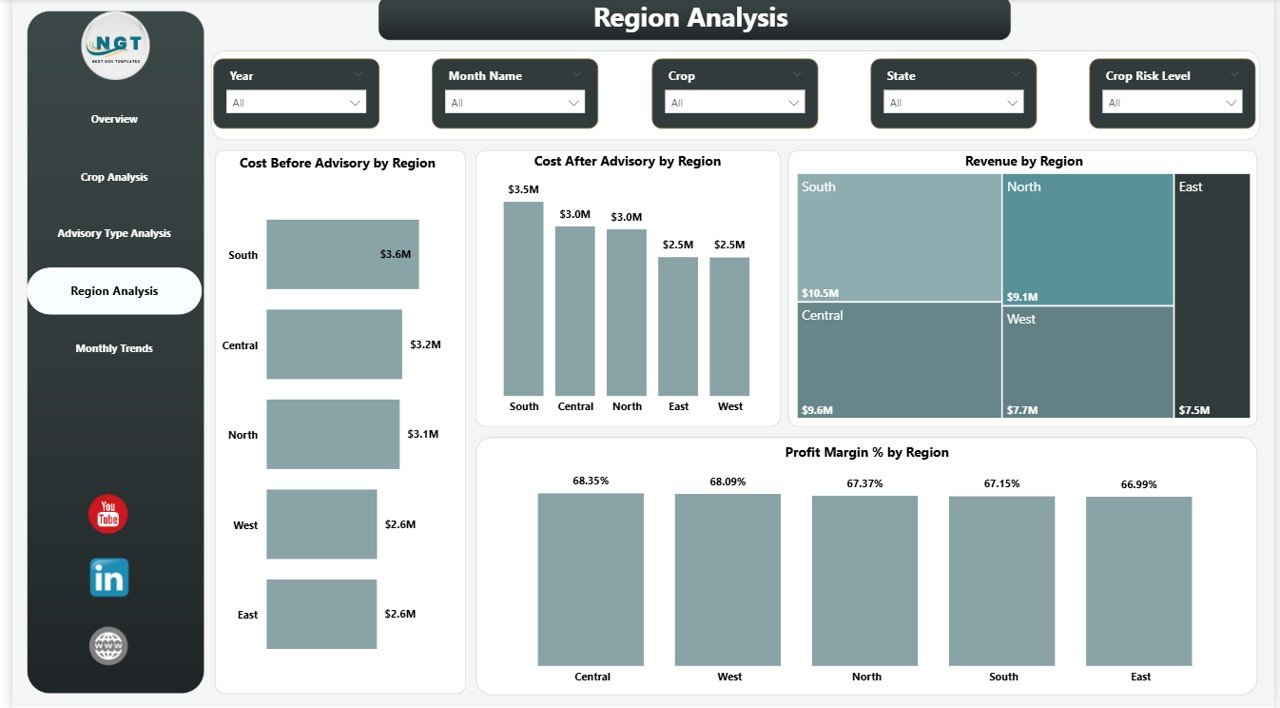
Region Analysis: How Does Advisory Impact Vary by Region?
Agricultural performance varies significantly across regions. Soil quality, climate conditions, and farming practices differ from place to place.
Therefore, regional analysis plays a critical role in crop advisory programs.
The Region Analysis page helps stakeholders evaluate agricultural performance across different geographic regions.
Charts Included in Region Analysis
This page contains four analytical charts:
- Cost Before Advisory by Region
- Cost After Advisory by Region
- Revenue by Region
- Profit Margin % by Region
These visualizations provide insights such as:
- Which regions achieve the highest profitability
- Which regions require more advisory support
- Which regions show the biggest cost reduction
Consequently, agricultural organizations can develop region-specific strategies to improve productivity.
Click to buy Crop Advisory Platforms Dashboard in Power BI
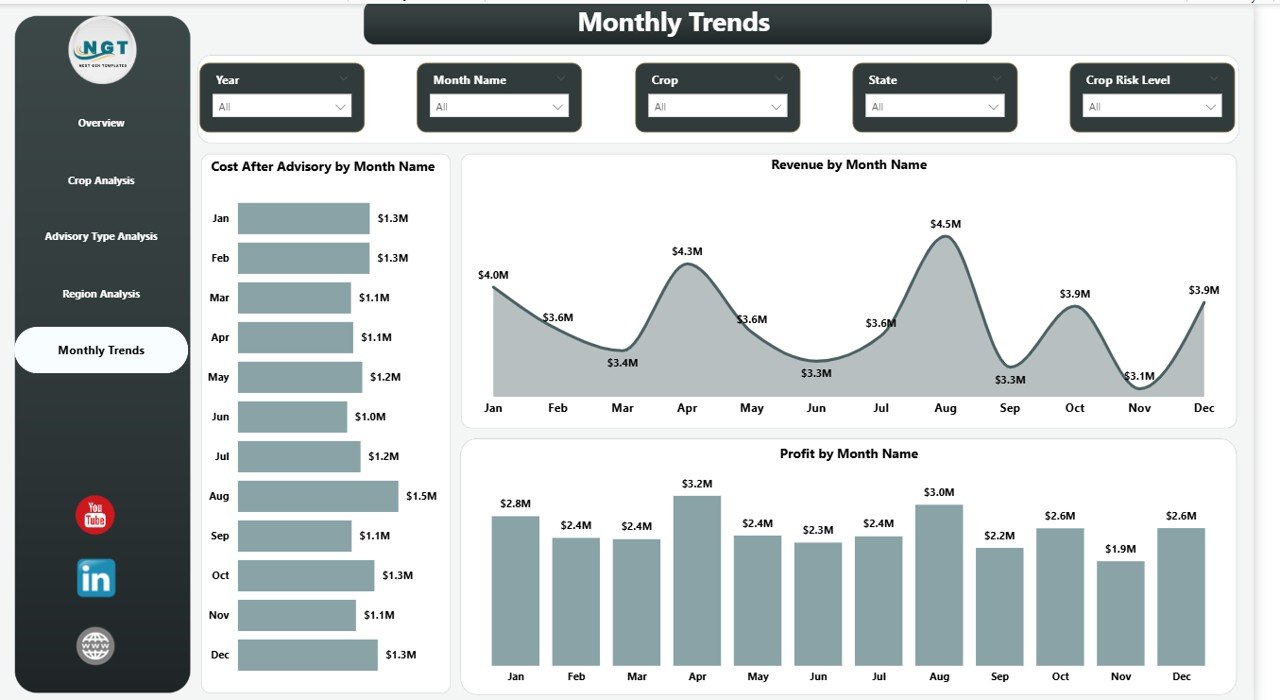
Month Analysis: Why Is Seasonal Monitoring Important?
Agriculture depends heavily on seasonal cycles. Therefore, monthly performance analysis becomes essential.
The Month Analysis page tracks crop advisory impact across different months.
Charts Included in Month Analysis
This page includes three key charts:
- Cost After Advisory by Month
- Revenue by Month
- Profit by Month
These insights help organizations understand seasonal patterns.
For example:
- Certain months may generate higher revenue.
- Some months may require higher farming costs.
- Advisory impact may vary during different crop stages.
Consequently, organizations can optimize their advisory strategies throughout the farming cycle.
Click to buy Crop Advisory Platforms Dashboard in Power BI
Advantages of the Crop Advisory Platforms Dashboard in Power BI
Using a Crop Advisory Platforms Dashboard in Power BI provides many advantages for agricultural organizations.
Better Decision-Making
The dashboard provides clear insights into crop performance. Therefore, decision-makers can act quickly and confidently.
Improved Profitability
Users can identify cost-saving opportunities and profitable crops. As a result, farming operations become more efficient.
Risk Identification
The dashboard highlights regions or crops with high risk levels. Consequently, organizations can take preventive measures.
Enhanced Advisory Evaluation
Organizations can measure how advisory recommendations influence farming outcomes.
Centralized Data Monitoring
Instead of reviewing multiple spreadsheets, users can monitor all insights from a single dashboard.
Interactive Analysis
Power BI dashboards allow users to filter data using slicers and interactive controls.
Therefore, users can explore data based on crops, regions, advisory types, and months.
Opportunities for Improvement in Crop Advisory Platforms
Although crop advisory dashboards provide powerful insights, organizations can further enhance their systems.
Integration with Weather Data
Weather conditions strongly influence crop performance. Therefore, integrating weather data can improve advisory accuracy.
Real-Time Data Collection
Using IoT sensors and mobile applications can provide real-time field data.
Predictive Analytics
Machine learning models can predict crop risks and yield performance.
Mobile Dashboard Access
Farmers benefit greatly from mobile access to dashboards.
Satellite Data Integration
Satellite imagery can provide insights related to soil health and crop growth.
These improvements can make crop advisory systems even more powerful.
Best Practices for the Crop Advisory Platforms Dashboard in Power BI
Organizations should follow certain best practices to maximize dashboard effectiveness.
Use Clear KPIs
Define clear KPIs such as cost reduction, revenue growth, and profit margins.
Maintain Clean Data
Accurate analysis requires clean and consistent data.
Update Data Regularly
Frequent data updates ensure accurate insights.
Design User-Friendly Visuals
Charts should remain simple and easy to understand.
Enable Interactive Filtering
Slicers allow users to analyze data from different perspectives.
Monitor Key Performance Metrics
Track metrics such as:
- Cost reduction
- Advisory adoption rate
- Crop profitability
- Risk levels
These best practices ensure that users gain meaningful insights from the dashboard.
Who Can Benefit from the Crop Advisory Platforms Dashboard?
Many stakeholders in the agricultural ecosystem can benefit from this dashboard.
Farmers
Farmers can track crop profitability and improve farming practices.
Agronomists
Agricultural experts can analyze crop health and advisory effectiveness.
Agribusiness Companies
Companies can monitor crop performance across different regions.
Government Agencies
Government bodies can evaluate agricultural programs and advisory initiatives.
Agricultural Consultants
Consultants can provide data-driven recommendations to farmers.
Therefore, this dashboard serves as a valuable analytical tool across the agricultural industry.
How Does Power BI Improve Agricultural Analytics?
Power BI provides several powerful features for agricultural data analysis.
Interactive Visualizations
Users can analyze data through charts, graphs, and KPI cards.
Real-Time Reporting
Organizations can monitor farm performance in real time.
Data Integration
Power BI integrates data from multiple sources such as Excel, databases, and cloud platforms.
Drill-Down Analysis
Users can explore deeper insights within charts.
Easy Sharing
Organizations can share dashboards with teams and stakeholders.
Consequently, Power BI transforms agricultural data into actionable insights.
Conclusion
Agriculture continues to evolve with the help of technology and data analytics. Crop advisory platforms generate valuable data that helps farmers and agricultural organizations improve productivity and profitability.
However, without proper analytics tools, organizations cannot fully utilize this data.
The Crop Advisory Platforms Dashboard in Power BI solves this problem by providing interactive visualizations, performance metrics, and analytical insights.
This dashboard enables users to analyze crop performance across multiple dimensions, including crops, advisory types, regions, and time periods.
As a result, agricultural organizations can:
- Improve advisory strategies
- Reduce farming costs
- Identify high-risk areas
- Increase crop profitability
Ultimately, data-driven agriculture will continue to shape the future of farming. Therefore, tools like the Crop Advisory Platforms Dashboard in Power BI play a vital role in helping agricultural professionals make smarter decisions.
Frequently Asked Questions (FAQs)
What is a Crop Advisory Platform?
A crop advisory platform provides recommendations to farmers regarding crop management, pest control, irrigation, and soil health.
These platforms help farmers improve crop productivity and reduce farming risks.
What is a Crop Advisory Dashboard?
A crop advisory dashboard visualizes agricultural data using charts, KPIs, and reports. It helps users analyze crop performance and advisory effectiveness.
Why should agricultural organizations use Power BI dashboards?
Power BI dashboards provide clear visual insights, interactive analysis, and real-time reporting. Therefore, they help organizations make better agricultural decisions.
What metrics does the Crop Advisory Platforms Dashboard track?
The dashboard tracks several key metrics, including:
- Cost before advisory
- Cost after advisory
- Revenue
- Profit
- Profit margin
- Risk levels
- Regional performance
- Crop-level performance
Can farmers use Power BI dashboards?
Yes. Farmers can use Power BI dashboards to monitor crop performance, track advisory impact, and improve decision-making.
How does advisory data improve crop performance?
Advisory data provides guidance on fertilizers, irrigation, pest management, and crop practices. Consequently, farmers can improve yields and reduce costs.
Visit our YouTube channel to learn step-by-step video tutorials
Watch the step-by-step video tutorial:
Click to buy Crop Advisory Platforms Dashboard in Power BI