Crowdfunding is an exciting space full of opportunity and momentum. But when you’re managing backers, tracking goals, and analyzing campaign performance, things can quickly get overwhelming. In a world where data drives decisions, you need more than just spreadsheets—you need a centralized, visual, and actionable tool.
That’s exactly why the Crowdfunding KPI Dashboard in Power BI is a game-changer. Whether you’re managing one campaign or many, this dashboard puts your most important KPIs at your fingertips, making it easier to stay on track and exceed expectations.
In this comprehensive guide, we’ll break down what this dashboard does, why it matters, and how to use it effectively.
Click to Purchases Crowdfunding KPI Dashboard in Power BI
What Is the Crowdfunding KPI Dashboard in Power BI?
The Crowdfunding KPI Dashboard in Power BI is a ready-to-use, Excel-powered reporting tool that helps you track campaign metrics in real-time. Built with Power BI and structured Excel inputs, this dashboard provides full visibility into the performance of your crowdfunding campaigns, from funding goals to donor engagement.
You don’t need any coding skills to use it. Just update the Excel sheets, and the dashboard updates automatically.
Key Features of the Crowdfunding KPI Dashboard
This dashboard includes three main Power BI pages, each serving a specific purpose:
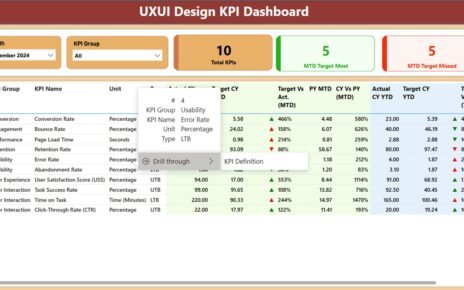
Summary Page – Central Control for KPI Monitoring

The summary page gives you a high-level overview of campaign performance. You’ll find:
- Slicers for filtering by Month and KPI Group
KPI Cards showing:
- Total KPIs tracked
- KPIs meeting MTD (Month-to-Date) targets
- KPIs missing MTD targets
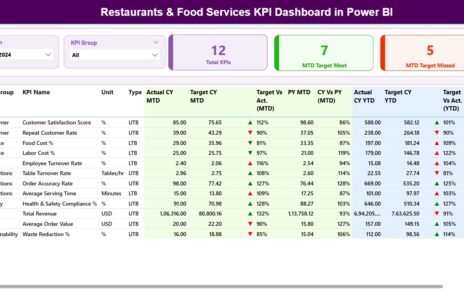
Below the summary cards, there’s a detailed, auto-updating KPI table with the following data:
- KPI Number: Unique sequence
- KPI Group: E.g., Funding, Engagement, Conversion
- KPI Name: Name of the specific metric
- Unit: Dollars, percentages, counts, etc.
- Type: UTB (Upper the Better) or LTB (Lower the Better)
- Actual CY MTD: Current year MTD values
- Target CY MTD: MTD targets
- MTD Icon: Up/down arrows (green/red) indicating KPI status
- MTD Target vs Actual %
- PY MTD: Last year’s MTD number
- CY vs PY MTD %: Current vs. Previous Year comparison
- Actual CY YTD, Target CY YTD, YTD Icon, YTD %, PY YTD, CY vs PY YTD %
This design makes it easy to monitor funding progress, donor conversion, email open rates, or social engagement.
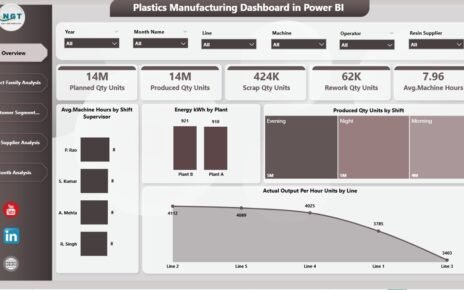
KPI Trend Page – Dive Deeper into Metrics

Visualize progress over time using combo charts. With a slicer to choose the KPI, this page displays:
- MTD comparison for Current Year, Previous Year, and Target
- YTD comparison for Current Year, Previous Year, and Target
This view helps you spot performance trends and take action fast.
Click to Purchases Crowdfunding KPI Dashboard in Power BI
KPI Definition Page – Understand Your Metrics

This hidden drill-through page lets you explore:
- KPI formula
- Definition
- Unit and Type
You can access this page by right-clicking on any KPI in the summary table and choosing the drill-through option. Click the “Back” button in the top-left to return.
Excel as the Data Engine
The dashboard gets its data from a structured Excel workbook with three sheets:
1. Input_Actual

- Record actual MTD and YTD numbers
- Use the first date of each month as the entry format
2. Input_Target

- Enter your MTD and YTD target values for each KPI
- Use the same date format (1st of each month)
3. KPI_Definition

List KPI details like:
- KPI Number
- KPI Group
- KPI Name
- Unit
- Formula
- Definition
- Type (UTB or LTB)
Advantages of Using the Crowdfunding KPI Dashboard
Click to Purchases Crowdfunding KPI Dashboard in Power BI
Why switch to this dashboard? Here are the biggest benefits:
✅ Real-time Monitoring: Instantly track funding, conversions, and performance
🌐 Excel-Powered Simplicity: No complex tools or technical skills needed
📈 Visual Cues: Arrows and color codes make KPI performance easy to understand
📆 MTD & YTD Views: Compare present with past effortlessly
🔺 Flexible and Customizable: Add, remove, or update KPIs as needed
🔄 Data-Driven Decisions: Spot trends and take action quickly
Best Practices for Crowdfunding KPI Tracking
To get the most value from your dashboard, follow these best practices:
🔄 Update Monthly: Refresh your Excel file with the latest data on time
🤝 Align KPIs with Campaign Goals: Track what actually matters to your campaign success
🔄 Share Insights with Stakeholders: Use visuals in meetings for clearer communication
📈 Focus on Actionable Metrics: Don’t overcrowd the dashboard
🔧 Define KPIs Clearly: Make sure everyone understands what each metric means
Frequently Asked Questions (FAQs)
1. Can I use this dashboard for multiple campaigns?
Yes. You can filter KPIs by campaign or even create additional KPI groups.
2. Do I need Power BI Pro to use this?
You can use Power BI Desktop for free. Power BI Pro is needed for sharing online.
3. Can I customize the KPIs and visuals?
Absolutely! You can change KPIs, update Excel sheets, and modify visuals in Power BI.
4. How secure is the data?
Since it runs locally on Excel and Power BI Desktop, your data stays within your environment.
5. How often should I update the dashboard?
Monthly is ideal, but you can update weekly or daily depending on your campaign needs.
Conclusion
The Crowdfunding KPI Dashboard in Power BI transforms how you track, analyze, and optimize your fundraising efforts. By combining the simplicity of Excel with the powerful visuals of Power BI, it gives campaign managers the clarity they need to make confident decisions.
Click to Purchases Crowdfunding KPI Dashboard in Power BI
Visit our YouTube channel to learn step-by-step video tutorials