Data privacy has become a top priority for organizations across industries. Regulations continue to evolve, customer expectations keep rising, and the cost of non-compliance keeps increasing. Because of this, data privacy teams can no longer rely on scattered Excel files or static reports.
That is exactly where a Data Privacy Office KPI Dashboard in Power BI makes a powerful difference.
In this detailed and SEO-friendly guide, you will learn what a Data Privacy Office KPI Dashboard in Power BI is, why it matters, how it works, its page-wise structure, the KPIs it tracks, advantages, best practices, and frequently asked questions. By the end of this article, you will clearly understand how this ready-to-use dashboard helps data privacy teams take control, improve compliance, and make faster decisions.
Click to buy Data Privacy Office KPI Dashboard in Power BI
What Is a Data Privacy Office KPI Dashboard in Power BI?
A Data Privacy Office KPI Dashboard in Power BI is an interactive analytics solution that tracks and visualizes key performance indicators related to data protection, privacy compliance, and governance.
Instead of reviewing long spreadsheets or manual reports, this dashboard converts raw KPI data into clear visuals, trend analysis, and status indicators. As a result, data privacy leaders can monitor performance in real time and act before risks grow.
Moreover, the dashboard uses Excel as the data source and Power BI as the visualization layer. Therefore, teams can easily update data without technical complexity while still enjoying advanced analytics.
Why Do Organizations Need a Data Privacy KPI Dashboard?
Data privacy teams face constant pressure. Regulations change frequently. Audits demand accurate numbers. Leadership expects clear answers. Meanwhile, manual tracking wastes time and increases error risk.
Because of these challenges, organizations need a structured and visual way to monitor privacy KPIs.
A Data Privacy Office KPI Dashboard in Power BI helps because it:
- Centralizes all privacy KPIs in one place
- Highlights target achievements and misses instantly
- Compares current performance with previous years
- Tracks trends for MTD and YTD values
- Supports audits and compliance reviews
As a result, privacy teams move from reactive reporting to proactive governance.
How Does a Data Privacy Office KPI Dashboard in Power BI Work?
The dashboard follows a simple yet powerful workflow.
First, users enter KPI data in a structured Excel file.
Next, Power BI connects to that file and refreshes visuals automatically.
Finally, decision-makers analyze performance using slicers, tables, icons, and charts.
Because of this design, even non-technical users can maintain the dashboard with ease.
What Is the Data Source Used in This Dashboard?
The data source for this dashboard is an Excel file. This approach keeps the solution flexible and user-friendly.
The Excel file contains three structured worksheets:
Input_Actual Sheet
This sheet captures actual KPI performance.
You need to enter:
- KPI Name
- Month (use the first date of the month)
- MTD actual value
- YTD actual value
Click to buy Data Privacy Office KPI Dashboard in Power BI
Input_Target Sheet
This sheet stores KPI targets.
You need to enter:
- KPI Name
- Month (use the first date of the month)
- MTD target value
- YTD target value
KPI Definition Sheet
This sheet defines each KPI clearly.
You need to enter:
- KPI Number
- KPI Group
- KPI Name
- Unit
- Formula
- Definition
- Type (LTB or UTB)
Because of this structure, data remains clean, consistent, and audit-ready.
What Pages Are Available in the Data Privacy Office KPI Dashboard?
This Data Privacy Office KPI Dashboard in Power BI contains three well-structured pages. Each page serves a specific purpose and together they provide a complete performance view.
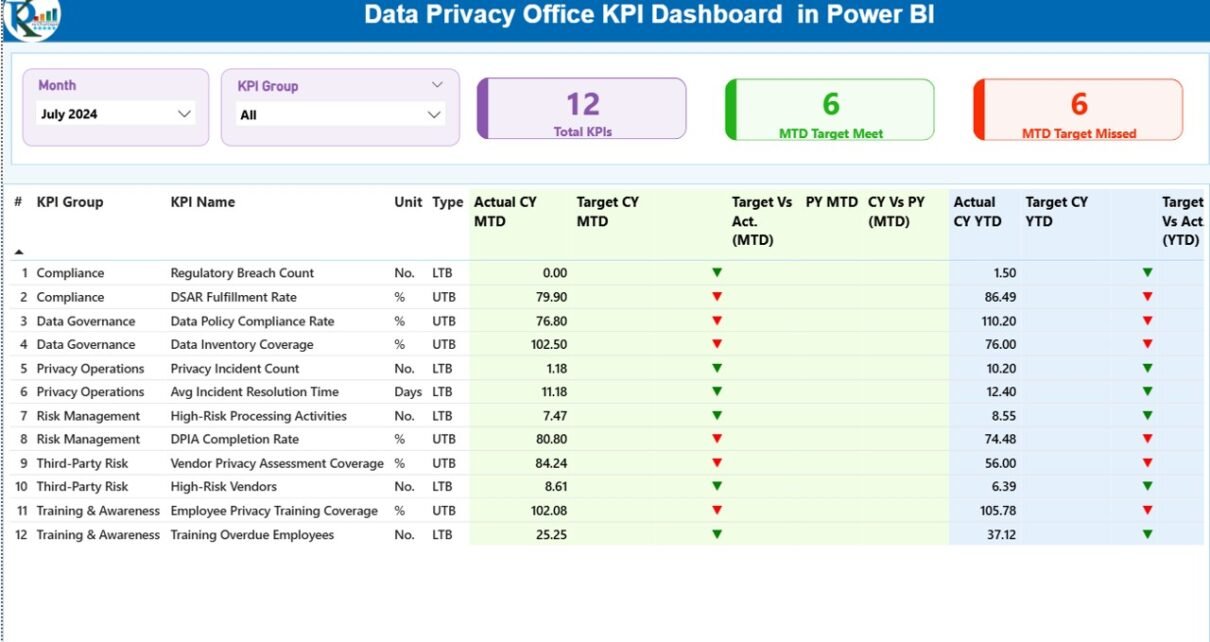
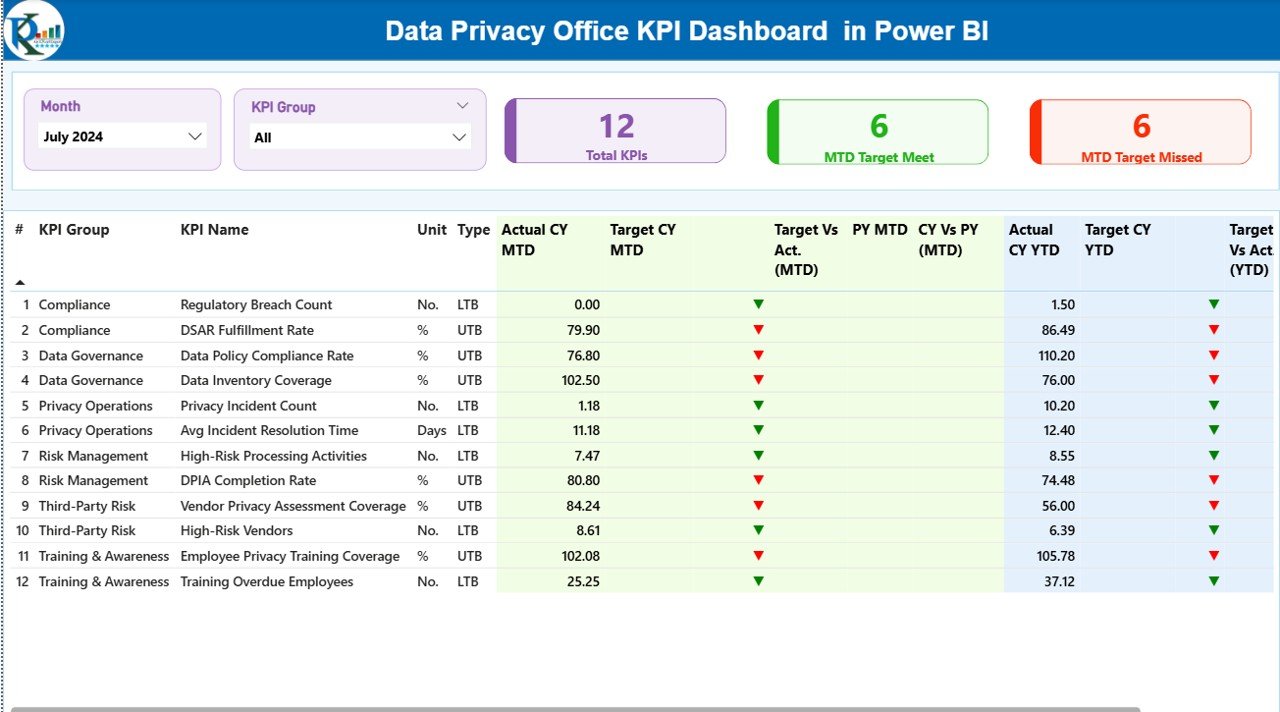
Summary Page Show
The Summary Page acts as the main control center of the dashboard.
Key Elements on the Summary Page
At the top of the page, you will find:
- Month slicer
- KPI Group slicer
These slicers allow users to filter data instantly.
KPI Cards on the Summary Page
The dashboard shows three high-level KPI cards:
- Total KPIs Count
- MTD Target Met Count
- MTD Target Missed Count
These cards provide an immediate snapshot of overall performance.
Detailed KPI Table on the Summary Page
Below the cards, the dashboard displays a detailed KPI table with the following columns:
- KPI Number – Sequence number of the KPI
- KPI Group – Category of the KPI
- KPI Name – Name of the KPI
- Unit – Unit of measurement
- Type – LTB (Lower the Better) or UTB (Upper the Better)
MTD Performance Columns
- Actual CY MTD – Current year MTD actual value
- Target CY MTD – Current year MTD target value
- MTD Icon – ▲ or ▼ icons with green or red color
- Target vs Actual (MTD) – Actual ÷ Target percentage
- PY MTD – Previous year MTD value
- CY vs PY (MTD) – Current MTD ÷ Previous MTD
YTD Performance Columns
- Actual CY YTD – Current year YTD actual value
- Target CY YTD – Current year YTD target value
- YTD Icon – ▲ or ▼ icons with green or red color
- Target vs Actual (YTD) – Actual ÷ Target percentage
- PY YTD – Previous year YTD value
- CY vs PY (YTD) – Current YTD ÷ Previous YTD
Because of this structure, users can identify risks and achievements instantly.
Click to buy Data Privacy Office KPI Dashboard in Power BI
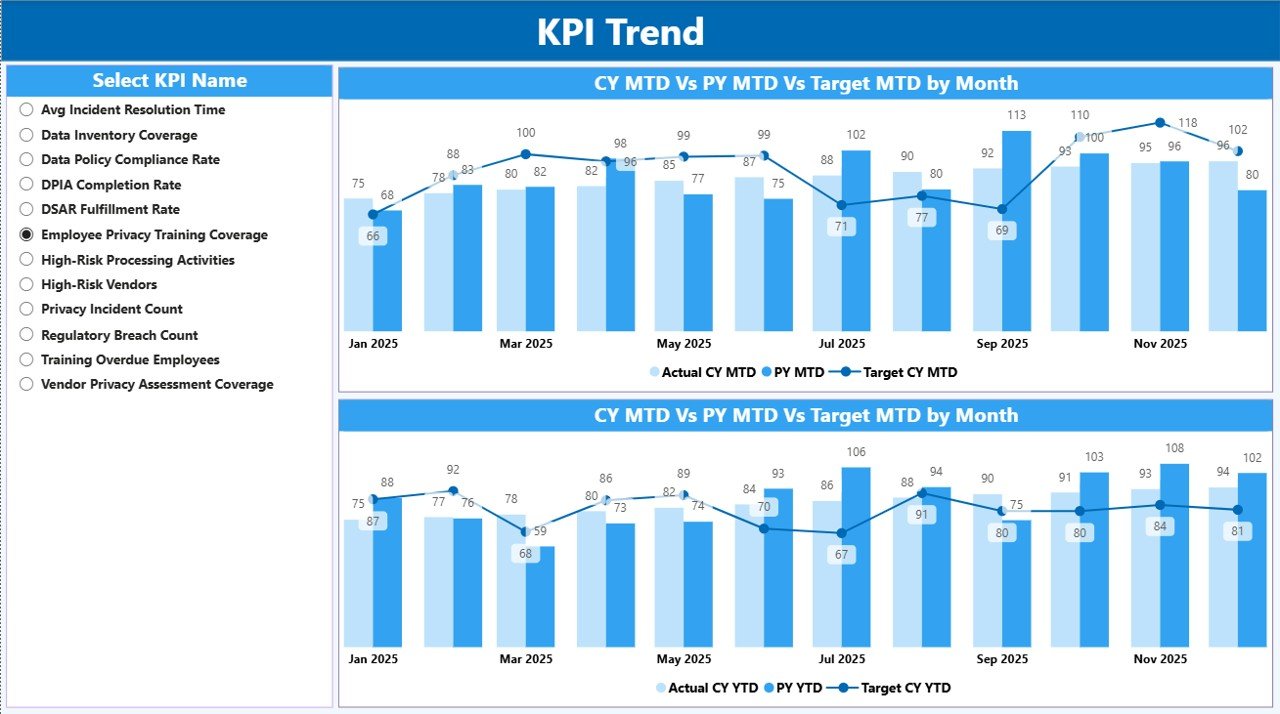
KPI Trend Page
The KPI Trend Page focuses on performance movement over time.
Key Features of the KPI Trend Page
- Two combo charts
- Comparison of Current Year Actual, Previous Year Actual, and Targets
- Separate views for MTD and YTD
KPI Selection Slicer
A slicer on the left side allows users to select a specific KPI. Once selected, the charts update instantly.
As a result, privacy teams can analyze patterns, identify improvement areas, and validate progress.
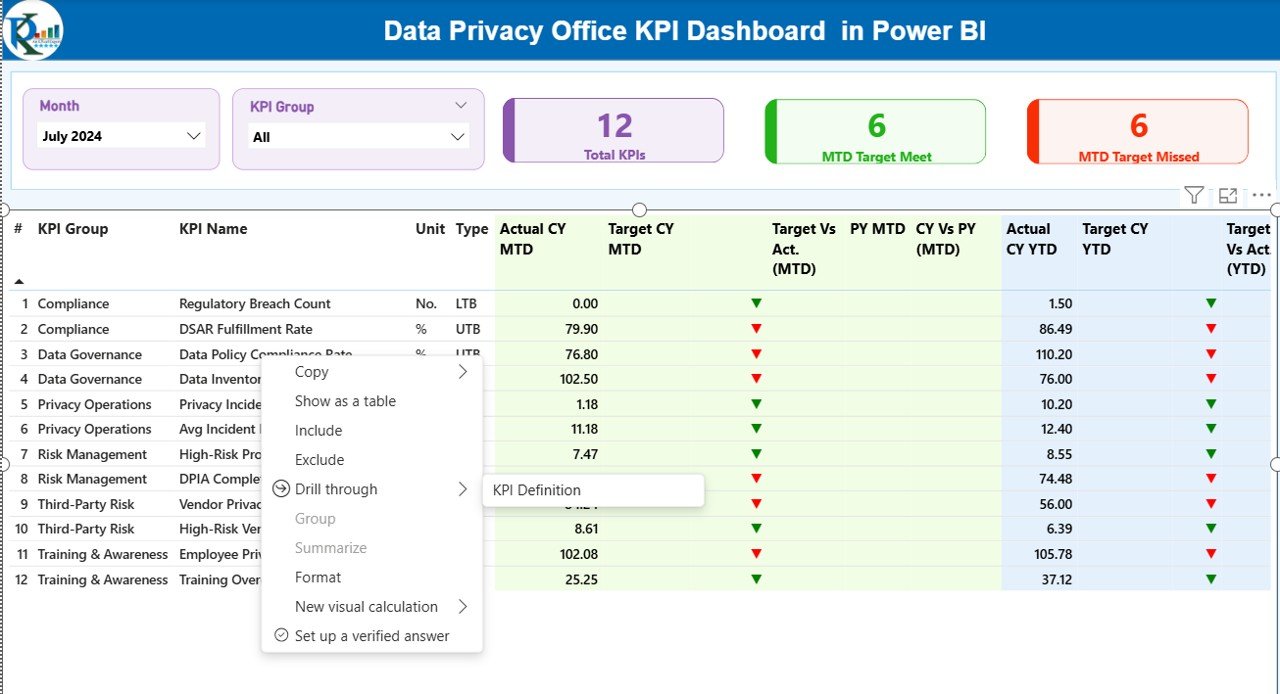
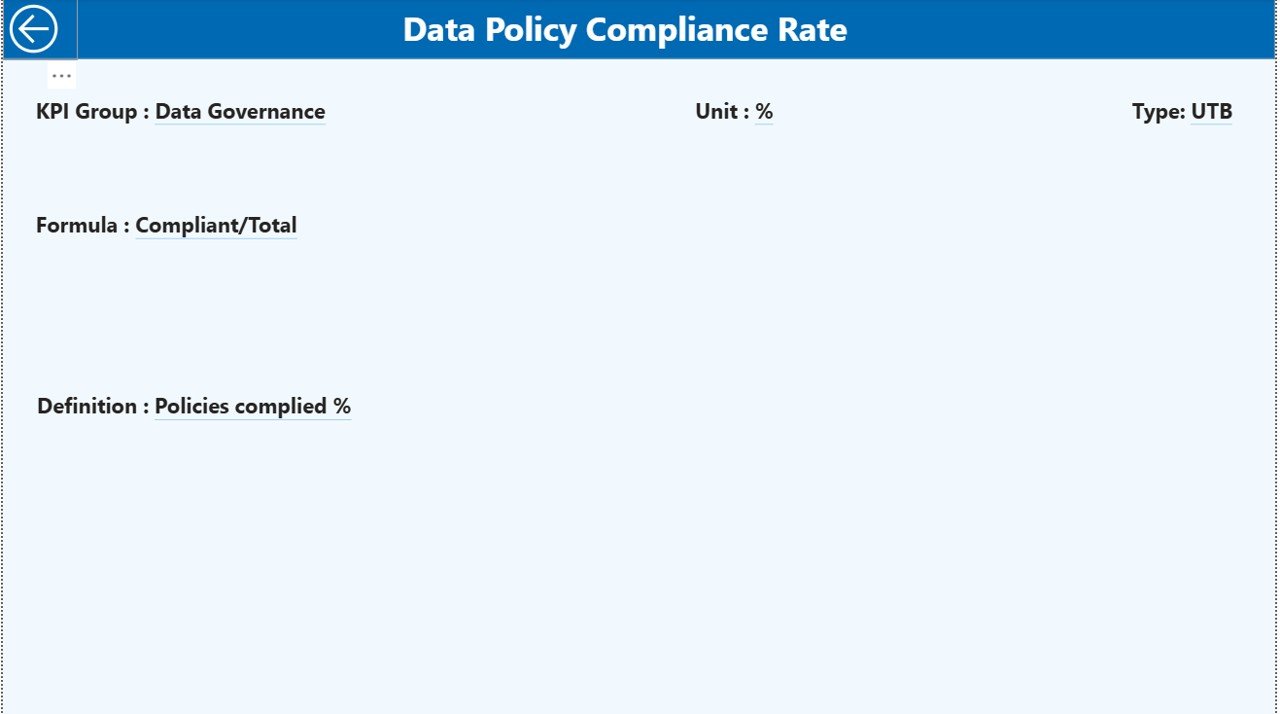
KPI Definition Page
The KPI Definition Page acts as a reference and documentation layer.
Key Characteristics
- Drill-through page
- Hidden from main navigation
- Accessible from the Summary Page
Information Available on This Page
- KPI Formula
- KPI Definition
- KPI Type (LTB or UTB)
This page improves transparency and ensures that everyone interprets KPIs consistently.
How Does Drill-Through Navigation Work?
From the Summary Page, users can drill through to the KPI Definition Page by selecting a KPI.
To return to the main page, users simply click the Back button located at the top-left corner.
Because of this intuitive navigation, users never feel lost while exploring data.
Which KPIs Can a Data Privacy Office Track Using This Dashboard?
A Data Privacy Office KPI Dashboard in Power BI can track a wide range of metrics, such as:
- Data subject request turnaround time
- Privacy incident response time
- Number of open privacy risks
- Compliance audit completion rate
- Training completion percentage
- Policy review adherence
Since the dashboard remains KPI-agnostic, teams can customize it based on regulatory and organizational needs.
Advantages of Data Privacy Office KPI Dashboard in Power BI
A Data Privacy Office KPI Dashboard in Power BI delivers strong operational and strategic value.
Key Advantages
- Centralized visibility of all privacy KPIs
- Real-time performance tracking using MTD and YTD views
- Clear status indicators with icons and colors
- Easy Excel-based data entry without complexity
- Trend analysis for informed decision-making
- Audit-ready structure with KPI definitions
- Improved accountability across teams
Because of these advantages, privacy leaders gain confidence and control.
How Does This Dashboard Support Compliance and Audits?
Compliance audits demand accuracy, clarity, and traceability.
This dashboard supports audits by:
- Showing targets versus actuals clearly
- Maintaining documented KPI definitions
- Comparing current and previous year performance
- Highlighting missed targets early
As a result, organizations reduce audit stress and improve outcomes.
Who Should Use a Data Privacy Office KPI Dashboard?
This dashboard suits multiple roles, including:
- Data Privacy Officers
- Compliance Managers
- Risk and Governance Teams
- Internal Audit Teams
- Senior Management
Because of its clarity and flexibility, both technical and non-technical users benefit.
Best Practices for the Data Privacy Office KPI Dashboard in Power BI
To get maximum value, teams should follow proven best practices.
Best Practices You Should Follow
- Define KPIs clearly before data entry
- Maintain consistent units across periods
- Update Excel data regularly
- Review missed targets weekly
- Use KPI groups logically
- Validate formulas quarterly
- Train users on slicers and drill-throughs
By following these best practices, teams ensure accuracy, reliability, and long-term success.
How Does Power BI Improve Data Privacy Reporting?
Power BI improves privacy reporting because it:
- Converts raw data into visuals
- Enables interactive filtering
- Reduces manual reporting effort
- Improves decision speed
Therefore, privacy teams spend less time compiling reports and more time managing risk.
How Can Organizations Customize This Dashboard?
Organizations can easily customize the dashboard by:
- Adding new KPIs
- Modifying KPI groups
- Updating targets
- Adjusting visuals
- Expanding trend analysis
Since the data source remains Excel-based, customization stays simple and scalable.
Conclusion: Why a Data Privacy Office KPI Dashboard in Power BI Is Essential
Data privacy no longer remains optional. Regulations, customers, and stakeholders expect strong governance and transparency.
A Data Privacy Office KPI Dashboard in Power BI provides a structured, visual, and actionable way to track performance. It replaces manual reporting, improves accountability, and supports confident decision-making.
By adopting this dashboard, organizations transform data privacy management from reactive tracking to proactive control.
Frequently Asked Questions About Data Privacy Office KPI Dashboard in Power BI
What is the main purpose of a Data Privacy KPI Dashboard?
The main purpose is to monitor privacy performance, compliance, and risks using visual and real-time KPIs.
Can non-technical users maintain this dashboard?
Yes, users only need to update structured Excel sheets.
Does the dashboard support MTD and YTD analysis?
Yes, it includes both MTD and YTD views with comparisons.
Can organizations add their own KPIs?
Yes, the dashboard allows full KPI customization.
Is this dashboard suitable for audits?
Yes, it provides clear targets, actuals, trends, and definitions.
Does the dashboard compare previous year performance?
Yes, it includes CY vs PY comparisons for MTD and YTD.
Can this dashboard scale with more KPIs?
Yes, it scales easily by adding new rows in Excel.
Visit our YouTube channel to learn step-by-step video tutorials
Watch the step-by-step video tutorial:
Click to buy Data Privacy Office KPI Dashboard in Power BI