DevOps teams work in a fast-paced environment. They deliver updates, monitor deployments, resolve incidents, and optimize pipelines every day. Because of these continuous activities, teams need reliable insights to move faster and improve efficiency. A DevOps KPI Dashboard in Power BI solves this challenge by displaying all performance indicators in one place. It helps DevOps engineers, project managers, and leaders track trends, monitor targets, and analyze improvements instantly.
In this detailed guide, you will learn what a DevOps KPI Dashboard is, why it matters, how each page works, and how teams can use it to improve delivery speed and stability. You will also explore the advantages, best practices, and frequently asked questions at the end of the article.
Click to Purchases DevOps KPI Dashboard in Power BI
What Is a DevOps KPI Dashboard in Power BI?
A DevOps KPI Dashboard in Power BI is a ready-to-use analytics solution that tracks the key metrics that matter the most in DevOps operations. It brings data from Excel into Power BI and converts raw information into meaningful visuals. You simply select a month, and the dashboard updates all KPIs related to:
-
Deployment frequency
-
Lead time for changes
-
MTTR (Mean Time to Resolve)
-
Release failure rate
-
Automation coverage
-
Resource utilization
-
Cycle time
-
Quality checks
-
Coding productivity metrics
Because DevOps teams handle multiple workflows at the same time, quick access to these insights helps them make faster and more accurate decisions.
Why Do DevOps Teams Need a KPI Dashboard?
DevOps teams deal with constant deployments, bug fixes, and system monitoring. When they track information across multiple spreadsheets, they lose speed. A dashboard brings everything together so teams can focus on what matters.
A DevOps KPI Dashboard helps teams to:
-
Improve deployment stability
-
Track errors, bugs, and issues in real time
-
Compare performance month-over-month
-
Measure automation and coverage
-
Evaluate pipeline efficiency
-
Reduce downtime
-
Improve collaboration between Dev, QA, and Ops
This dashboard saves time, reduces confusion, and increases transparency across the organization.
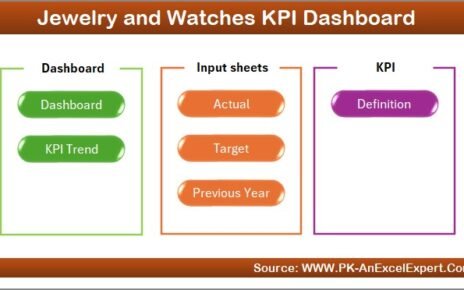
Key Features of the DevOps KPI Dashboard in Power BI
Your DevOps KPI Dashboard comes with three powerful pages. Each page provides insights that help teams track performance clearly and take faster action. Let’s explore each page in detail.
1. Summary Page – The Main Performance View

The Summary Page is the most important part of this dashboard. It provides a complete view of all KPIs in a structured format. It helps users check monthly numbers, target achievements, and year-to-date results instantly.
Key Elements of the Summary Page
✔ Month and KPI Group Slicers
These slicers allow users to filter the information. You simply select a month or KPI group, and the entire page updates instantly.
✔ KPI Cards on the Top
The page displays three important cards:
-
Total KPIs Count – Total number of KPIs tracked.
-
MTD Target Met Count – KPIs that meet their monthly target.
-
MTD Target Missed Count – KPIs that do not meet their target.
These cards help teams scan performance in seconds.
✔ Detailed KPI Table
The table contains every detail for each KPI. Here is what it includes:
-
KPI Number – Unique sequence number.
-
KPI Group – Category of the KPI such as Deployment Metrics, Quality Metrics, Monitoring Metrics, etc.
-
KPI Name – Name of the metric.
-
Unit – Measurement unit like %, Count, Hours, Minutes, or Rate.
-
Type – KPI type (UTB: Upper the Better or LTB: Lower the Better).
✔ Current Year MTD Metrics
-
Actual CY MTD – Current month actual value.
-
Target CY MTD – Target for the current month.
-
MTD Icon – Arrow icon (▲ or ▼) in green or red to indicate performance.
-
Target vs Actual (MTD) – Actual ÷ Target * 100.
-
PY MTD – Last year’s actual value for the same month.
-
CY vs PY (MTD) – Comparison percentage.
These numbers help DevOps teams understand whether their deployment and operations performance moves in the right direction.
✔ Current Year YTD Metrics
-
Actual CY YTD
-
Target CY YTD
-
YTD Icon (▲ / ▼ with color)
-
Target vs Actual (YTD)
-
PY YTD
-
CY vs PY (YTD)
These metrics give a full picture of yearly performance, allowing teams to track progress and fix gaps early.
2. KPI Trend Page – Visual Comparison of Current Year, Previous Year & Targets

The KPI Trend Page helps teams see the movement of KPIs across months. Trend analysis plays a major role in DevOps because it helps identify bottlenecks and improvement opportunities.
What This Page Shows
-
A slicer on the left to select any KPI.
-
A combo chart showing MTD trends – Actuals, Targets, Previous Year.
-
Another combo chart showing YTD trends – Actuals, Targets, Previous Year.
These visuals help teams answer important questions:
-
Is our MTTR improving?
-
Do we deploy faster this year compared to last year?
-
Does the failure rate drop month after month?
-
Are automation efforts moving in the right direction?
Because chart visuals make complex information easy to understand, teams get a clear direction for improvement.
Click to Purchases DevOps KPI Dashboard in Power BI
3. KPI Definition Page – Drill-Through With Complete Clarity

This hidden page contains the full definition of each KPI. Users can drill through from the Summary Page to see:
-
KPI Formula
-
KPI Definitions
-
Group information
-
KPI Type (UTB or LTB)
This page helps new team members understand each KPI quickly. It also ensures everyone follows the same measurement method.
You can return to the main Summary Page by clicking the Back button on the top-left corner.
Excel Data Input Structure for the Dashboard
Your DevOps KPI Dashboard uses an Excel file as its data source. This file contains three sheets:
1. Input_Actual Sheet – Enter Actual Performance Values
Enter:
-
KPI Name
-
Month (first day of month)
-
MTD actuals
-
YTD actuals
This sheet captures real performance numbers like deployment frequency, automation %, or issue resolution time.
2. Input_Target Sheet – Enter Target Values
Enter:
-
KPI Name
-
Month
-
MTD targets
-
YTD targets
These targets help teams check if they meet their monthly and yearly goals.
3. KPI Definition Sheet – Maintain KPI Metadata
Enter:
-
KPI Number
-
KPI Group
-
KPI Name
-
Unit
-
Formula
-
Definition
-
Type (LTB/UTB)
This sheet makes the dashboard dynamic and easy to maintain.
Why a DevOps KPI Dashboard Matters in Modern Organizations
Every DevOps process moves quickly. Teams deploy code daily, monitor issues in real time, and implement updates rapidly. Because everything changes space, they need accurate insights to stay aligned.
A DevOps KPI Dashboard supports:
-
Faster decision-making
-
Better collaboration
-
Improved system stability
-
Real-time monitoring
-
Higher workflow transparency
-
Data-driven improvements
-
Reduced downtime
-
Improved customer experience
When DevOps teams use dashboards, they deliver better results with less effort.
Advantages of a DevOps KPI Dashboard in Power BI
A DevOps KPI Dashboard provides several advantages that help both technical teams and senior leadership. Let’s explore them.
1. Immediate Access to Critical KPIs
Teams do not search multiple files. They view everything in one dashboard.
2. Clear Comparison With Targets
The dashboard compares actual vs target values for both MTD and YTD. This helps teams act quickly when they fall behind.
3. Trend Visibility Across Months
Trend charts reveal problem areas early. Teams improve deployment quality and reduce bottlenecks.
4. Drill-Through to KPI Definitions
The drill-through page ensures clarity and removes confusion across teams.
5. Faster and More Accurate Reporting
Power BI updates the entire dashboard with one click. This saves hours of manual reporting work.
6. Better Alignment Between Dev, QA, and Operations
The dashboard displays the same numbers for everyone, so the entire team stays aligned on goals.
7. Improved Productivity
With clear insights, teams focus on high-priority issues and avoid wasting time.
Best Practices for Using the DevOps KPI Dashboard in Power BI
You can get better results when you apply the right approach. Use the following best practices to maintain accuracy and improve performance.
1. Update Actual and Target Sheets Every Month
Because DevOps performance changes daily, teams must keep the data updated to maintain accuracy.
2. Define KPIs Clearly in the KPI Definition Sheet
Clear definitions help new team members understand the metrics easily.
3. Standardize KPI Groups
Use clear categories like:
-
Deployment Metrics
-
Quality Metrics
-
Incident Metrics
-
Efficiency Metrics
-
Automation Metrics
This increases dashboard clarity.
4. Review Trend Charts Every Month
Trends help identify:
-
Rising deployment failures
-
Delay in resolving incidents
-
Drop in automation coverage
-
Increase in lead time
Teams can fix issues before they grow bigger.
5. Use the Drill-Through Page to Train New Team Members
This page helps improve onboarding and builds clarity across the team.
6. Validate Target Values Before Updating the File
Correct targets improve decision-making.
7. Keep KPI Names Consistent Across All Sheets
Consistency helps in smooth data refresh and reduces errors.
Conclusion
A DevOps KPI Dashboard in Power BI allows DevOps teams to measure performance, reduce downtime, improve deployment quality, and make faster decisions. Because it tracks both MTD and YTD metrics, teams get complete visibility of their operational health. With summary pages, trend charts, and drill-through definitions, this dashboard offers everything teams need to monitor KPIs with confidence.
When teams use this dashboard properly, they reduce bottlenecks, improve collaboration, and strengthen their DevOps culture.
Frequently Asked Questions (FAQs)
1. What is a DevOps KPI Dashboard in Power BI?
It is an analytical dashboard that tracks DevOps performance metrics like deployment frequency, MTTR, failure rate, and automation coverage.
2. Who should use this dashboard?
DevOps engineers, operations managers, QA teams, project managers, and leadership teams use it to track performance and improve efficiency.
3. Do I need advanced skills to update the dashboard?
No. You only fill data in simple Excel sheets. Power BI updates everything automatically.
4. Can I customize the KPIs in the dashboard?
Yes. You can add, remove, or modify KPIs in the KPI Definition Sheet.
5. How often should I update the dashboard?
Teams usually update the dashboard every month, but they can update it weekly if needed.
6. Can I compare performance with last year?
Yes. The dashboard includes PY MTD and PY YTD values for comparison.
7. Does the dashboard support drill-through features?
Yes. You can drill through to see KPI formulas and definitions.
Visit our YouTube channel to learn step-by-step video tutorials