The digital creator economy has grown rapidly in recent years. Content creators now produce videos, podcasts, social media content, digital art, online courses, and live streams across multiple platforms. Many creators also join digital creators guilds or communities that help them collaborate, share resources, and grow their audiences.
However, managing the financial and operational performance of creator guilds can become complicated. Guild administrators must track production costs, revenue streams, platform engagement, sponsorship income, and profit margins. When organizations rely only on spreadsheets or manual reports, it becomes difficult to analyze performance trends and make strategic decisions.
Therefore, many organizations now adopt data-driven dashboards to monitor creator economy metrics.
Click to Purchases Digital Creators Guilds Dashboard in Power BI
One powerful solution is the Digital Creators Guilds Dashboard in Power BI.
The Digital Creators Guilds Dashboard in Power BI is a ready-to-use analytics tool that transforms raw creator economy data into interactive charts, KPI cards, and performance reports. Because Power BI provides strong visualization and filtering capabilities, guild managers can easily monitor revenue performance, production costs, engagement trends, and profitability.
In this detailed guide, we will explore the Digital Creators Guilds Dashboard in Power BI, including its features, structure, benefits, best practices, and frequently asked questions.
What is a Digital Creators Guilds Dashboard in Power BI?
A Digital Creators Guilds Dashboard in Power BI is a business intelligence dashboard designed to monitor the financial and operational performance of digital creator communities or guilds.
Digital creator guilds often manage:
-
Multiple content creators
-
Various content platforms
-
Sponsorship deals
-
Production expenses
-
Advertising revenue
-
Audience engagement metrics
Tracking all these metrics manually becomes difficult. However, Power BI dashboards organize this data into interactive visuals and KPI indicators.
As a result, guild managers can quickly evaluate:
-
Content production costs
-
Platform engagement performance
-
Sponsorship revenue performance
-
Profitability across content types
-
Geographic distribution of costs
Because the dashboard presents insights visually, decision-makers can easily understand complex data.
Why Do Digital Creator Guilds Need Performance Dashboards?
The creator economy generates revenue from many sources. These include advertising revenue, sponsorship partnerships, memberships, and digital product sales.
However, without a structured analytics system, guild managers face several problems.
Common Challenges Faced by Creator Guilds
-
Difficulty tracking production costs across platforms
-
Limited visibility into engagement trends
-
Challenges in measuring profitability of content types
-
Lack of insights into sponsorship revenue performance
-
Difficulty comparing platform performance
Therefore, a Digital Creators Guilds Dashboard in Power BI helps solve these issues.
The dashboard provides centralized analytics, which enables managers to monitor operations efficiently.
Click to Purchases Digital Creators Guilds Dashboard in Power BI
Key Features of Digital Creators Guilds Dashboard in Power BI
This dashboard includes five analytical pages, each designed to analyze specific aspects of creator guild performance.
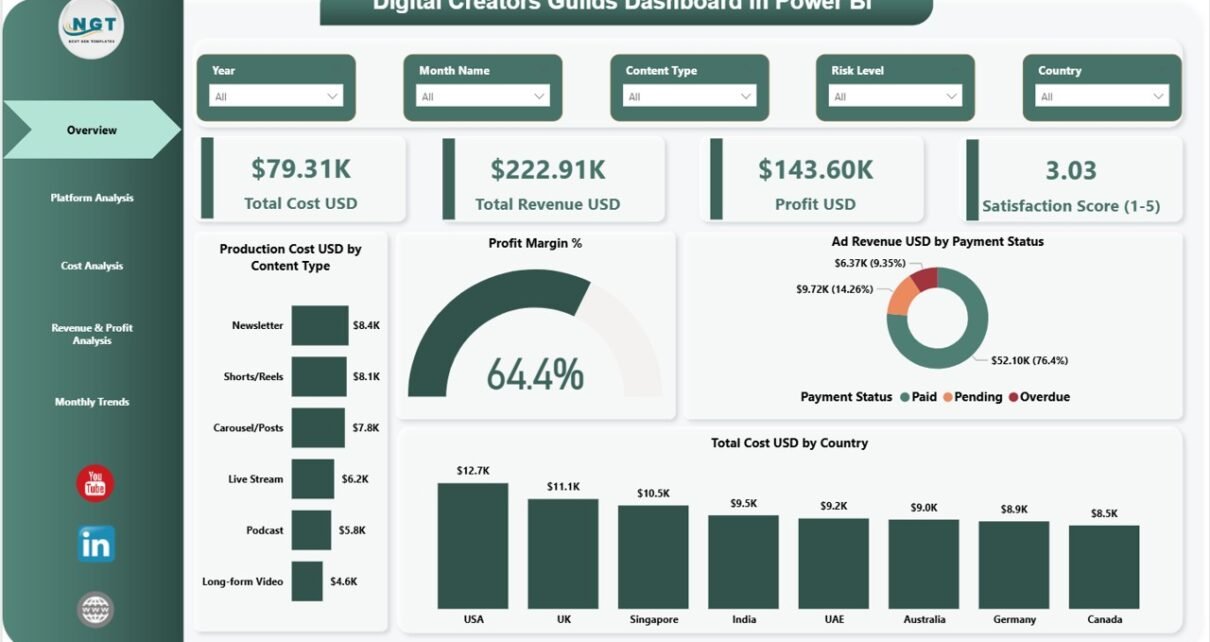
Overview Page – Complete Guild Performance Summary
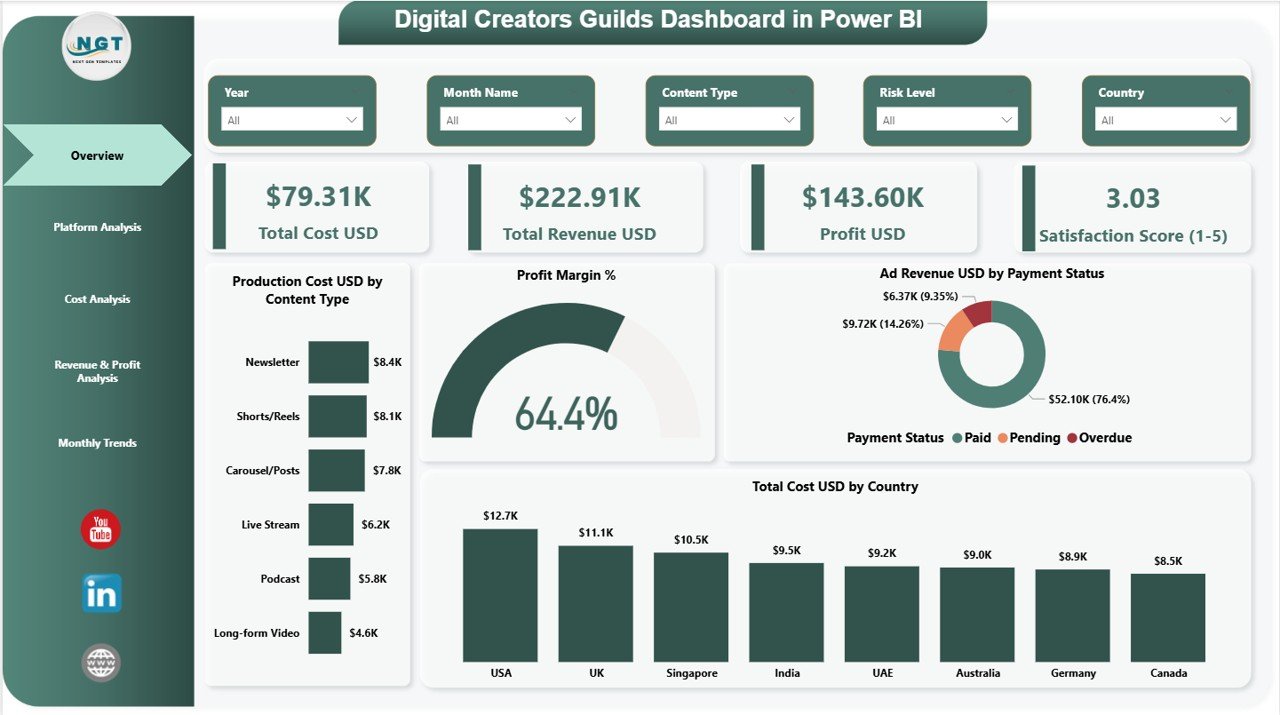
The Overview Page acts as the main dashboard page. It provides a high-level summary of creator guild financial and operational performance.
The page includes slicers that allow users to filter data dynamically.
KPI Cards on the Overview Page
The dashboard shows four important KPI cards.
-
Total Cost (USD)
-
Total Revenue (USD)
-
Profit (USD)
-
Satisfaction Score (1–5)
These KPI cards provide an instant snapshot of guild performance.
Charts Available on the Overview Page
The overview page also includes four analytical charts.
Production Cost USD by Content Type
This chart shows the production cost associated with different content categories.
Examples include:
-
Video production
-
Podcast creation
-
Blog content development
-
Live streaming content
Therefore, guild managers can identify which content type requires higher investment.
Profit Margin %
This chart shows the overall profit margin generated by the creator guild.
Because profit margin reveals financial health, managers can quickly evaluate whether content operations remain profitable.
Ad Revenue USD by Payment Status
This chart tracks advertising revenue based on payment status.
It helps managers identify:
-
Paid advertising revenue
-
Pending payments
-
Delayed payments
As a result, organizations can manage cash flow more effectively.
Total Cost USD by Country
This chart shows the distribution of production costs across different countries.
Therefore, guild managers can analyze geographic cost variations.
Platform Analysis Page – Which Platforms Perform Best?
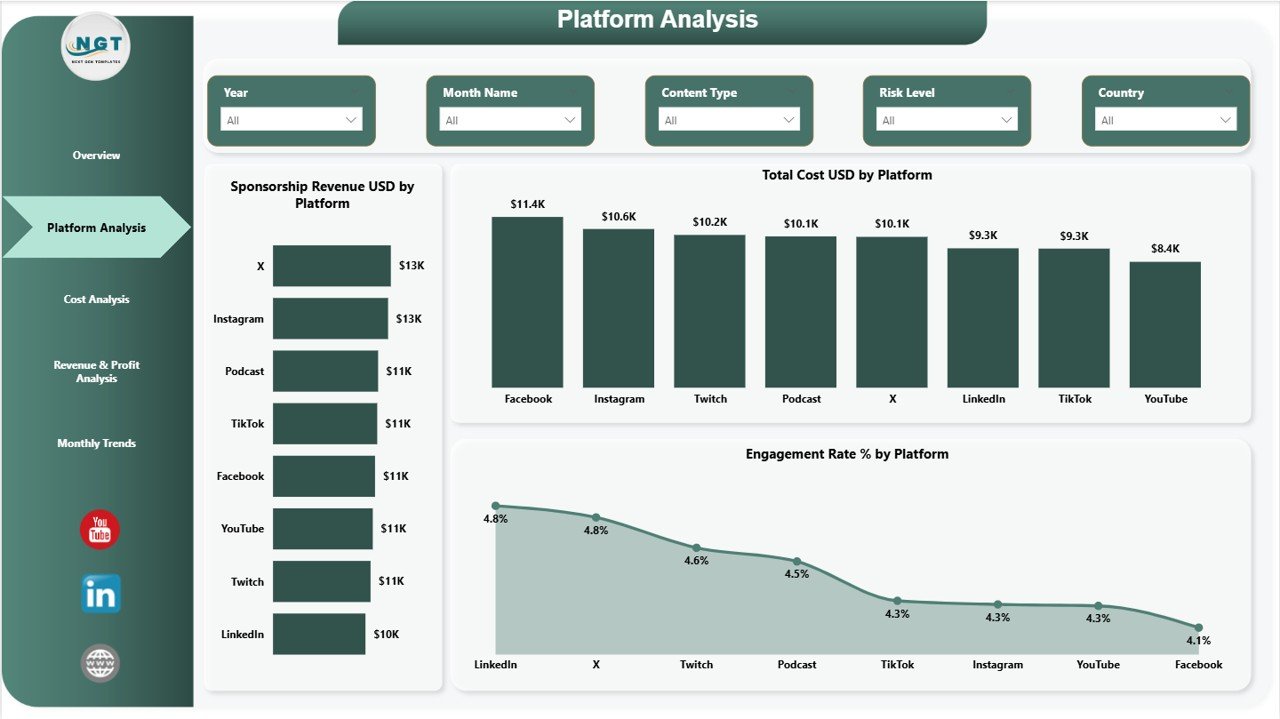
Digital creators usually distribute content across multiple platforms.
For example:
-
YouTube
-
TikTok
-
Instagram
-
Twitch
-
Podcast platforms
The Platform Analysis Page helps managers analyze platform-specific performance.
Charts Included in Platform Analysis
Sponsorship Revenue USD by Platform
This chart shows how much sponsorship revenue each platform generates.
Because sponsorship deals play an important role in creator income, this chart helps identify the most profitable platforms.
Total Cost USD by Platform
This chart analyzes how much money creators spend on producing content for each platform.
Managers can therefore determine whether the cost aligns with revenue.
Engagement Rate % by Platform
Engagement rate represents how audiences interact with content.
The chart helps analyze:
-
Likes
-
Comments
-
Shares
-
Watch time
Consequently, guild managers can identify which platforms deliver the highest audience engagement.
Click to Purchases Digital Creators Guilds Dashboard in Power BI
Cost Analysis Page – Understanding Production Expenses
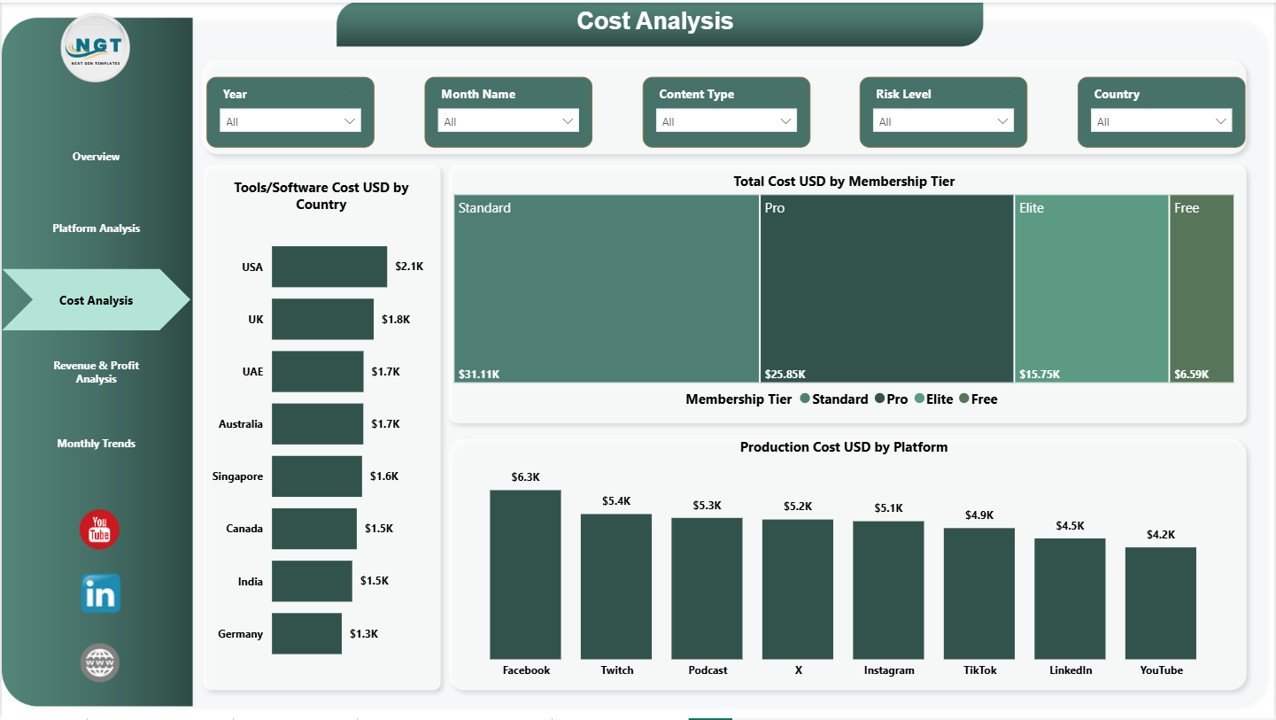
Content production requires various tools, services, and operational expenses.
The Cost Analysis Page focuses on analyzing these costs.
Charts Available on Cost Analysis Page
Tools/Software Cost USD by Country
Content creators often purchase software tools for editing, animation, streaming, and analytics.
This chart helps track software expenses across different countries.
Total Cost USD by Membership Tier
Creator guilds often offer different membership levels.
For example:
-
Basic membership
-
Professional membership
-
Premium creator tier
This chart analyzes operational costs associated with each membership tier.
Production Cost USD by Platform
This chart compares production costs across different platforms.
Managers can therefore identify whether certain platforms require higher production investment.
Revenue & Profit Analysis Page – Measuring Financial Performance
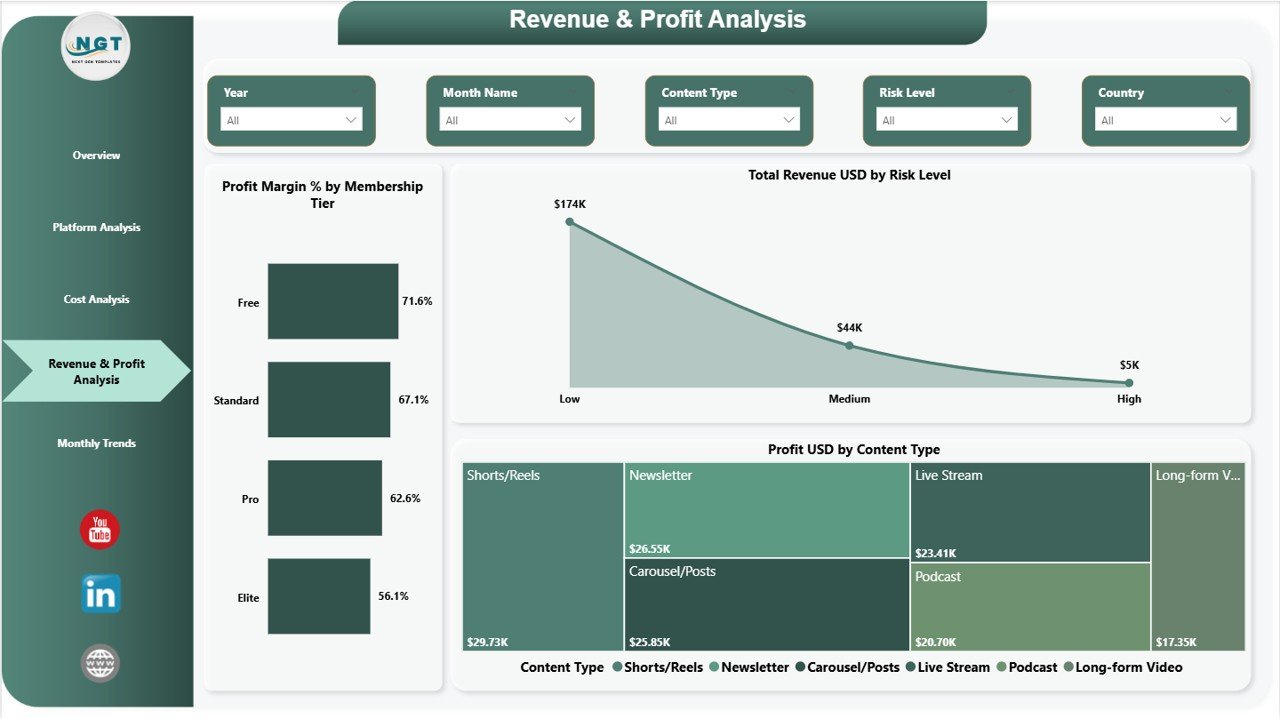
The Revenue & Profit Analysis Page focuses on profitability insights.
This page allows managers to analyze revenue and profit performance across various categories.
Charts Included
Profit Margin % by Membership Tier
This chart shows which membership tiers generate higher profit margins.
Guild managers can therefore evaluate the profitability of different membership levels.
Total Revenue USD by Risk Level
Content creation involves various risk levels.
For example:
-
Low-risk content
-
Medium-risk content
-
High-risk content
This chart analyzes revenue based on risk categories.
Profit USD by Content Type
Different content types generate different profit levels.
This chart helps analyze profitability across content categories.
As a result, guild managers can focus on the most profitable content formats.
Monthly Trends Page – How Performance Changes Over Time
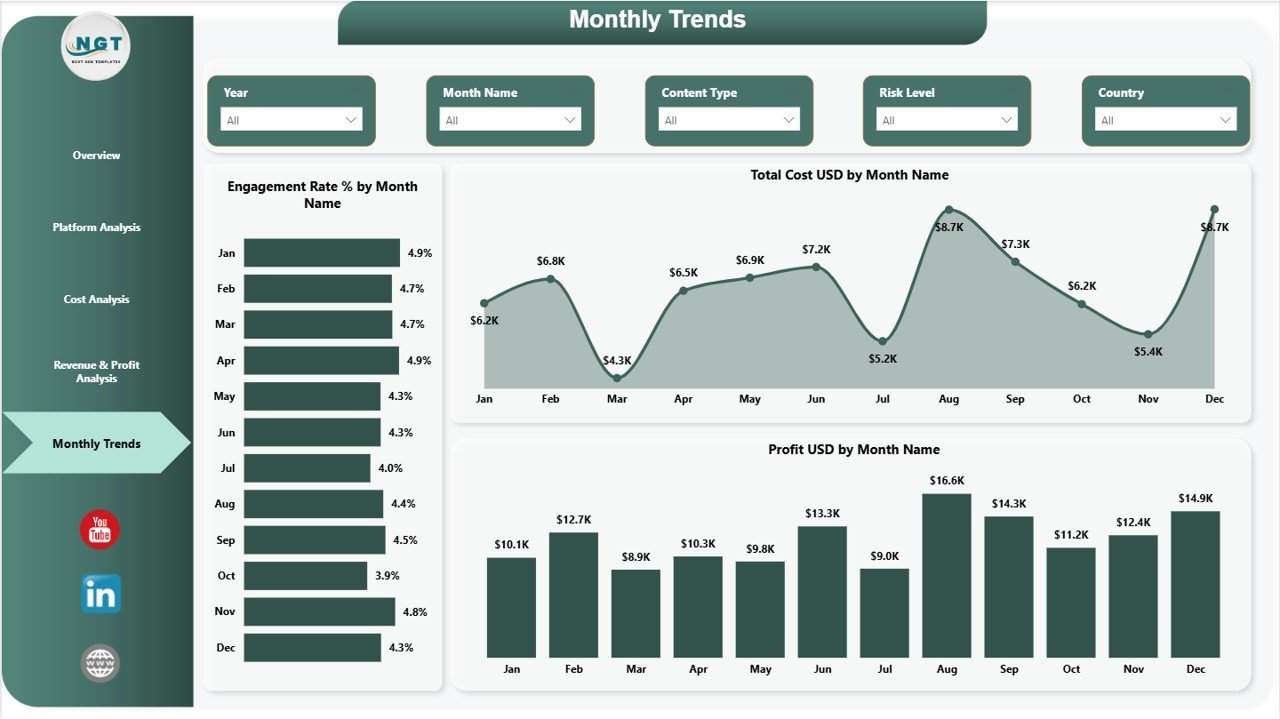
The Monthly Trends Page tracks performance trends across months.
This page helps managers identify seasonal patterns and performance fluctuations.
Charts Available
Engagement Rate % by Month Name
This chart tracks audience engagement trends throughout the year.
Managers can therefore identify which months generate higher engagement.
Total Cost USD by Month Name
This chart shows monthly operational expenses.
Managers can easily track cost fluctuations.
Profit USD by Month Name
This chart analyzes monthly profit performance.
Because of this chart, organizations can evaluate overall financial trends.
Advantages of Digital Creators Guilds Dashboard in Power BI
Organizations benefit significantly from implementing this dashboard.
Better Financial Visibility
Managers can quickly analyze revenue, costs, and profits.
Centralized Performance Monitoring
The dashboard consolidates all important creator economy metrics in one location.
Improved Decision Making
Visual analytics help managers make informed business decisions.
Platform Performance Insights
Guild administrators can identify which platforms perform best.
Better Resource Allocation
Managers can allocate budgets more efficiently.
Improved Creator Collaboration
Guild managers can monitor creator performance and collaboration results.
Opportunities for Improvement in Creator Guild Dashboards
Organizations can further enhance their dashboards by implementing advanced analytics.
Add Real-Time Platform Data
Integration with APIs from platforms like YouTube or Instagram can automate data collection.
Include Audience Demographics
Audience insights can help creators target specific markets.
Add Content Performance Metrics
Metrics such as:
-
Watch time
-
Subscriber growth
-
Content reach
can improve analytics capabilities.
Use Predictive Analytics
Predictive models can forecast engagement trends and revenue growth.
Click to Purchases Digital Creators Guilds Dashboard in Power BI
Best Practices for the Digital Creators Guilds Dashboard
Organizations should follow best practices to maximize dashboard effectiveness.
Define Clear KPIs
Identify the most important performance indicators for creator guild operations.
Ensure Data Accuracy
Maintain consistent data entry and validation processes.
Update Dashboard Regularly
Update the dashboard frequently to maintain accurate analytics.
Use Clear Visualizations
Avoid overly complex visuals that reduce readability.
Align Metrics With Business Goals
Ensure that dashboard KPIs align with guild growth objectives.
How Power BI Helps Digital Creator Guild Analytics
Power BI provides several advantages for creator guild analytics.
Interactive Data Visualization
Power BI transforms complex data into easy-to-understand visuals.
Data Integration
Power BI connects easily with Excel, databases, and APIs.
Advanced Filtering
Users can filter dashboards using slicers and parameters.
Real-Time Analytics
Organizations can analyze real-time performance metrics.
Conclusion
The Digital Creators Guilds Dashboard in Power BI provides a powerful solution for managing the complex data generated by digital creator communities.
Instead of relying on scattered reports and spreadsheets, guild managers can analyze financial performance, engagement metrics, and operational costs using interactive dashboards and analytics tools.
Moreover, the dashboard enables organizations to monitor platform performance, revenue growth, cost distribution, and monthly trends.
Because the creator economy continues to grow rapidly, organizations that adopt data-driven analytics dashboards gain a significant competitive advantage.
Therefore, implementing the Digital Creators Guilds Dashboard in Power BI helps guild administrators optimize operations, improve creator collaboration, and maximize profitability.
Click to Purchases Digital Creators Guilds Dashboard in Power BI
Frequently Asked Questions (FAQs)
What is a Digital Creators Guilds Dashboard?
A Digital Creators Guilds Dashboard is a business intelligence dashboard that monitors performance metrics for digital creator communities.
Why should creator guilds use Power BI?
Power BI offers powerful data visualization, advanced analytics, and interactive dashboards that help organizations monitor creator performance.
What metrics does this dashboard track?
The dashboard tracks:
-
Production costs
-
Advertising revenue
-
Engagement rates
-
Profit margins
-
Monthly performance trends
Can this dashboard be customized?
Yes. Organizations can easily customize the dashboard by adding new metrics, connecting additional data sources, or modifying visuals.
Is Power BI suitable for creator economy analytics?
Yes. Power BI provides strong visualization and analytical tools that help analyze creator economy performance effectively.
Click to Purchases Digital Creators Guilds Dashboard in Power BI
Visit our YouTube channel to learn step-by-step video tutorials