The logistics and freight forwarding industry has transformed rapidly in the digital era. Global trade grows every year, and freight companies now manage thousands of shipments across countries, ports, and transportation modes. However, managing this volume of operational and financial data becomes difficult when companies rely on manual reports or scattered spreadsheets.
Because freight operations involve shipment tracking, customer segments, cost structures, duties, and margins, businesses need a smarter way to analyze data and monitor performance.
Therefore, many logistics companies now use Power BI dashboards to transform raw freight data into powerful insights.
One of the most effective solutions for logistics analytics is the Digital Freight Forwarders Dashboard in Power BI. This dashboard helps freight companies track shipments, analyze costs, monitor delivery performance, and evaluate customer profitability in one centralized analytical system.
In this article, you will learn everything about the Digital Freight Forwarders Dashboard in Power BI, including its features, structure, advantages, best practices, and frequently asked questions.
Click to buy Digital Freight Forwarders Dashboard in Power BI
What Is a Digital Freight Forwarders Dashboard in Power BI?
A Digital Freight Forwarders Dashboard in Power BI is an interactive business intelligence report built using Microsoft Power BI that helps logistics companies monitor and analyze freight operations.
This dashboard collects shipment data such as:
- Shipment ID
- Origin country
- Destination country
- Customer segment
- Shipment mode
- Freight charges
- Duty tax
- Total shipment cost
- Delivery status
- Priority surcharge
- Gross margin
After collecting this data, the dashboard converts it into visual insights through charts, KPIs, and filters.
As a result, logistics managers can quickly understand freight performance, identify delays, monitor costs, and evaluate profit margins.
Instead of spending hours analyzing spreadsheets, decision-makers can instantly explore logistics insights using a single interactive dashboard.
Why Do Freight Forwarding Companies Need Data Dashboards?
Freight forwarding involves multiple operational layers. Companies must track shipments across air, sea, road, and rail while also managing customers, duties, surcharges, and delivery timelines.
However, traditional reporting methods create several problems.
For example:
- Data remains scattered across different systems
- Managers struggle to track shipment delays
- Cost analysis becomes time-consuming
- Profit margins become unclear
- Customer performance becomes difficult to evaluate
Therefore, organizations increasingly adopt Power BI dashboards for freight analytics.
With a digital freight dashboard, logistics teams can:
- Monitor shipments in real time
- Identify operational bottlenecks
- Analyze profitability by shipment type
- Track cost structures
- Improve delivery performance
Consequently, businesses gain faster insights and make better decisions.
Key Features of the Digital Freight Forwarders Dashboard in Power BI
This Digital Freight Forwarders Dashboard in Power BI contains five interactive analytical pages, each designed to monitor different aspects of freight operations.
Each page provides focused insights so managers can explore logistics performance from multiple perspectives.
Let us explore each page in detail.
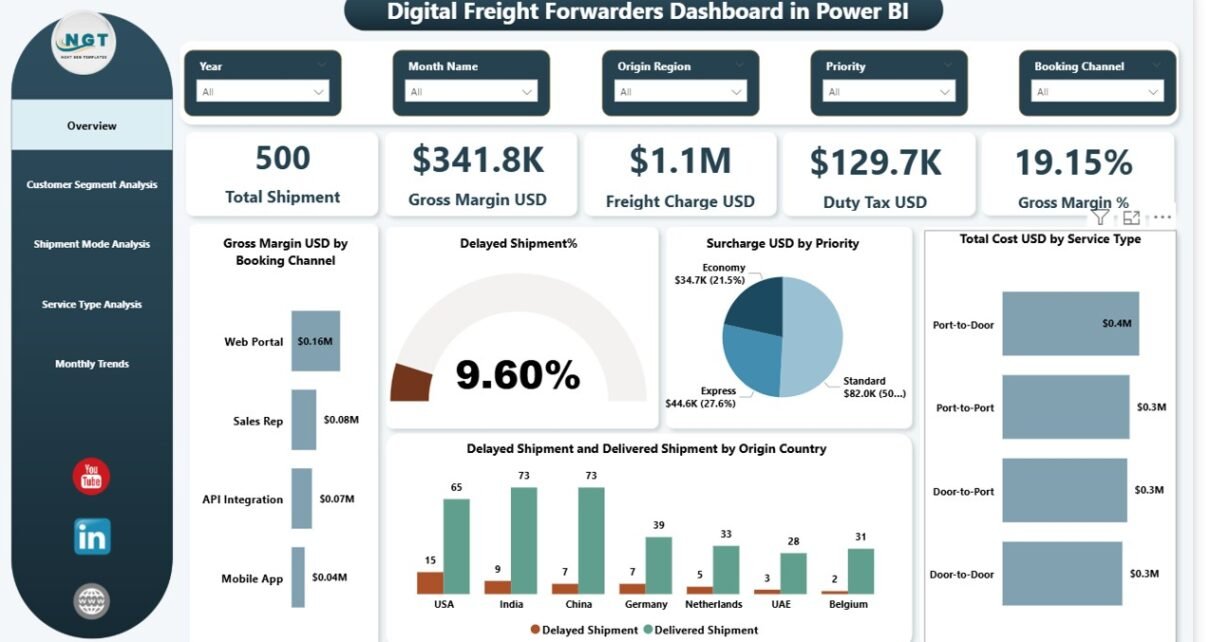
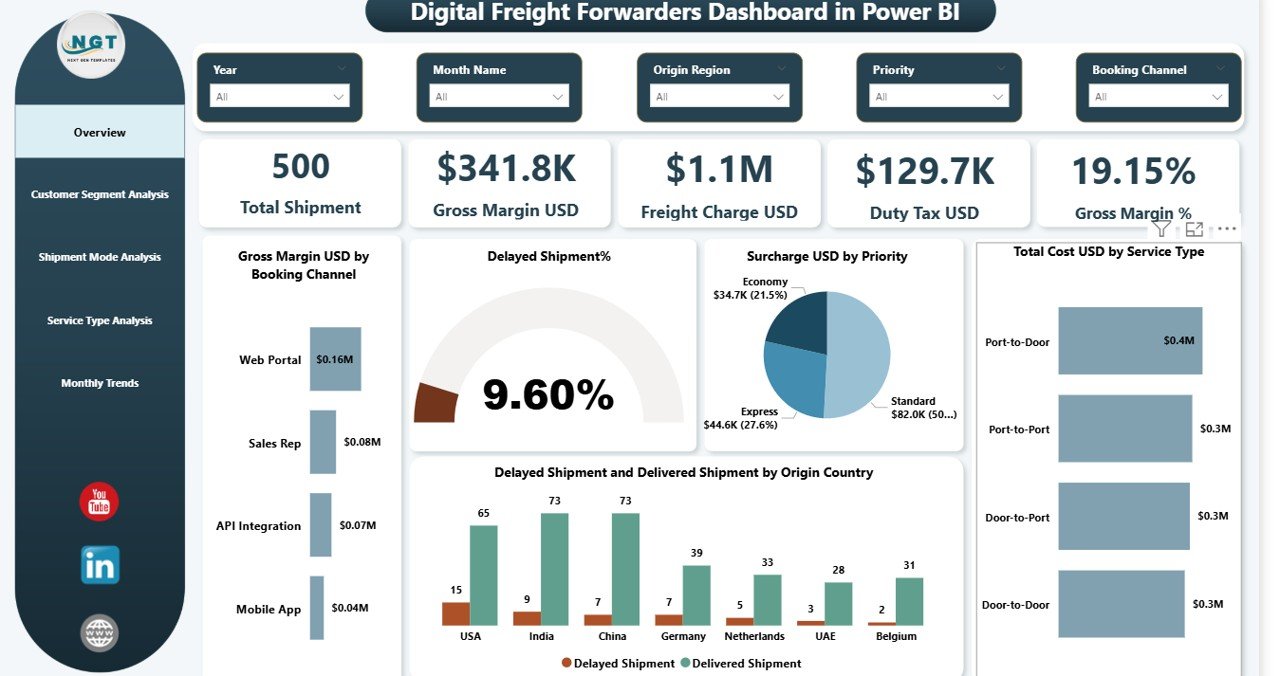
Overview Page – Freight Performance at a Glance
The Overview Page works as the central hub of the dashboard. It provides a high-level summary of freight performance and shipment activity.
Additionally, this page includes interactive slicers, allowing users to filter the dashboard based on various conditions such as time, shipment type, or location.
KPI Cards
The dashboard displays five key performance indicators:
- Total Shipment – Total number of shipments processed
- Gross Margin (USD) – Overall profit generated from freight operations
- Freight Charge (USD) – Total freight charges collected
- Duty Tax (USD) – Total duty and tax associated with shipments
- Gross Margin % – Profit margin percentage
Because these KPIs appear at the top of the dashboard, users quickly understand business performance.
Analytical Charts
The overview page also includes five analytical charts:
- Gross Margin USD by Booking Channel
Helps analyze which booking channels generate the highest profit. - Delayed Shipment %
Displays the percentage of shipments delivered late. - Surcharge USD by Priority
Shows additional surcharges collected based on shipment priority. - Total Cost USD by Service Type
Helps understand cost distribution across services. - Delayed Shipment and Delivery Shipment by Origin Country
Identifies which origin countries face the highest delays.
Because this page combines financial and operational insights, managers quickly evaluate logistics performance.
Click to buy Digital Freight Forwarders Dashboard in Power BI
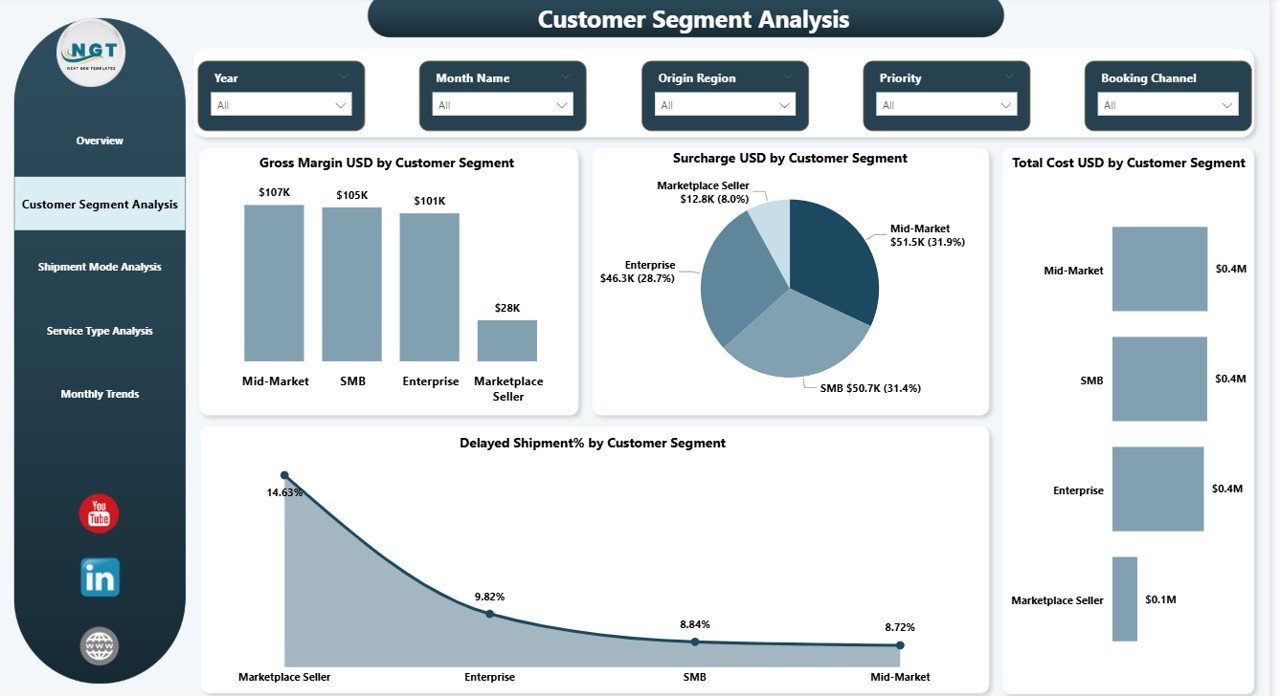
Customer Segment Analysis – Understanding Customer Profitability
Freight forwarding companies serve multiple customer segments such as:
- Corporate clients
- SMEs
- E-commerce businesses
- Retail exporters
However, each segment generates different costs and margins.
Therefore, the Customer Segment Analysis page focuses on customer-level profitability.
Charts Included
This page includes four key analytical charts:
- Gross Margin USD by Customer Segment
Shows which customer groups generate the highest profit. - Surcharge USD by Customer Segment
Identifies surcharge distribution across customers. - Total Cost USD by Customer Segment
Helps analyze operational expenses for each segment. - Delayed Shipment % by Customer Segment
Highlights delivery performance by customer category.
Because this analysis reveals customer profitability patterns, businesses can optimize pricing and service strategies.
Click to buy Digital Freight Forwarders Dashboard in Power BI
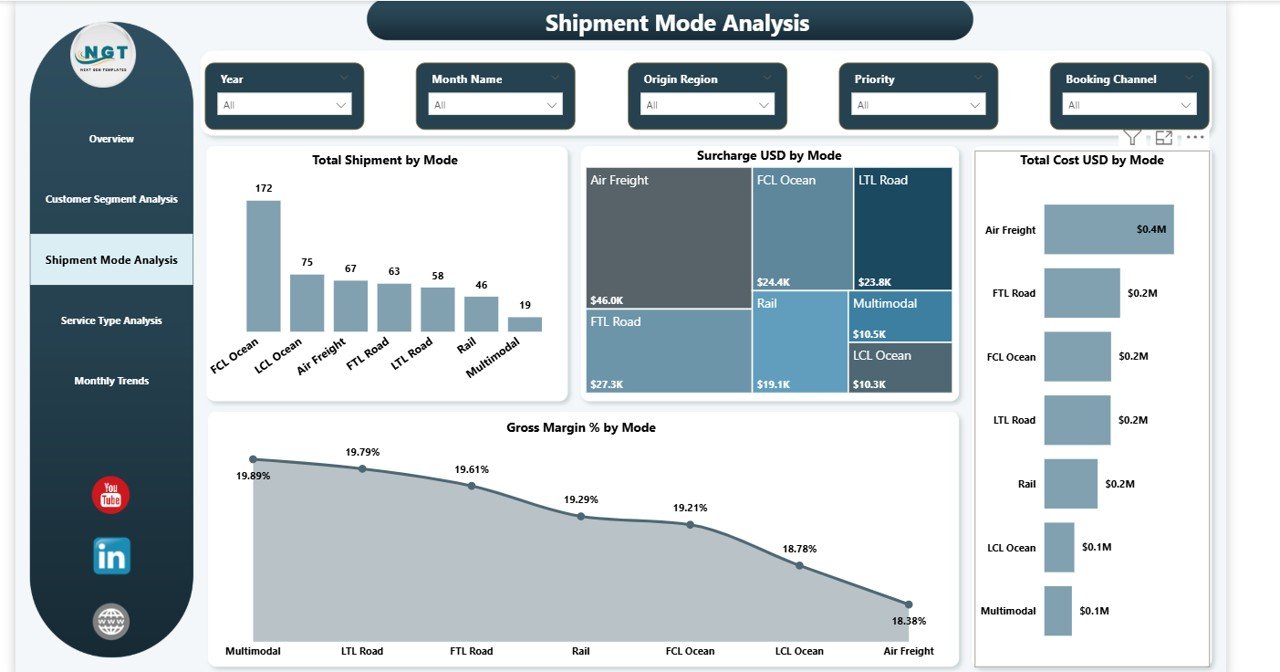
Shipment Mode Analysis – Evaluating Transportation Modes
Freight forwarding involves multiple shipping modes, including:
- Air freight
- Sea freight
- Road freight
- Rail freight
Each transportation mode affects delivery time, cost, and profit margins.
Therefore, the Shipment Mode Analysis page helps organizations evaluate performance by shipping mode.
Charts Included
This page includes four analytical charts:
- Total Shipment by Mode
Displays shipment distribution across transportation modes. - Surcharge USD by Mode
Shows extra charges applied for each shipping method. - Total Cost USD by Mode
Helps understand operational costs associated with each mode. - Gross Margin % by Mode
Identifies the most profitable transportation method.
As a result, logistics managers can optimize route planning and shipment strategy.
Click to buy Digital Freight Forwarders Dashboard in Power BI
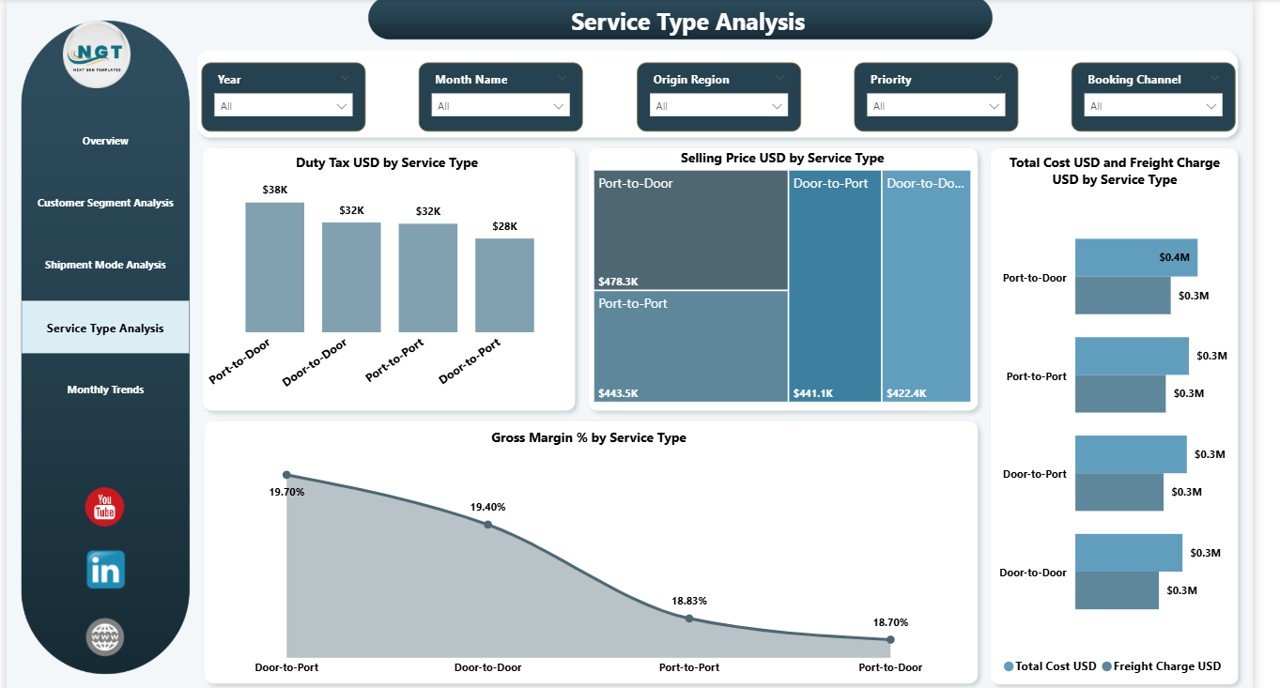
Service Type Analysis – Measuring Service Efficiency
Freight companies provide different service types, such as:
- Express freight
- Standard freight
- Economy shipping
- Priority cargo services
Each service type involves different costs, pricing structures, and margins.
Therefore, the Service Type Analysis page focuses on evaluating service performance.
Charts Included
This page contains four key charts:
- Duty Tax USD by Service Type
Displays the duty and tax values across services. - Selling Price USD by Service Type
Shows revenue generated from each service category. - Total Cost USD and Freight Charge USD by Service Type
Compares operational costs with freight charges. - Gross Margin % by Service Type
Identifies which services generate the highest profit.
Because this analysis reveals service efficiency, companies can improve pricing and cost strategies.
Click to buy Digital Freight Forwarders Dashboard in Power BI
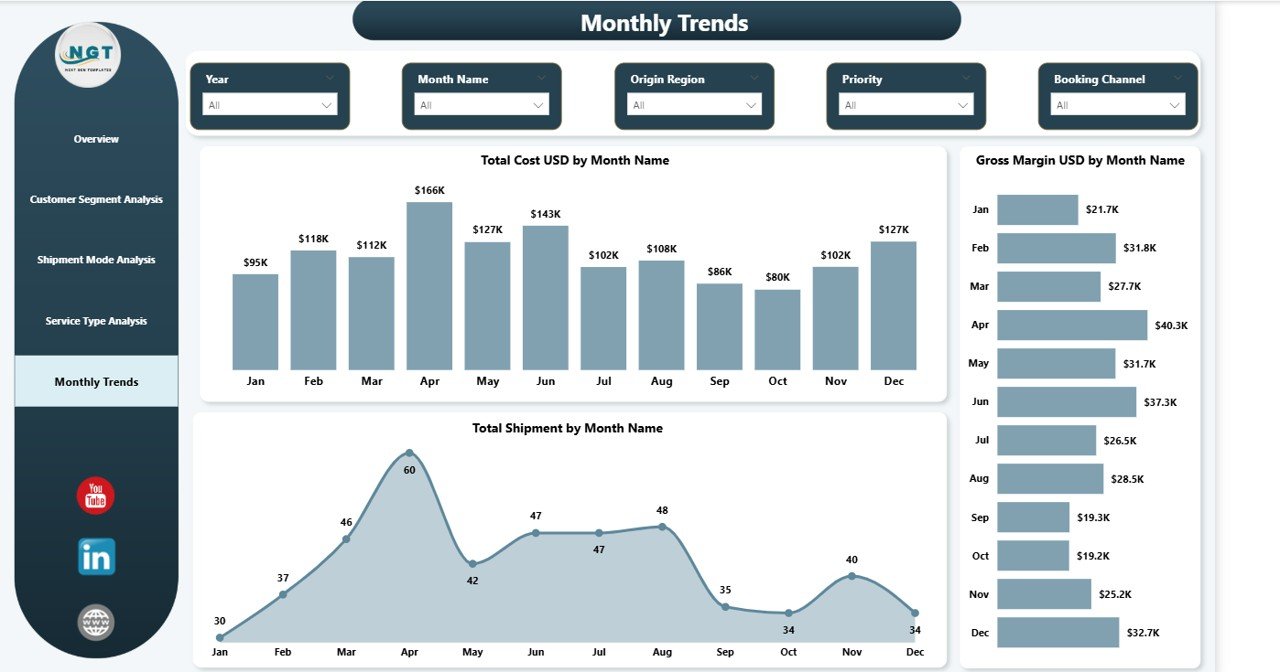
Month Analysis – Tracking Freight Trends Over Time
Freight demand often changes across months due to:
- Seasonal trade patterns
- Global market demand
- Supply chain disruptions
- Holiday logistics spikes
Therefore, the Month Analysis page helps managers monitor monthly freight trends.
Charts Included
This page includes three charts:
- Total Cost USD by Month Name
Displays how logistics costs change throughout the year. - Gross Margin USD by Month Name
Shows profit fluctuations across months. - Total Shipment by Month Name
Tracks shipment volume trends.
Because this page highlights seasonal patterns, companies can plan resources more effectively.
Click to buy Digital Freight Forwarders Dashboard in Power BI
Advantages of the Digital Freight Forwarders Dashboard in Power BI
Implementing a Power BI freight dashboard provides several advantages for logistics companies.
- Centralized Freight Analytics
The dashboard combines shipment, financial, and operational data in one place. Therefore, managers no longer need to review multiple reports.
- Real-Time Performance Monitoring
Power BI dashboards update automatically when new data arrives. As a result, decision-makers always see the latest information.
- Better Shipment Tracking
Managers can easily identify delayed shipments and investigate operational issues.
- Profitability Insights
The dashboard highlights gross margins, surcharges, and freight charges. Consequently, businesses clearly understand profitability.
- Improved Decision Making
Because the dashboard visualizes complex data, executives make faster and smarter decisions.
- Customer Performance Insights
Customer segment analysis helps companies identify their most valuable clients.
- Operational Efficiency
Logistics teams can quickly detect inefficiencies in shipment modes, services, and cost structures.
Best Practices for the Digital Freight Forwarders Dashboard in Power BI
To get the most value from a freight analytics dashboard, companies should follow several best practices.
- Use Clean and Structured Data
Always maintain structured shipment data. Clean data improves dashboard accuracy.
- Automate Data Integration
Connect the dashboard with logistics systems or databases. Automation reduces manual work.
- Track Key Logistics KPIs
Focus on important metrics such as:
- Shipment volume
- Freight charges
- Duty tax
- Delivery delays
- Gross margins
- Use Interactive Filters
Add slicers for:
- Month
- Shipment mode
- Customer segment
- Service type
These filters help users explore data easily.
- Monitor Delivery Performance
Always track delayed shipments and delivery trends. Early insights help prevent operational issues.
- Optimize Visual Design
Use clear charts and minimal colors. Simple dashboards improve user experience.
- Train Your Team
Ensure logistics teams understand how to use Power BI dashboards. Proper training increases adoption.
Who Can Benefit from a Digital Freight Forwarders Dashboard?
Many professionals in the logistics industry benefit from this dashboard.
Logistics Managers
They monitor shipment performance and delivery timelines.
Freight Forwarding Companies
They track revenue, cost structures, and operational efficiency.
Supply Chain Managers
They analyze shipment flows and transportation performance.
Finance Teams
They evaluate freight charges, margins, and duty tax expenses.
Business Executives
They gain strategic insights into logistics performance.
Why Power BI Is Ideal for Freight Analytics
Power BI has become one of the most popular business intelligence tools because it offers powerful data visualization capabilities.
Some important benefits include:
- Interactive dashboards
- Real-time data integration
- Custom KPI tracking
- Easy sharing across teams
- Advanced analytics capabilities
Because of these features, Power BI works perfectly for logistics and freight analytics.
Conclusion
The logistics industry operates in a highly dynamic and competitive environment. Freight forwarding companies must track shipments, control costs, monitor delivery performance, and maintain profitability.
However, manual reporting methods often limit operational visibility.
Therefore, the Digital Freight Forwarders Dashboard in Power BI provides a powerful solution for modern freight analytics.
This dashboard centralizes logistics data and transforms it into clear visual insights through interactive charts, KPIs, and filters.
As a result, logistics managers can:
- Monitor shipment performance
- Identify delays quickly
- Evaluate customer profitability
- Analyze service efficiency
- Improve operational decision-making
Consequently, companies gain better control over freight operations and enhance supply chain performance.
Organizations that adopt data-driven dashboards will continue to gain a competitive advantage in the evolving logistics landscape.
Frequently Asked Questions (FAQs)
What is a freight forwarding dashboard?
A freight forwarding dashboard is a visual analytics system that tracks shipment operations, freight charges, delivery performance, and logistics costs using interactive charts and KPIs.
Why should logistics companies use Power BI dashboards?
Power BI dashboards help logistics companies visualize freight data, monitor shipments, analyze profitability, and improve decision-making.
What KPIs are included in a freight forwarding dashboard?
Common KPIs include:
- Total shipments
- Freight charges
- Duty tax
- Gross margin
- Shipment delays
Can small logistics companies use Power BI dashboards?
Yes. Power BI works for both small and large logistics businesses. Even small freight companies can use dashboards to analyze shipment data.
How does a Power BI dashboard improve logistics performance?
A Power BI dashboard provides real-time insights into shipment operations, costs, and delivery performance. As a result, businesses can quickly identify issues and optimize logistics strategies.
Click to buy Digital Freight Forwarders Dashboard in Power BI
Visit our YouTube channel to learn step-by-step video tutorials
Watch the step-by-step video tutorial: