In today’s digital-first world, businesses depend heavily on measurable results to evaluate their marketing performance. Digital campaigns spread across channels like SEO, social media, email marketing, and paid ads generate a massive amount of data. However, without a structured system, this data often turns into noise instead of actionable insights.
This is where a Digital Marketing KPI Scorecard in Excel comes in. A scorecard is more than a data tracker—it’s a strategic tool that helps you monitor the effectiveness of your campaigns, align marketing efforts with business goals, and make informed decisions.
In this article, we will explore everything you need to know about a Digital Marketing KPI Scorecard in Excel. From structure and key features to advantages, best practices, and FAQs, you’ll gain complete clarity on how to use this tool effectively.
Click to Purchases Digital Marketing KPI Scorecard in excel
What Is a Digital Marketing KPI Scorecard in Excel?
A Digital Marketing KPI Scorecard is a structured Excel-based template designed to track and evaluate marketing performance. Unlike raw spreadsheets, it provides a well-organized interface that compares Actual vs Target values for each KPI, highlights trends, and visualizes progress with charts and indicators.
It enables marketers and business owners to:
-
Measure the impact of campaigns.
-
Identify areas that need improvement.
-
Align marketing activities with strategic goals.
-
Present results in a simple, visual, and professional way.
With Excel’s flexibility, this scorecard becomes a reliable performance management tool without requiring expensive software or complicated dashboards.
Structure of the Digital Marketing KPI Scorecard
This template is built with four dedicated worksheet tabs, each serving a unique purpose. Let’s walk through them in detail.
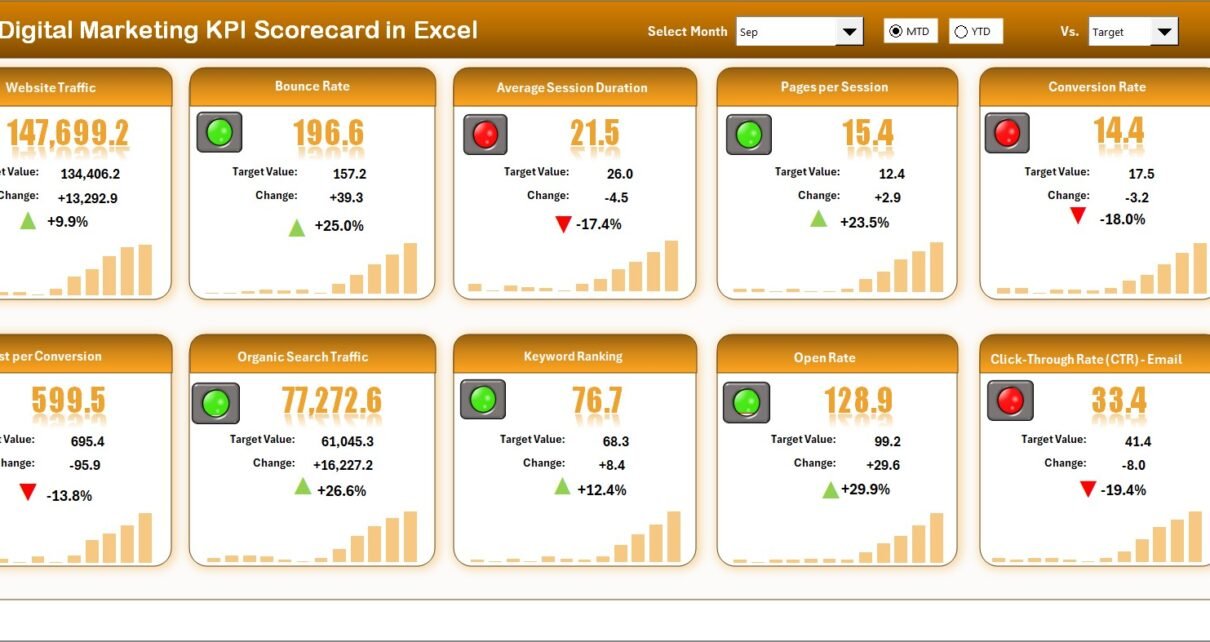
1. Scorecard Sheet
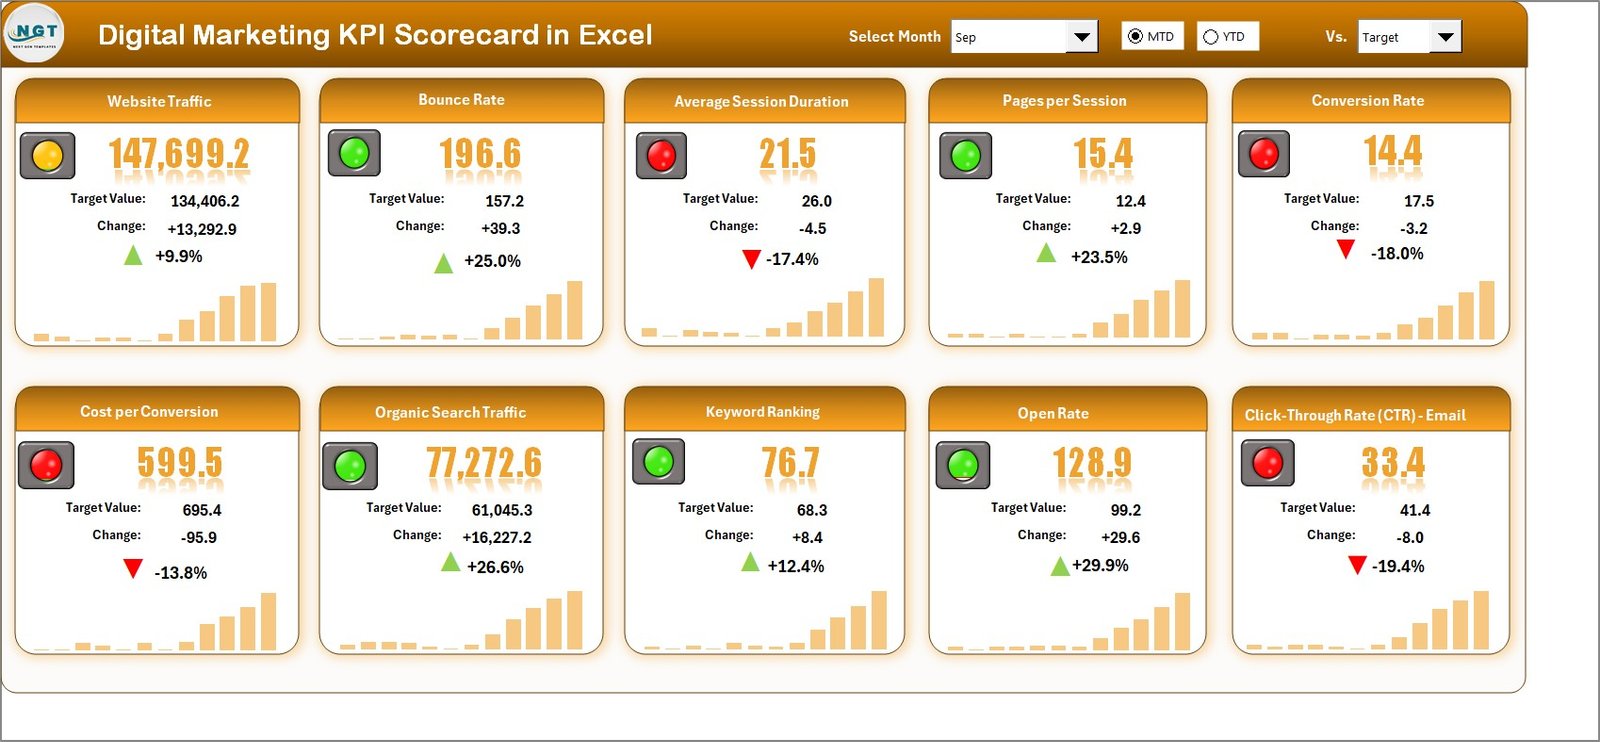
The Scorecard Sheet is the main interface of the template where you can view KPI performance at a glance.
Key features include:
-
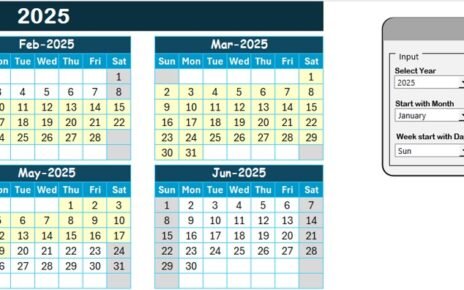
✅ Dropdown Menus – Select the time frame: Month, MTD (Month-to-Date), or YTD (Year-to-Date) for performance analysis.
-
✅ Actual vs Target Comparison – See how each KPI is performing against its set targets.
-
✅ Visual Indicators – Color-coded visuals or conditional formatting help you quickly assess whether results are on track.
-
✅ Comprehensive KPI Overview – Display essential details like KPI name, group, and performance status with both MTD and YTD views.
This sheet works as the executive dashboard of your marketing performance.
2. KPI Trend Sheet
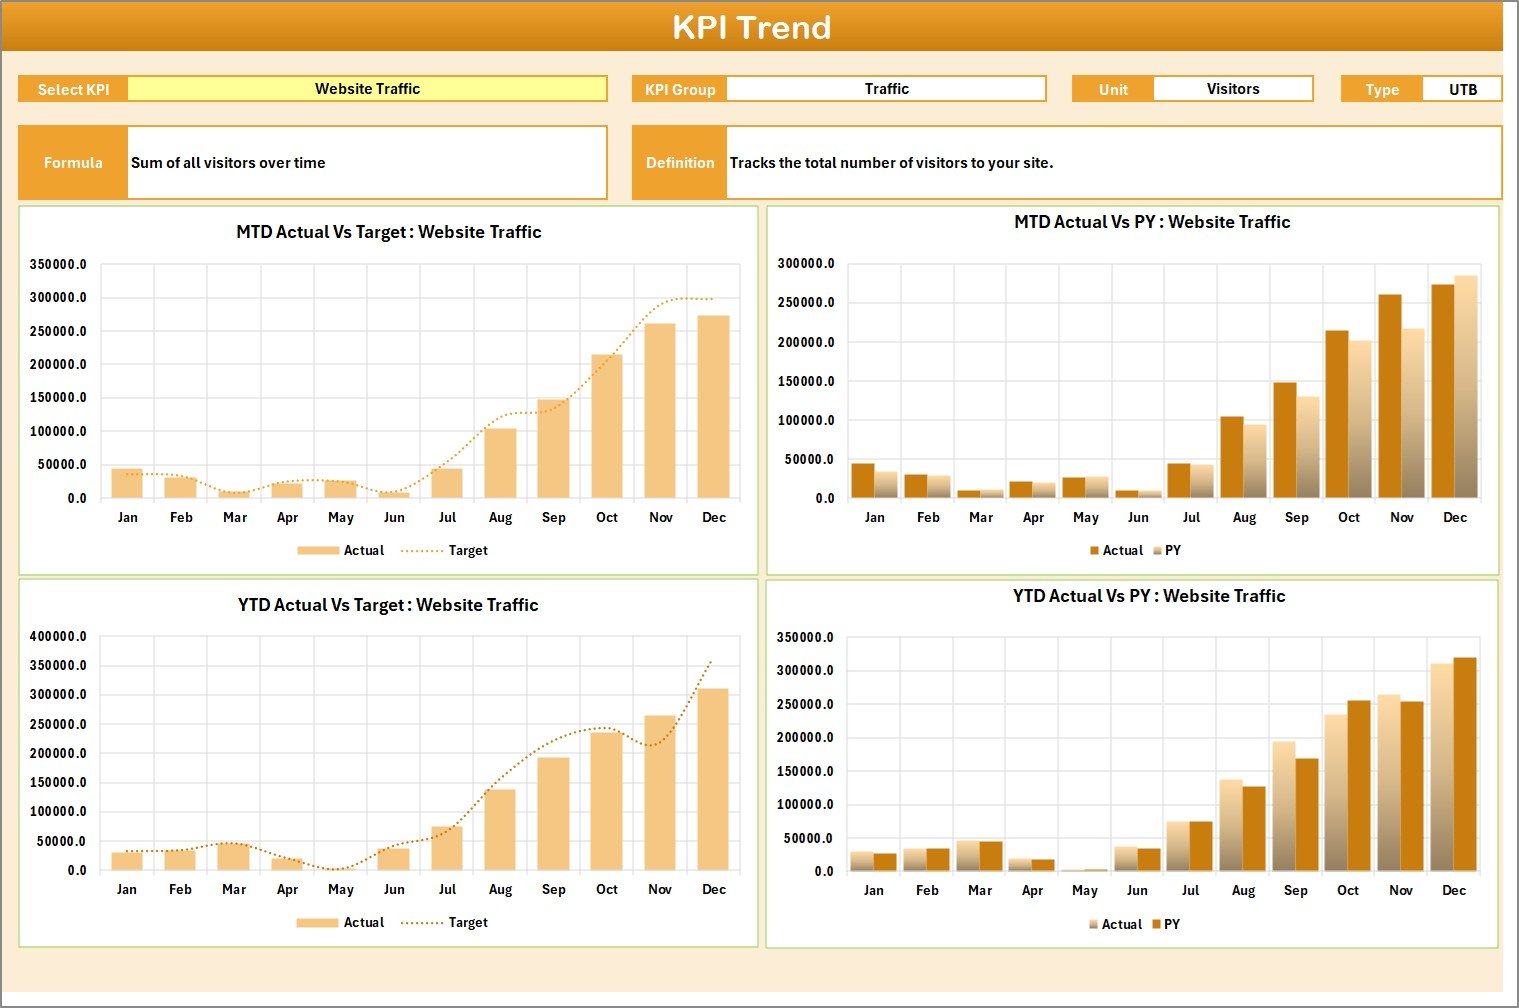
The KPI Trend Sheet helps you analyze trends over time.
Key features include:
-
📊 KPI Selection – Choose a KPI from a dropdown menu (cell C3).
-
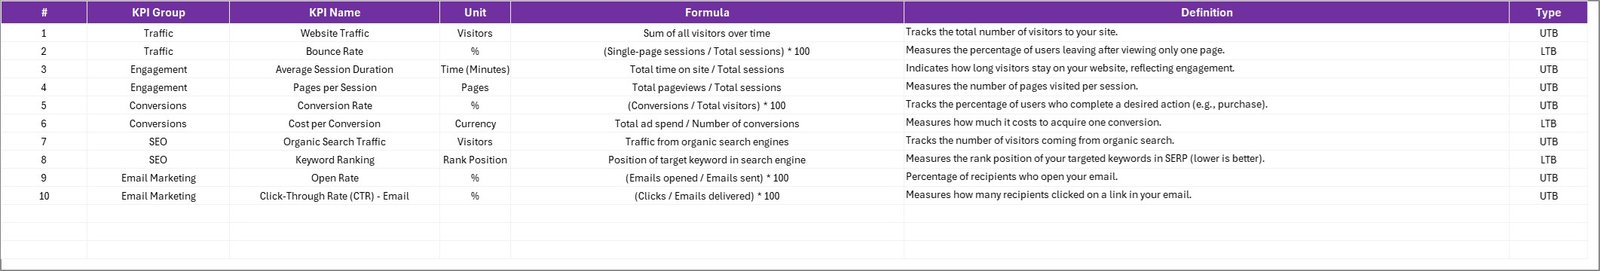
📊 KPI Details – Automatically displays KPI Group, Unit of Measurement, Type of KPI (Lower the Better or Upper the Better), Formula, and Definition.
-
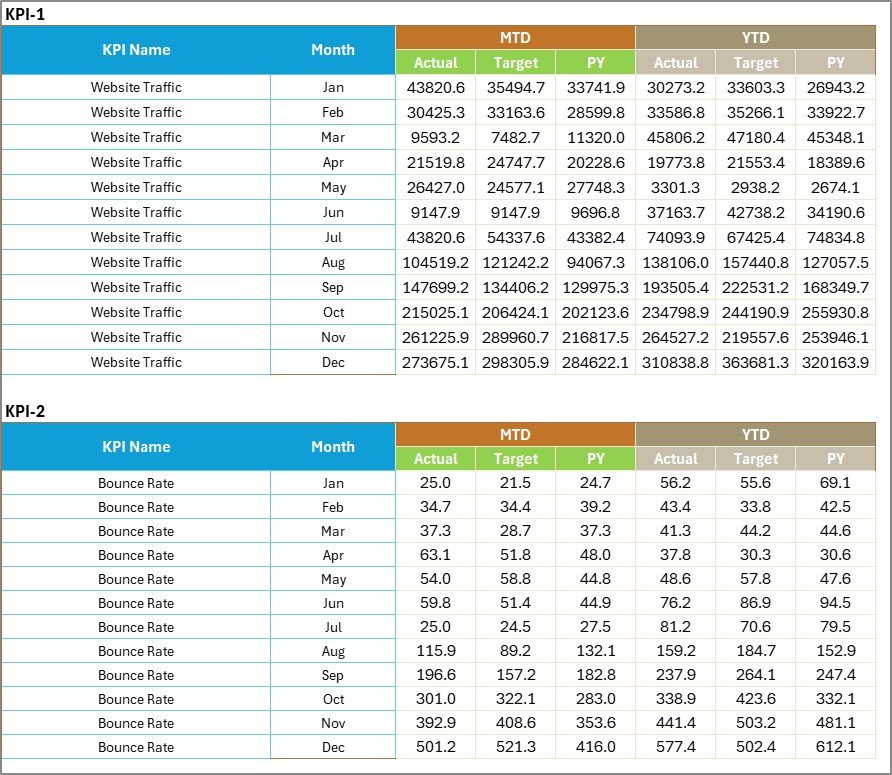
📊 Trend Charts – Visualize MTD and YTD comparisons of Actual, Target, and Previous Year (PY) values.
This tab helps marketers monitor progress patterns and identify if changes in campaigns lead to measurable improvements.
Click to Purchases Digital Marketing KPI Scorecard in excel
3. Input Data Sheet
This is the data entry backbone of the scorecard.
✍ Data Entry – Enter monthly Actuals, Targets, and other required metrics.
🔄 Flexibility – Update the sheet with new numbers regularly, ensuring the scorecard reflects current results.
The simplicity of this sheet makes it easy for anyone on the marketing team to update without technical knowledge.
4. KPI Definition Sheet
This sheet contains the metadata of your KPIs.
📑 KPI Details – Define KPI Name, KPI Group, Unit, Formula, and Definition.
📑 Reference Point – Acts as the knowledge base for the entire scorecard, ensuring consistency.
Having a clear definition sheet eliminates confusion, especially when teams expand or when you present metrics to stakeholders.
Why Use Excel for a Digital Marketing KPI Scorecard?
While many marketing tools and BI dashboards exist, Excel remains one of the most reliable platforms for small and medium businesses. Here’s why:
-
🖥 Accessibility – Almost every team member knows how to use Excel.
💰 Cost-Effective – No need for costly software or licenses.
⚙ Customizable – Adapt the template to your business needs easily.
🔒 Data Control – Keep your data secure in your local files or cloud drives.
📊 Visualization – Built-in charts and conditional formatting make analysis easier.
For organizations looking to manage performance without investing in heavy tools, Excel is the perfect solution.
Key KPIs to Include in a Digital Marketing Scorecard
Choosing the right KPIs is essential. Here are some important metrics you can track:
🌐 Website Traffic – Total visits, new vs returning users.
🔍 SEO Performance – Organic traffic, keyword ranking, backlinks.
📱 Social Media Engagement – Likes, shares, comments, reach.
💌 Email Campaign Metrics – Open rate, click-through rate, conversions.
💳 Conversion Rate – Percentage of visitors who completed a desired action.
📉 Bounce Rate – Visitors leaving without interaction.
💵 Cost Per Lead (CPL) – Marketing spend per qualified lead.
📈 Return on Ad Spend (ROAS) – Revenue generated for every ad dollar spent.
🛒 Customer Acquisition Cost (CAC) – Cost to acquire a new customer.
🔄 Customer Lifetime Value (CLV) – Predicted revenue per customer across the relationship.
By combining these KPIs, you get a holistic view of marketing performance.
Advantages of Using a Digital Marketing KPI Scorecard in Excel
Using this scorecard offers several benefits:
✅ Clarity in Performance Tracking – See exactly where you stand against goals.
✅ Better Decision-Making – Identify high-performing and underperforming campaigns.
✅ Improved Accountability – Assign KPIs to team members and track responsibilities.
✅ Data-Driven Culture – Encourage fact-based strategies instead of assumptions.
✅ Historical Comparisons – Compare this year’s results with previous year data.
✅ Ease of Reporting – Quickly prepare reports for clients, managers, or stakeholders.
In short, this tool transforms raw numbers into actionable marketing intelligence.
Best Practices for the Digital Marketing KPI Scorecard
To get the maximum value, follow these best practices:
🗂 Keep KPIs Relevant – Don’t overload with too many KPIs. Focus on what drives your goals.
📅 Update Regularly – Input data consistently (weekly or monthly) to maintain accuracy.
🎯 Set Realistic Targets – Ensure targets are challenging but achievable.
📊 Leverage Visuals – Use charts, progress bars, and conditional formatting for better insights.
🔄 Compare Trends – Always analyze MTD, YTD, and PY to spot true growth patterns.
👥 Collaborate – Share the scorecard with your team so everyone works toward the same objectives.
📝 Review Definitions – Ensure KPI definitions are updated and understood across departments.
How to Use the Digital Marketing KPI Scorecard Effectively?
-
Define Your KPIs – Start by filling in the KPI Definition sheet with relevant marketing metrics.
-
Set Your Targets – Establish monthly and yearly goals for each KPI.
-
Input Actual Data – Enter performance values in the Input Data sheet.
-
Analyze Results – Use the Scorecard sheet to view performance and trends.
-
Take Action – If Actual values fall short, analyze campaigns and make adjustments.
This cycle ensures that your marketing activities remain aligned with your strategic goals.
Opportunities for Improvement in Digital Marketing Scorecards
While Excel-based scorecards are powerful, you can enhance them further:
🔗 Integrate with Other Tools – Use Power Query or external connectors to pull data automatically.
📈 Add Forecasting Models – Incorporate formulas to predict future performance.
🖥 Combine with Power BI – For advanced visualization and reporting.
📊 Expand KPI Categories – Include customer satisfaction, retention, or brand awareness KPIs.
These improvements make the scorecard future-ready and more comprehensive.
Conclusion
A Digital Marketing KPI Scorecard in Excel is an essential tool for businesses that want to track, measure, and improve their marketing efforts. With structured sheets, visual dashboards, and clearly defined KPIs, it provides a cost-effective way to transform raw data into actionable insights.
Whether you’re running SEO campaigns, social media ads, or email marketing, this scorecard ensures you stay on track, meet your targets, and communicate results effectively.
If you want a simple yet powerful way to manage marketing performance, this Excel template is the right choice.
Frequently Asked Questions (FAQs)
1. What is a Digital Marketing KPI Scorecard?
It’s an Excel-based tool that tracks and evaluates marketing performance by comparing actual results against set targets.
2. Why should I use Excel instead of other tools?
Excel is cost-effective, customizable, widely accessible, and flexible enough for both beginners and advanced users.
3. How often should I update the scorecard?
You should update it monthly, but for fast-moving campaigns, weekly updates provide better insights.
4. Can I customize the KPIs in the scorecard?
Yes. The KPI Definition sheet allows you to add, edit, or remove KPIs based on your business needs.
5. Does the scorecard show historical data?
Yes. It includes YTD and Previous Year comparisons for effective trend analysis.
6. Can teams use it collaboratively?
Absolutely. You can store it in cloud drives like OneDrive or Google Drive, enabling multiple team members to update and access it.
7. What makes this scorecard different from a simple spreadsheet?
Unlike raw spreadsheets, it includes dropdown menus, visual indicators, and trend charts, making it easier to analyze data.
8. Can I integrate this Excel scorecard with Power BI?
Yes. You can connect the Input Data sheet to Power BI for advanced dashboards and reporting.
Visit our YouTube channel to learn step-by-step video tutorials
Youtube.com/@NeotechNavigators