Disability Support NGOs Dashboard in Excel is built for NGOs, nonprofit branches, disability service providers, and program managers who need a clear way to monitor beneficiaries, services, funding, donations, volunteer hours, case status, and branch activity. Disability inclusion is a large operational responsibility: the World Health Organization estimates that about 1.3 billion people, or 16% of the global population, experience significant disability. For support NGOs, that means reporting cannot stay scattered across emails, donation files, and manual monthly notes.
This Excel dashboard gives your team 7 connected sheet tabs, executive KPI cards, slicer-driven filtering, pivot-backed charts, a dedicated Data sheet, and a Support sheet that powers the workbook. Instead of rebuilding charts every month, you can update the data, refresh the workbook, and review the dashboard pages.
Key Features of Disability Support NGOs Dashboard in Excel
- 7 Excel sheet tabs: Overview Page, Program Analysis, Beneficiary Insights, Funding Tracker, Branch Performance, Data sheet, and Support sheet.
- 5 headline KPI cards: Total Beneficiaries, Total Service Hours, Total Budget, Total Donations, and Total Volunteer Hours.
- Program performance analysis: Compare service types by budget, service hours, cases, satisfaction, and completion percentage.
- Beneficiary insights: Review beneficiaries by age group, gender, disability type, satisfaction, and funding source.
- Funding tracker: Monitor donations by source, budget utilization, monthly budget, and cases by branch.
- Branch performance: Compare beneficiary reach, case ownership by program manager, and case status.
- Refreshable Excel structure: Update the Data sheet and use Refresh All to refresh pivots and charts.
Dashboard Pages Explanation
1. Overview Page
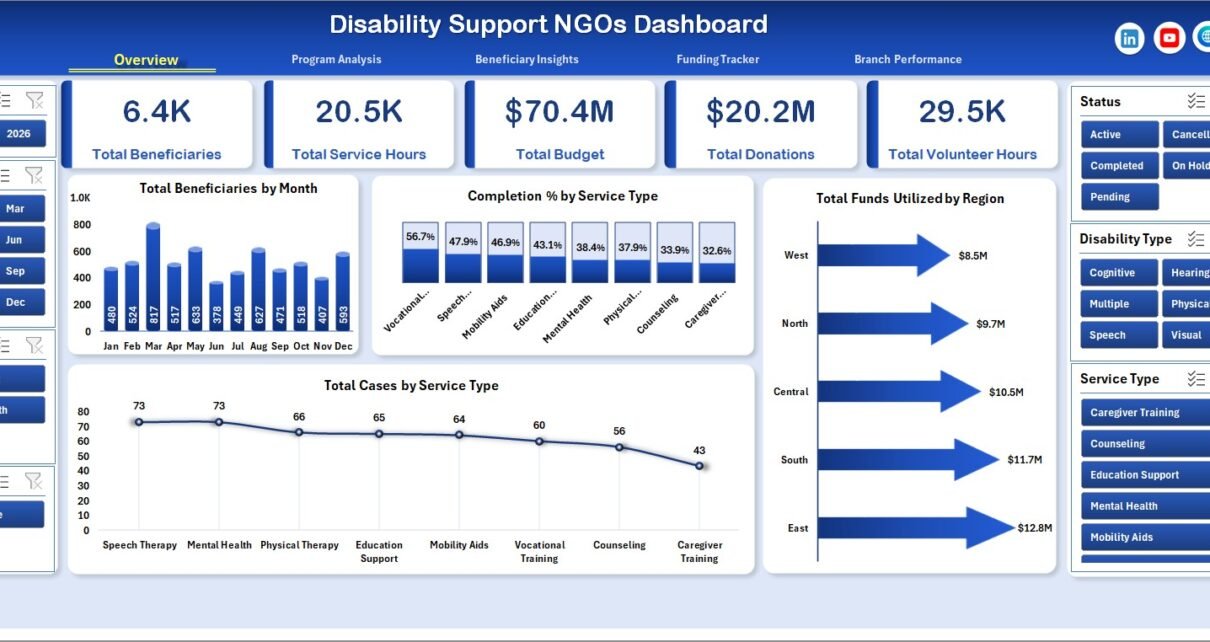
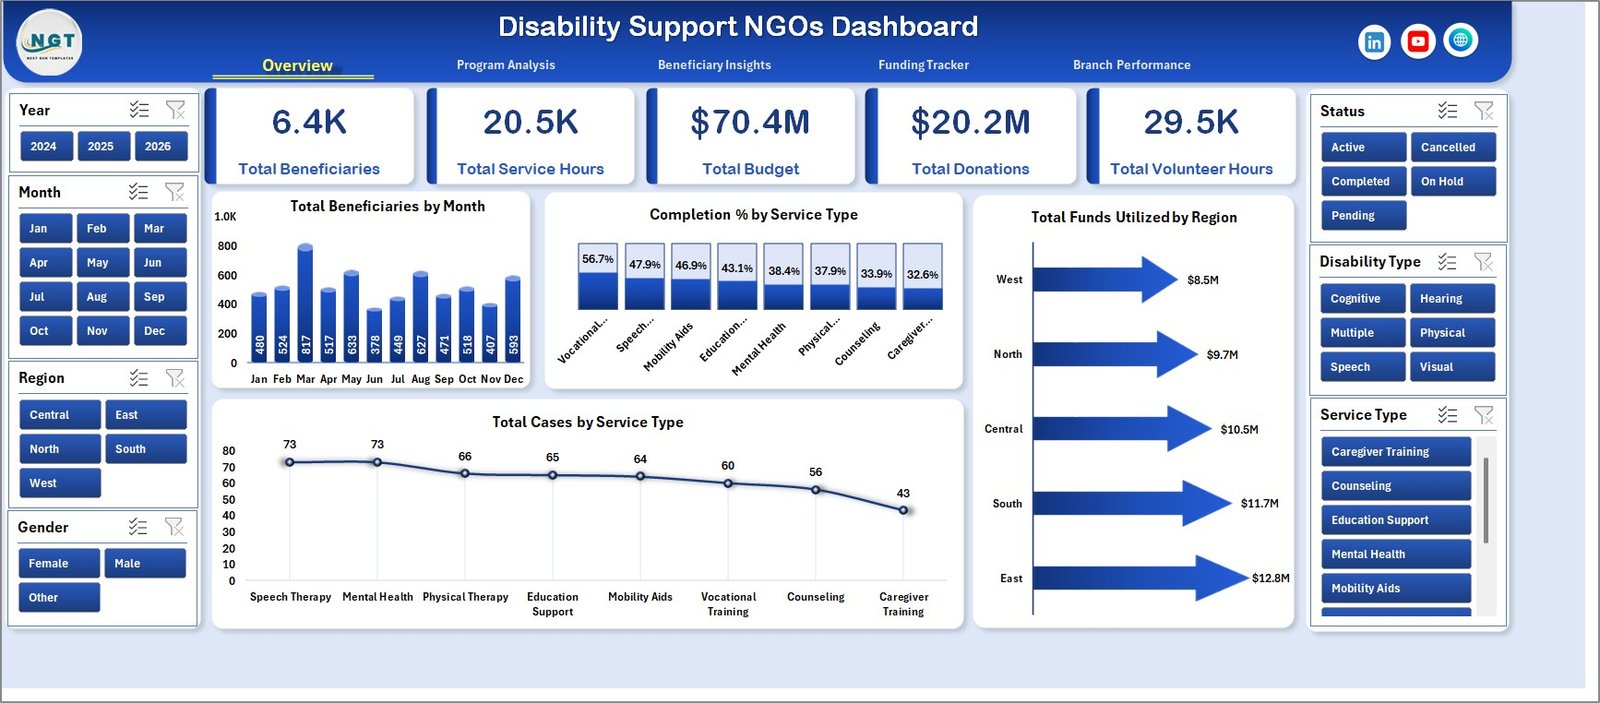
The Overview Page is the high-level management view. At the top of the sheet, the KPI cards show Total Beneficiaries, Total Service Hours, Total Budget, Total Donations, and Total Volunteer Hours. These cards help leaders see reach, operational effort, available funding, fundraising performance, and community contribution in one place.
Total Beneficiaries by Month shows how beneficiary reach changes across months. This chart helps managers understand growth, outreach trends, and months where registrations or support delivery may need attention.
Completion % by Service Type compares successful service completion across service categories. It helps program teams identify which service types are running smoothly and which may need stronger follow-up.
Total Funds Utilized by Region shows how funds are being used across regions. This is useful for checking whether spending distribution matches service demand and regional priorities.
Total Cases by Service Type counts cases by each support service. It helps managers see the services creating the highest workload and where staff or volunteer planning may be needed.
2. Program Analysis
The Program Analysis sheet gives a deeper view of how support programs perform by service type and disability type.
Total Budget by Service Type compares budget allocation across services. It helps finance and program leads decide whether funding is aligned with priority programs.
Total Service Hours by Service Type shows how many hours are being spent in each service area. It is especially useful for workload planning, volunteer coordination, and staff capacity discussions.
Avg. Satisfaction by Service Type compares satisfaction scores across services. If one service has lower satisfaction, the team can review delivery quality, wait times, or communication.
Completion % by Disability Type shows completion rates across disability categories. This helps teams review inclusion outcomes and investigate whether certain groups face barriers in completing services.

3. Beneficiary Insights
The Beneficiary Insights sheet helps NGOs understand the people they serve, not just the volume of services delivered.
Total Beneficiaries by Age Group breaks beneficiary reach into age groups. This helps NGOs plan age-specific programs, outreach, facilities, and support materials.
Total Beneficiaries by Gender shows how support is distributed across gender groups. It can support equity review and help teams identify gaps in outreach or service access.
Avg. Satisfaction by Disability Type compares satisfaction across disability categories. This is useful for identifying groups that may need improved accessibility, better communication, or service redesign.
Total Budget by Funding Source shows how much budget is connected to each funding source. It helps fundraising and grant teams understand dependence on donors, grants, sponsorships, or internal funds.

4. Funding Tracker
The Funding Tracker sheet is designed for donor reporting, budget monitoring, and finance review.
Total Donations by Funding Source compares donation value across funding sources. This helps fundraising teams see which sources are contributing most to the program.
Budget Utilization % by Funding Source shows how much of each funding source has been used. It helps prevent both overspending and underuse before reporting deadlines.
Total Budget by Month tracks monthly budget movement. Finance teams can use this chart for monthly reviews, board updates, and planning cycles.
Total Cases by NGO Branch compares case volume by branch. Used with funding charts, it helps leaders check whether high-case branches are receiving enough resources.

5. Branch Performance
The Branch Performance sheet helps compare operational delivery across NGO branches and program managers.
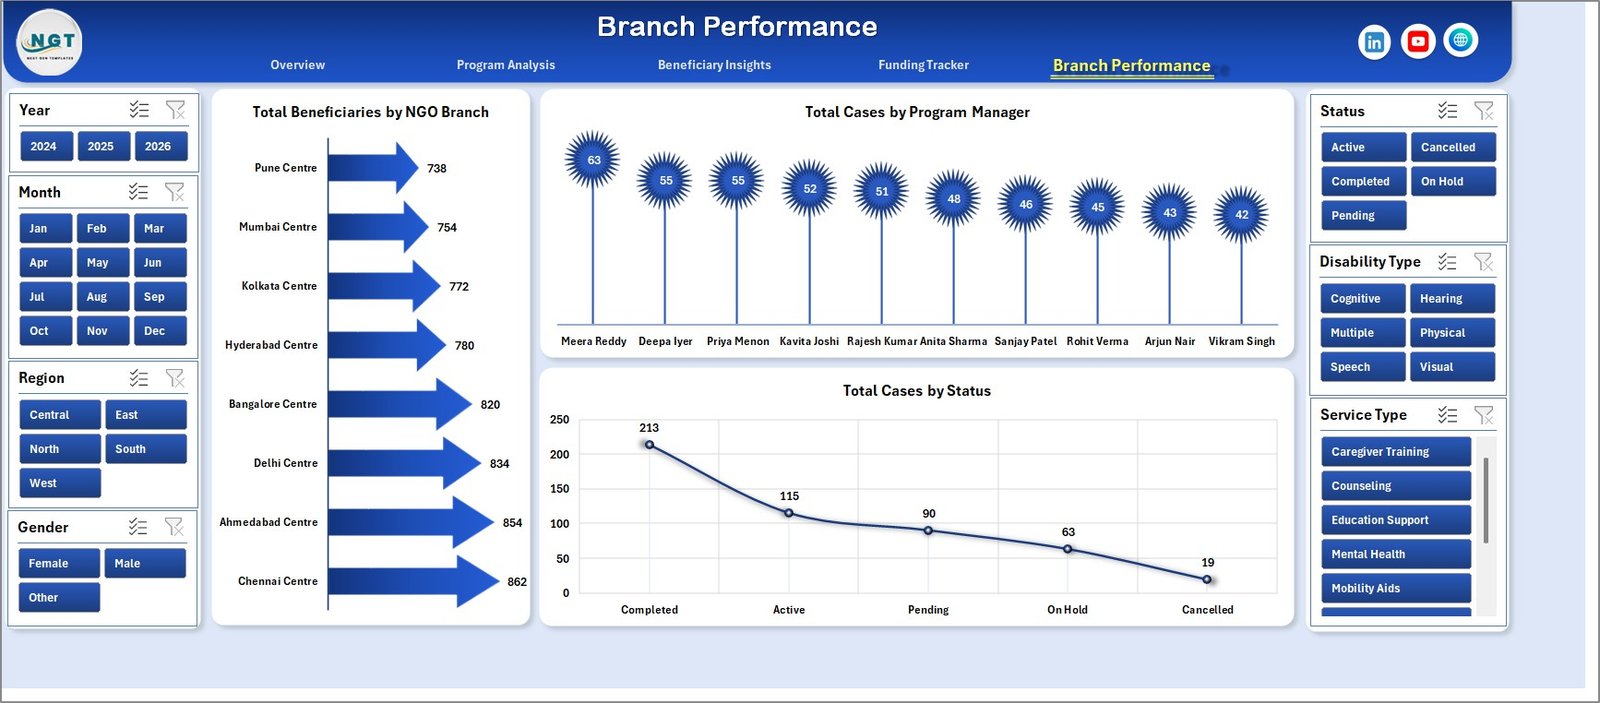
Total Beneficiaries by NGO Branch compares reach by branch. This makes it easier to identify high-volume locations and branches that may need additional outreach.
Total Cases by Program Manager shows case ownership by manager. It can support workload balancing, staff coaching, and accountability reviews.
Total Cases by Status summarizes case progress by status. It helps teams see how many cases are open, completed, pending, or delayed so follow-up can be prioritized.
6. Data Sheet Tab
The Data sheet is the input area for the dashboard. Add your NGO records in the same format as the sample data, keeping the columns consistent so the pivots and charts can refresh correctly.

7. Support Sheet Tab
The Support sheet contains the pivot tables used to build the charts dynamically. After updating the Data sheet, go to the Data tab in the Excel ribbon and click Refresh All. The pivots and charts will update from the latest data, and you can keep this Support sheet hidden during normal use.

Disability Support NGOs Dashboard in Excel vs. Google Sheets vs. Paid Nonprofit SaaS – Feature Comparison
| Feature | This Excel dashboard | Google Sheets alternative | Paid nonprofit SaaS |
|---|---|---|---|
| Cost | $17.99 one-time | Template cost or manual build time | Monthly or annual subscription |
| Platform | Microsoft Excel | Google Sheets | Vendor-hosted web app |
| Setup time | Replace data and refresh pivots | Copy sheet and configure formulas | Implementation and onboarding |
| Real-time team collaboration | Limited unless used with OneDrive | Strong built-in collaboration | Usually included |
| Mobile access | Limited for dashboard editing | Available through Sheets app | Usually available |
| Customizable fields | Fully editable workbook | Editable sheet | Limited by vendor setup |
| Share with link | Possible through Microsoft 365 | Yes | Yes |
| Program and funding analysis | Built in | Must be configured | Depends on plan |
| Year-1 cost at 5 users | $17.99 plus Excel licensing | Template and workspace costs | Often hundreds or thousands |
Who Should Use This Template
This template is ideal for disability support NGOs, nonprofit program directors, branch coordinators, donor reporting teams, volunteer managers, service coordinators, and consultants preparing monthly program dashboards. It works best when your team already records program data in Excel or exports data from another tool into spreadsheet format.
It is not meant to replace donor CRM software, case management software, accounting systems, beneficiary privacy controls, appointment scheduling, or secure database workflows. Think of it as the reporting layer: a clear way to summarize and analyze data you already maintain.
Real-World Use Cases
Amina, program director: Amina reviews the Overview Page before board meetings to explain beneficiary reach, service hours, funding, donations, and volunteer contribution.
Ravi, branch coordinator: Ravi uses Branch Performance to compare case status by branch and program manager, then assigns follow-up actions for delayed cases.
Sofia, grants analyst: Sofia uses Funding Tracker to review donations by funding source, budget utilization, and monthly budget movement before submitting donor updates.
Advantages of Disability Support NGOs Dashboard in Excel
- Fast setup: Replace sample records and refresh the dashboard.
- Familiar platform: Built in Excel, so most teams can use it without new software training.
- Clear accountability: Branch, manager, status, and funding views make review meetings easier.
- Editable design: You can adjust fields, chart labels, colors, and formulas for your organization.
- One-time cost: No subscription or per-user template fee.
Opportunities for Improvement
The dashboard is intentionally lightweight, so it does not include login screens, automated privacy permissions, donor communication, mobile case entry, or live database syncing. Organizations handling sensitive beneficiary data should store the workbook securely, limit access, and follow internal privacy rules. If your NGO needs field-worker mobile entry, audit trails, or role-based case records, use this dashboard alongside a dedicated data collection or case management system.
Best Practices
- Keep the Data sheet columns consistent when replacing sample data.
- Refresh all pivot tables after every major data update.
- Review unusually high or low satisfaction scores before sharing reports externally.
- Use consistent service type, branch, region, and funding source names to keep slicers clean.
- Keep a backup copy before making structural workbook changes.
Explore Relevant Templates
You can download the product here: Disability Support NGOs Dashboard in Excel. You may also like Special Education Dashboard in Power BI and Digital Microloans Dashboard in Power BI. Browse more Excel dashboard templates on NextGenTemplates.
Frequently Asked Questions
What does the Disability Support NGOs Dashboard in Excel track?
It tracks beneficiaries, service hours, budgets, donations, volunteer hours, cases, service types, disability types, satisfaction, funding sources, branches, program managers, regions, and case status.
Can I use this dashboard with my own NGO data?
Yes. Replace the sample records in the Data sheet with your own records in the same format, then refresh the workbook.
Do I need advanced Excel skills?
No. For standard use, you mainly update the Data sheet and click Refresh All. Advanced users can customize pivot tables, formulas, and chart formatting.
Can I keep the Support sheet hidden?
Yes. The Support sheet contains pivot tables for the dashboard. You can keep it hidden after setup and refresh it when the workbook updates.
Is this a case management system?
No. It is an Excel reporting dashboard. It does not replace secure case records, user permissions, beneficiary intake workflows, or donor CRM tools.
How often should I refresh the dashboard?
Refresh it after updating the Data sheet or before preparing reports for management, donors, or board meetings.
About the Author
Built by PK – Microsoft Certified Professional with 15+ years of Excel, Google Sheets, and Power BI experience. Founder of NextGenTemplates, reaching 300K+ subscribers across YouTube channels. Every template is hand-built and tested before release.
Conclusion
The Disability Support NGOs Dashboard in Excel gives nonprofit teams a practical reporting system for program reach, service hours, funding, donations, volunteer contribution, satisfaction, and branch performance. It is simple enough for monthly reporting and flexible enough for custom NGO workflows. For step-by-step Excel and dashboard tutorials, visit YouTube.com/@PKAnExcelExpert.