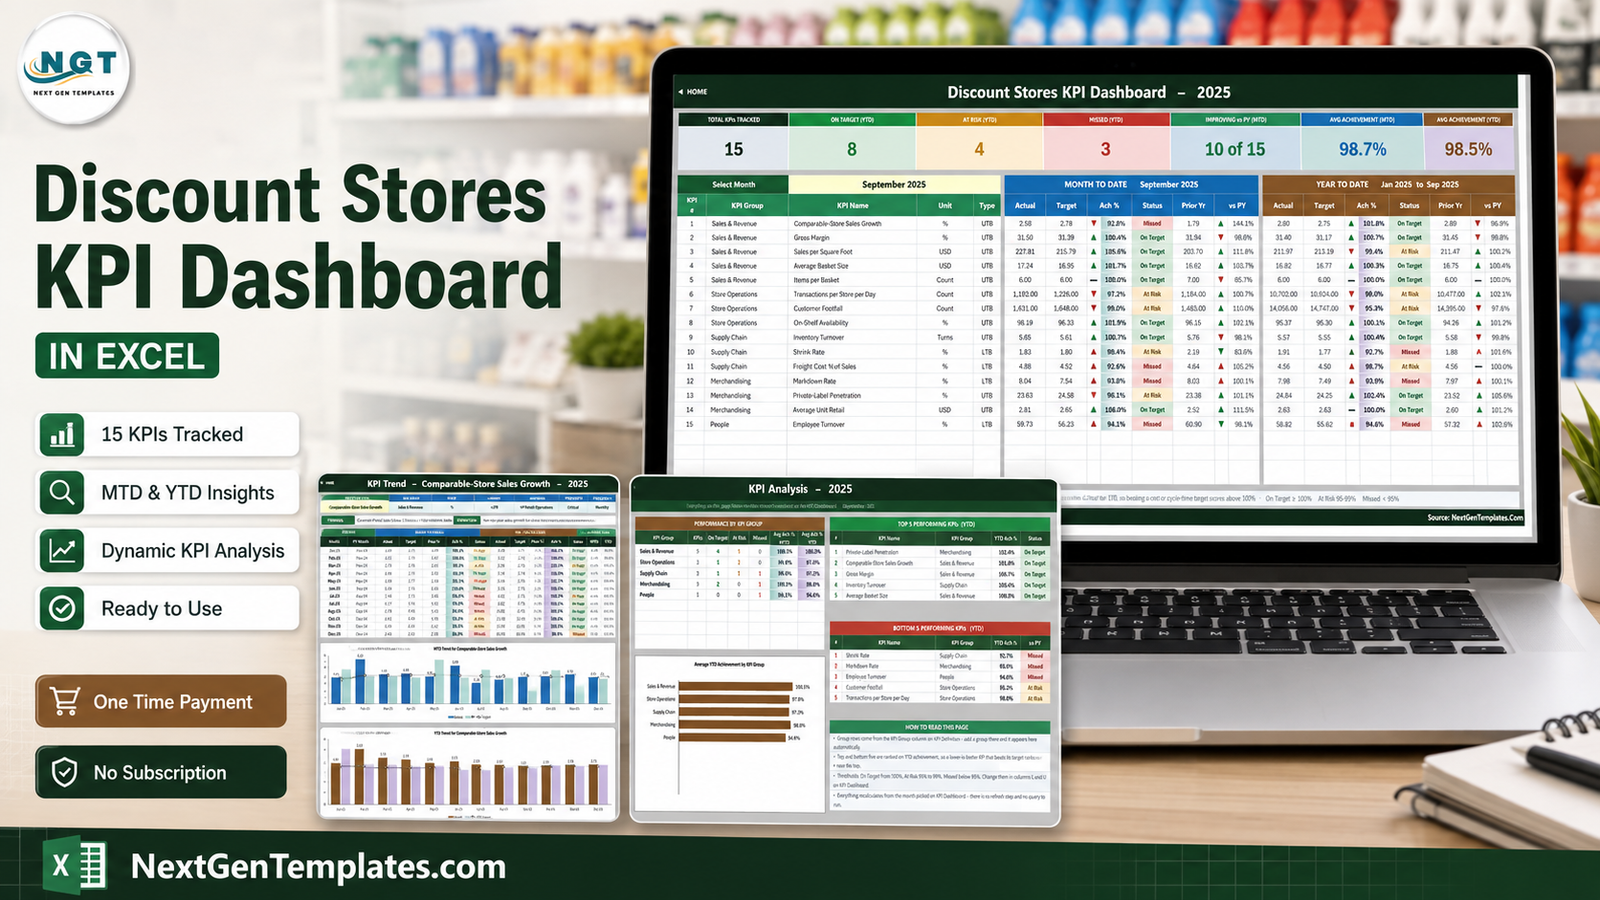
Discount retail is a business of small margins repeated at enormous volume. When your average unit retail is $2.63 and your average basket is under $17, a 40-basis-point slip in gross margin or a quarter of a point of shrink is not a rounding error – it is the quarter. The problem for most value, variety and dollar-store operators is not that the numbers do not exist. Comp sales, footfall, on-shelf availability, markdown, private-label share and staff turnover are all sitting in a POS export or a finance pack somewhere. The problem is that nobody has put them on one page, next to a target, with a consistent rule for what counts as a miss.
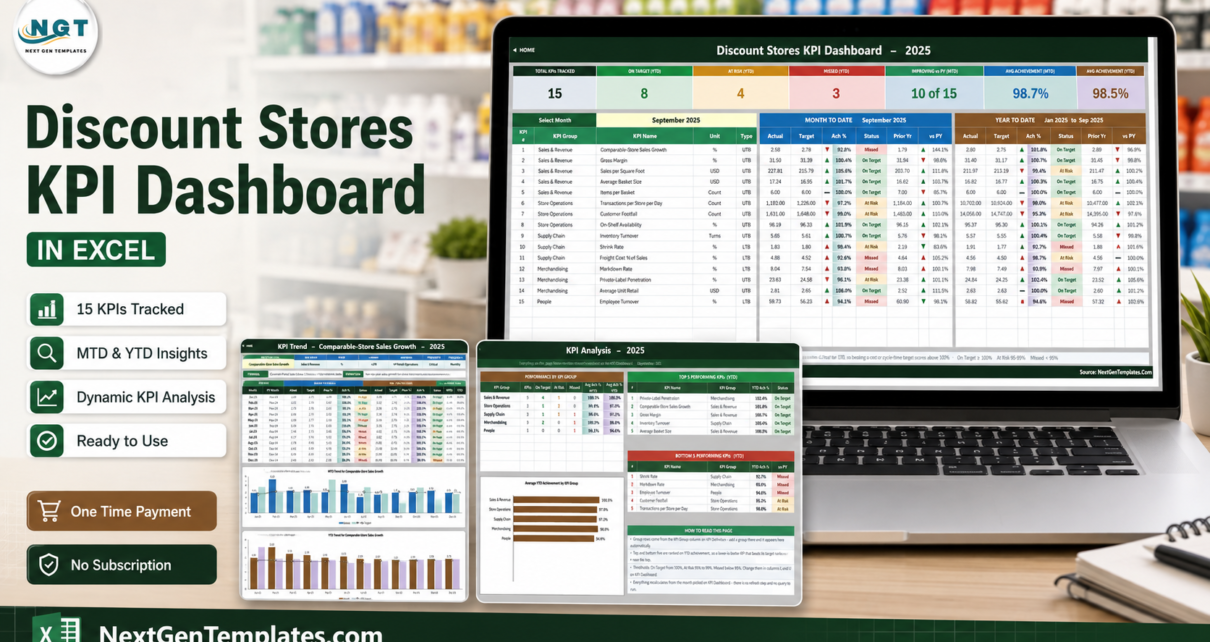
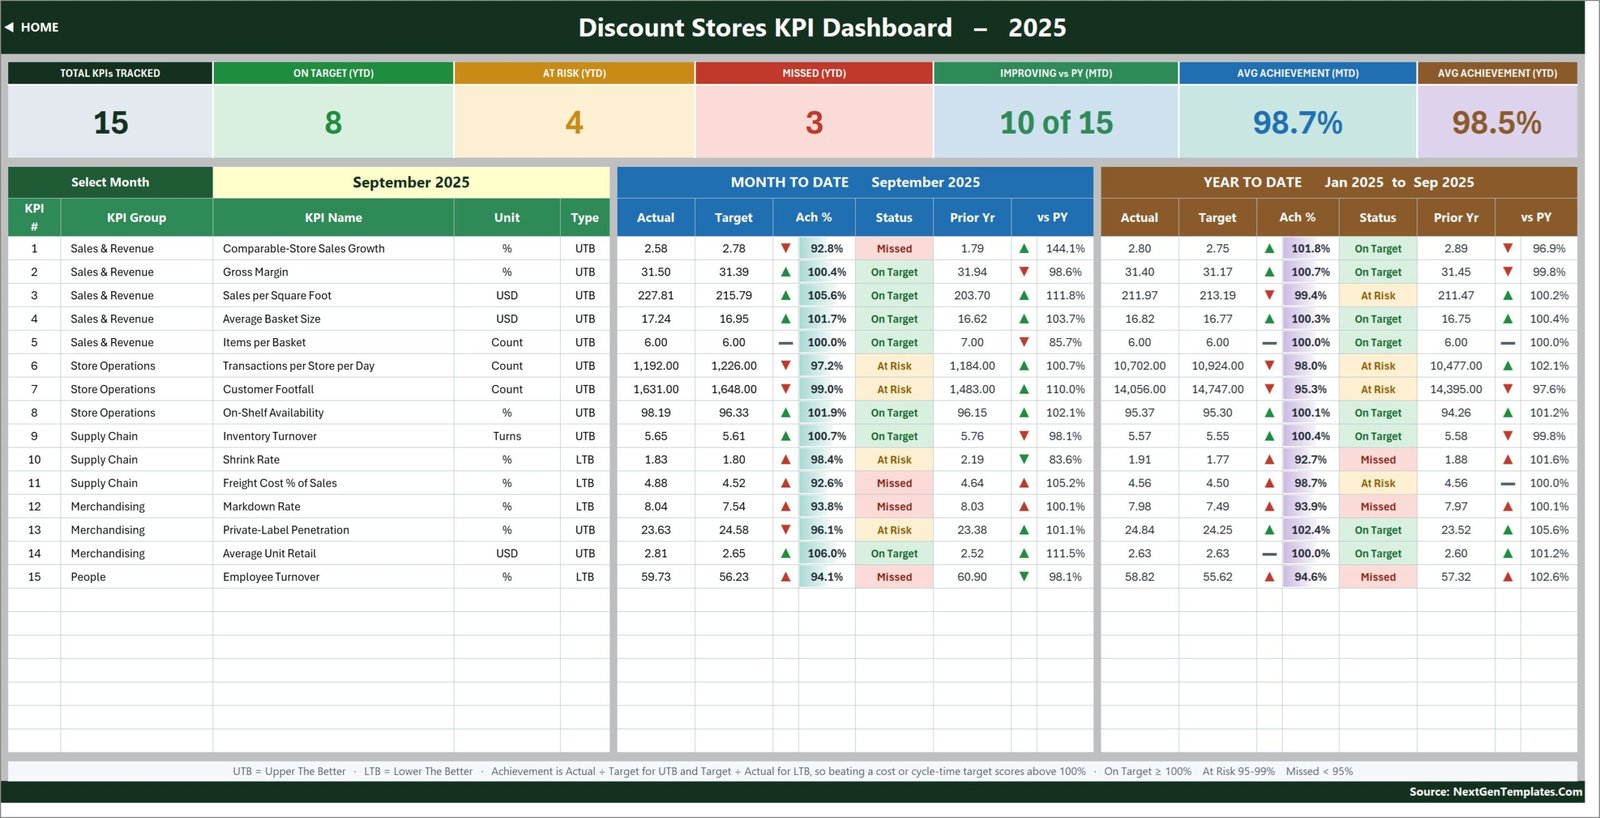
The Discount Stores KPI Dashboard in Excel does exactly that and nothing more. It is a month-picker KPI scorecard: choose a month from one dropdown and 15 KPIs across five groups report their month-to-date and year-to-date actual, target, achievement percentage, traffic-light status, prior-year comparator and year-on-year movement simultaneously. The sample file ships a complete 2025 reporting year with September 2025 selected – 8 KPIs On Target, 4 At Risk and 3 Missed on a year-to-date basis, 10 of 15 improving on last year, and average achievement of 98.7% MTD against 98.5% YTD. Every number on every page is a plain worksheet formula. No macros, no Power Query, no data model, no add-in.
Key Features of the Discount Stores KPI Dashboard in Excel
One dropdown drives everything. Cell D6 on the KPI Dashboard sheet holds the twelve months of the reporting year. Change it and the whole scorecard, its seven summary cards and the entire KPI Analysis page recalculate. There is no refresh step, because there is no query to refresh.
Direction-aware scoring. Each KPI is tagged UTB (Upper The Better) or LTB (Lower The Better) on the KPI Definition sheet. Achievement is Actual ÷ Target for a UTB KPI and Target ÷ Actual for an LTB one. That single decision is why Shrink Rate, Markdown Rate, Freight Cost % of Sales and Employee Turnover – the four LTB KPIs in this build – score above 100% when you come in under plan, instead of appearing to fail. Anyone who has hand-built a retail scorecard knows how much conditional-formatting pain that saves.
Traffic-light bands you can move. On Target from 100%, At Risk from 95% to 99%, Missed below 95%. Those thresholds are written into the formulas in columns L and U on the KPI Dashboard sheet, so if your governance says At Risk starts at 97% you change two formulas rather than rebuilding the sheet.
A KPI list you edit, not a list you inherit. The three input sheets, the scorecard, the trend page and the analysis page all read the KPI names from one master list on KPI Definition. Rename a KPI there and it changes everywhere. The sheets are wired for 22 KPI rows and 15 are filled, so seven live empty rows are already waiting for whatever your business tracks that ours does not.
Governance metadata that survives a handover. Every KPI carries a written formula, a plain-English definition, an owner, a priority and a reporting frequency. Shrink Rate, for example, is owned by the Head of Loss Prevention, flagged High priority, and marked Quarterly – so nobody spends a monthly review arguing about why it moved.
Dashboard Pages Explanation
Home
A navigation page grouped into three columns – Dashboard Pages, Input Sheets (Edit These) and Reference & Help – with a one-line description under each button. It exists so a new user knows which three sheets they are allowed to type into.
KPI Dashboard
The scorecard itself, and the page you will live on. Seven summary cards run across the top: Total KPIs Tracked, On Target (YTD), At Risk (YTD), Missed (YTD), Improving vs PY (MTD), Avg Achievement (MTD) and Avg Achievement (YTD). Below them, one row per KPI with a Month To Date block and a Year To Date block, each carrying Actual, Target, Achievement %, Status, Prior Yr and vs PY. On the September 2025 sample, Sales per Square Foot reads $227.81 against a $215.79 target – 105.6% and On Target for the month – while its year to date sits at 99.4% and flips to At Risk. That split is the whole argument for showing MTD and YTD side by side.
KPI Trend
One KPI at a time. Pick it from the dropdown in cell B4 and the attribute strip (group, unit, type, owner, priority, frequency), the written formula and definition, a twelve-month table and two combo charts all follow. The charts plot actual and prior-year columns against a target line – one for MTD, one for YTD. This is the page you open when a KPI turns red and somebody asks whether it is a blip or a trend.
KPI Analysis
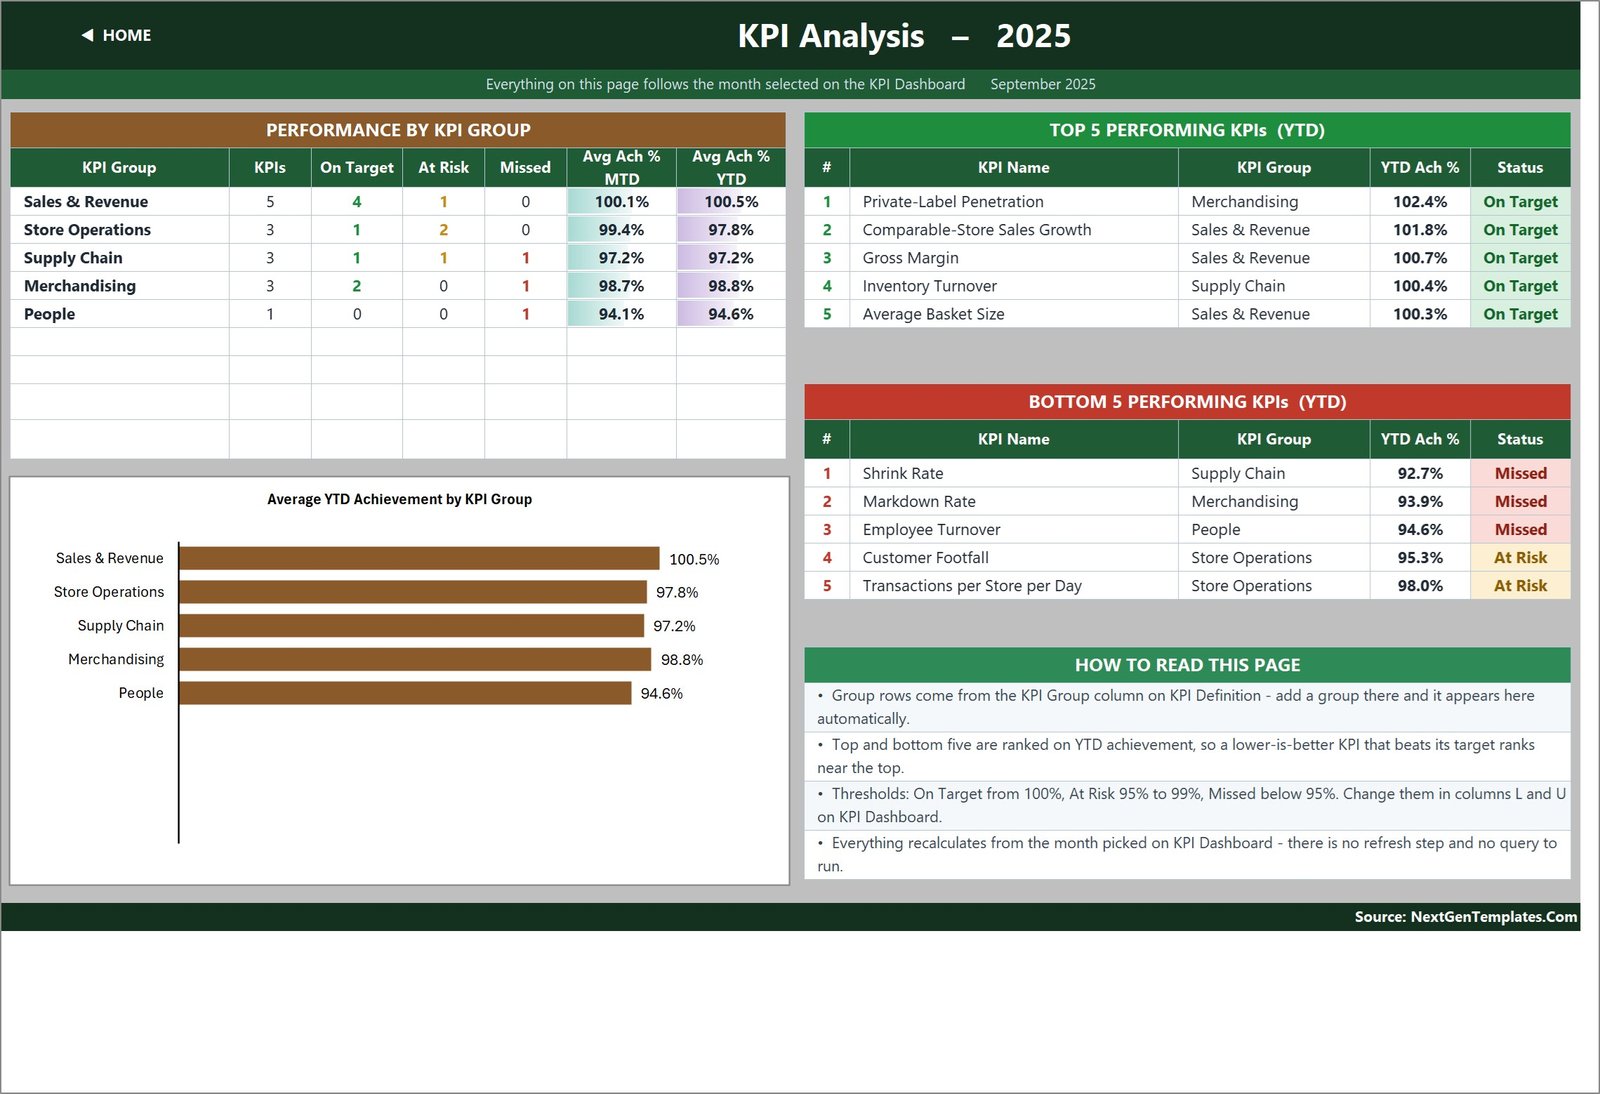
The month you selected, rolled up. Performance by KPI Group gives each of the five groups its KPI count, its On Target / At Risk / Missed counts and its average MTD and YTD achievement, with a bar chart alongside. On the sample year Sales & Revenue holds at 100.5% YTD and People trails at 94.6%. Then Top 5 and Bottom 5 Performing KPIs, both ranked on year-to-date achievement: Private-Label Penetration leads at 102.4%, and Shrink Rate props up the table at 92.7%. Because the ranking uses achievement rather than the raw value, a lower-is-better KPI that beats its target ranks near the top where it belongs.
KPI Input – Actual, Target and PY
The three sheets you actually type into. Each holds an MTD and a YTD column for every month of the year, for every KPI. Cell E3 on the Actual sheet is the first month of the reporting year; change it and the Target sheet, the Prior Year sheet, the month dropdown and every sheet title re-base with it.
KPI Definition, Read Me and Get More Templates
KPI Definition is the master list. Read Me documents how the workbook is wired, the rules the numbers follow and how to add, rename or remove a KPI. Get More Templates links out to the rest of the catalogue. A hidden-in-plain-sight Support sheet holds the helper calculations – the selected month, the arrow glyphs, the dropdown list, the chart series and the ranking helpers – and needs no editing.
Discount Stores KPI Dashboard in Excel vs. Google Sheets vs. Paid Retail BI – Feature Comparison
| Discount Stores KPI Dashboard in Excel | Google Sheets scorecard you build | Paid retail BI (NetSuite Analytics / Zoho Analytics tier) | |
|---|---|---|---|
| Cost | One-time 19.99 (12.99 on offer) | Free tool, your build time | Roughly 30-100+ per user per month |
| Platform | Excel 2013+, Microsoft 365, Excel for the web | Browser | Browser, vendor-hosted |
| Setup time | Minutes – the sample year is filled in | Days | Weeks, often with a partner |
| Real-time team collaboration | Via OneDrive / SharePoint co-authoring | Yes, native | Yes |
| Mobile access | Excel mobile app | Yes | Yes |
| Customizable fields | Yes – every formula and label is open | Yes, if you write it | Limited to the vendor’s model |
| Share with link | Via OneDrive / SharePoint | Yes | Yes |
| Year-1 cost at 5 users | 19.99 once | Your time | 1,800-6,000+ |
| Reads your POS automatically | No – 15 numbers a month, typed or pasted | No | Yes |
| Direction-aware scoring for shrink and markdown | Built in per KPI | You write it | Usually configurable |
Who Should Use This Template
Retail operations managers running a value or dollar-store estate who present a monthly performance pack. Merchandise planners who watch markdown, private-label penetration and average unit retail together. Loss prevention leads who need a defensible twelve-month view of shrink against target. Finance analysts in discount retail who rebuild the same scorecard every month and would rather not. Franchise and multi-site owners who want one number per KPI per month, scored consistently, without buying a BI seat for everyone.
It is a poor fit if you want the file to connect to your POS or ERP. It reads nothing; you type or paste. It is also not a store-level tool – the workbook holds one number per KPI per month for the whole estate, so there is no store list, no SKU detail and no transaction table to drill into. If store-by-store and category-by-category analysis is what you need, that is a different product and we say so plainly below.
Real-World Use Cases
The monthly operating review. A head of retail operations at a 90-store chain opens the KPI Dashboard, sets the month, and reads seven cards: 15 tracked, 8 On Target, 4 At Risk, 3 Missed, 10 of 15 improving on last year. Ten seconds, and the room knows where it stands. Then KPI Analysis narrows the meeting to the one group that is dragging.
The margin conversation. A merchandise planner sees Markdown Rate at 93.9% YTD and flagged Missed while Private-Label Penetration leads the file at 102.4%. Two facts on one screen: own-brand mix is ahead of plan and markdowns are running hot. That is a specific conversation about which categories are being discounted, not a general one about margin.
The budget case. A loss prevention manager picks Shrink Rate on KPI Trend and gets the twelve-month table with the target line and the prior-year series in one view. Shrink is the lowest-ranked KPI in the sample year at 92.7% YTD. That page, printed, is the business case for a store-audit programme.
Advantages of the Discount Stores KPI Dashboard in Excel
It opens instantly, anywhere, on anything that runs Excel – including Excel for the web – because it uses only VLOOKUP, MATCH, INDEX and COUNTIF. There is no macro prompt, no gateway, no credential and no add-in to be blocked by IT. Nothing is locked, hidden or password-protected, so you can trace every formula and change any of them. The KPI list is a single master list rather than fifteen hardcoded references, which means renaming a KPI is a one-cell edit. And the whole file, sample year included, costs less than one seat-month of any BI tool. If you want to understand the lookup patterns behind it, Microsoft’s own Excel developer documentation is the reference we build against.
Opportunities for Improvement
Being straight about what is not perfect is more useful than another paragraph of praise.
You enter MTD and YTD separately. Each input sheet has both columns and the workbook does not derive one from the other. It is a deliberate choice – a rate like Gross Margin should be a running average while a volume like Transactions per Store per Day accumulates, and only you know your convention – but it does mean two numbers per KPI per month per sheet. Budget for that.
The Home page and the Read Me still say “14 KPIs”. The file ships 15. KPI Definition, the TOTAL KPIs TRACKED card and all three input sheets all show 15, and every calculation counts 15. Two sentences of static text carried over from an earlier revision of this template family and were not updated. They are editable in place, and we would rather tell you than have you find it.
The Read Me’s “Cumulative or average YTD” note uses aerospace examples. It mentions “aircraft deliveries” and “non-conformance reports” – leftovers from a sibling build on the same engine. The rule it describes is correct and applies perfectly well to discount retail; only the illustrations are wrong.
The group roll-up has no prior-year column. KPI Analysis compares groups on MTD and YTD achievement only. Prior-year comparison lives on the scorecard and the trend charts. If you want vs-PY on the group table, you would add it yourself.
The sample numbers are invented. The 2025 data exists to make every card, arrow and colour visible, not to benchmark discount retail. Do not quote a figure from the sample file in a board pack.
Best Practices
Set cell E3 on KPI Input – Actual to your own fiscal start before you type anything else; re-basing later is harmless but confusing. Prune the KPI list before your first month rather than carrying KPIs you will never populate – a blank row on KPI Definition simply drops out of the scorecard and the counts. Decide your YTD convention per KPI once, write it into the definition text, and stick to it. Agree the traffic-light bands with whoever chairs the review before the first meeting, not during it. Fill KPI Input – PY properly: the vs-PY arrows and the Improving vs PY card are worth more than any single achievement percentage, because a KPI at 98% and improving is a different story from a KPI at 98% and sliding. And keep one file per year, archived, rather than overwriting.
Explore Relevant Templates
Which Discount Stores file do you want? There are two and they are not versions of each other. This post is about the KPI scorecard – targets, traffic lights, MTD/YTD, a trend page and a group roll-up. The Discount Stores Dashboard in Excel and the Discount Stores Dashboard in Power BI are the analytical line: pivot-and-slicer analysis over a transaction-style dataset, built to answer “which stores, which categories, which months” rather than “did we hit target”. Many teams own one of each.
Other scorecards on the same engine: Hypermarkets KPI Dashboard in Excel, Convenience Stores KPI Dashboard in Excel, Grocery Delivery Services KPI Dashboard in Excel, Fast Fashion Brands KPI Dashboard in Excel, Online Furniture Retail KPI Dashboard in Excel and Retail Inventory KPI Scorecard in Excel. If you also run a home-improvement estate, the DIY Home Improvement Stores KPI Dashboard in Excel is the same scorecard tuned to that trade.
Frequently Asked Questions
Does the Discount Stores KPI Dashboard in Excel connect to my POS or ERP?
No. Nothing in the workbook talks to an external system. You type or paste 15 monthly numbers into three input sheets and the rest calculates. That is why it opens on any machine with no add-in, no gateway and no credentials.
How many KPIs does it track?
Fifteen, across five groups: Sales & Revenue (5), Store Operations (3), Supply Chain (3), Merchandising (3) and People (1). The Home page and Read Me still carry a stale “14 KPIs” line from an earlier revision – the calculations all use 15.
Will beating a shrink or markdown target show as a miss?
No. Those KPIs are flagged LTB, so achievement is Target ÷ Actual and coming in under plan scores above 100%. Four of the 15 KPIs are LTB: Shrink Rate, Freight Cost % of Sales, Markdown Rate and Employee Turnover.
Can I add my own KPIs?
Yes. The sheets are wired for 22 rows and 15 are used, so seven are live and empty. Fill the next row on KPI Definition, add its monthly numbers on the three input sheets, and the scorecard, trend picker and analysis page pick it up with no formula work. To go beyond 22, fill down the last data row on each sheet and widen the summary-card ranges on KPI Dashboard row 4 and the Support helper columns.
Does it need macros or a particular Excel version?
Neither. It is an ordinary .xlsx of worksheet formulas – VLOOKUP, MATCH, INDEX, COUNTIF – so there is no security prompt and no refresh step. Excel 2013 and later, Microsoft 365, and Excel for the web all open it.
What exactly is in the download?
A ZIP with two files: Discount Stores KPI Dashboard.xlsx and the Excel KPI Dashboard user manual as a PDF. One-time payment, lifetime access to the file.
About the Author
Built by PK – Microsoft Certified Professional with 15+ years of Excel, Google Sheets, and Power BI experience. Founder of NextGenTemplates, reaching 300K+ subscribers across YouTube channels. Every template is hand-built and tested before release.
Conclusion
Discount retail rewards operators who notice a small slip early. The Discount Stores KPI Dashboard in Excel is built for that specific job: fifteen governed KPIs, one month dropdown, MTD and YTD side by side, direction-aware scoring so cost KPIs are judged fairly, and a trend page and a group roll-up for when a light goes amber. It will not read your POS, it will not forecast, and it will not break down by store – and it does not pretend otherwise. What it will do is turn a scattered set of monthly numbers into a scorecard your board can read in ten seconds, for a one-time 19.99 and no subscription.
Get the Discount Stores KPI Dashboard in Excel on NextGenTemplates – the ZIP includes the workbook and the user manual, and the full 2025 sample year is already filled in so you can see it working before you type a thing.
For step-by-step Excel dashboard tutorials, subscribe to youtube.com/@PKAnExcelExpert.