In today’s competitive marketplace, efficient distribution management is essential for business success. Whether you manage logistics operations, oversee warehouse performance, or monitor order fulfillment, having the right data at your fingertips can transform decision-making.
That’s where the Distribution KPI Scorecard in Excel comes in — a powerful, ready-to-use template designed to track, analyze, and visualize key performance indicators (KPIs) for distribution operations.
This article will explore everything you need to know about this Excel-based scorecard — from its structure and features to its benefits, best practices, and frequently asked questions. Let’s dive in!
Click to Purchases Distribution KPI Scorecard in Excel
What Is a Distribution KPI Scorecard in Excel?
A Distribution KPI Scorecard in Excel is a performance management tool designed to monitor key distribution metrics across logistics, warehousing, inventory, and order fulfillment processes.
It consolidates essential KPIs into an easy-to-read Excel dashboard, allowing managers to identify performance gaps, track progress, and make data-driven decisions.
Built entirely in Microsoft Excel, this scorecard offers a simple yet powerful way to analyze performance. It combines numerical data, visual indicators, and interactive features to provide a complete picture of your distribution efficiency.
Click to Purchases Distribution KPI Scorecard in Excel
Why Do You Need a Distribution KPI Scorecard?
Managing a distribution network involves multiple moving parts — from transportation and warehouse operations to order accuracy and delivery timelines. Without a structured reporting system, it’s easy to lose track of what’s working and what’s not.
The Distribution KPI Scorecard helps you:
-
Monitor performance across departments and time periods.
-
Compare actual results vs. targets using dynamic visuals.
-
Analyze monthly trends with automated charts.
-
Simplify data entry through structured sheets.
-
Enhance decision-making with real-time insights.
With this template, you can transform raw data into actionable intelligence that supports productivity and cost efficiency.
Click to Purchases Distribution KPI Scorecard in Excel
Structure of the Distribution KPI Scorecard in Excel
The template includes four essential worksheets, each serving a unique purpose for data entry, visualization, and trend analysis. Let’s explore them one by one.
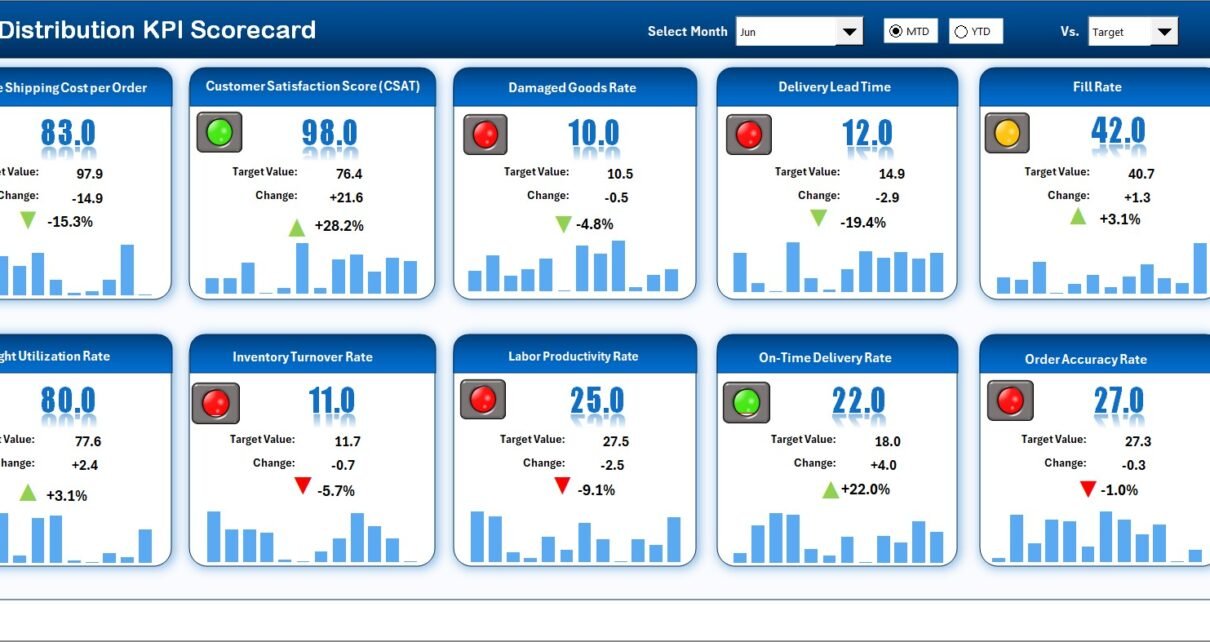
1. Scorecard Sheet – The Main Dashboard
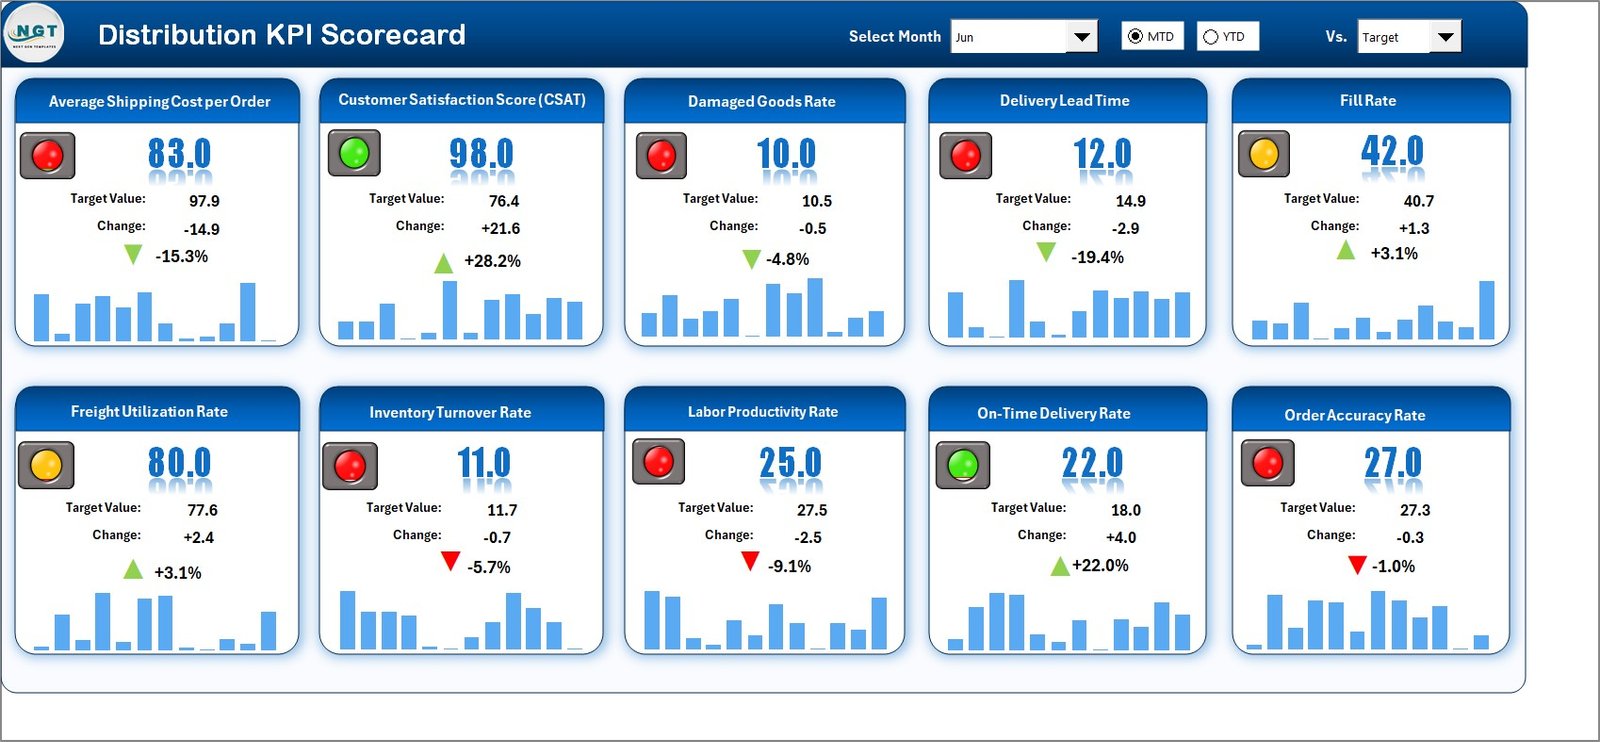
The Scorecard Sheet is the central hub of this Excel file. It provides a comprehensive snapshot of your KPIs in one place.
Key Features:
-
🎯 Dropdown Menus:
Easily select the Month, MTD (Month-to-Date), or YTD (Year-to-Date) view for performance analysis. -
📊 Actual vs Target Comparison:
Instantly compare your actual results with target values to see where you’re meeting goals and where improvement is needed. -
🟢🔴 Visual Indicators:
The sheet includes color-coded conditional formatting — green for good performance, red for poor — helping you identify performance status at a glance. -
📈 Comprehensive KPI Overview:
Get detailed insights into each KPI, including MTD, YTD, and percentage achievement data in one single view.
The Scorecard Sheet ensures that decision-makers can evaluate performance quickly and efficiently without switching between multiple files.
Click to Purchases Distribution KPI Scorecard in Excel
2. KPI Trend Sheet – Track Progress Over Time
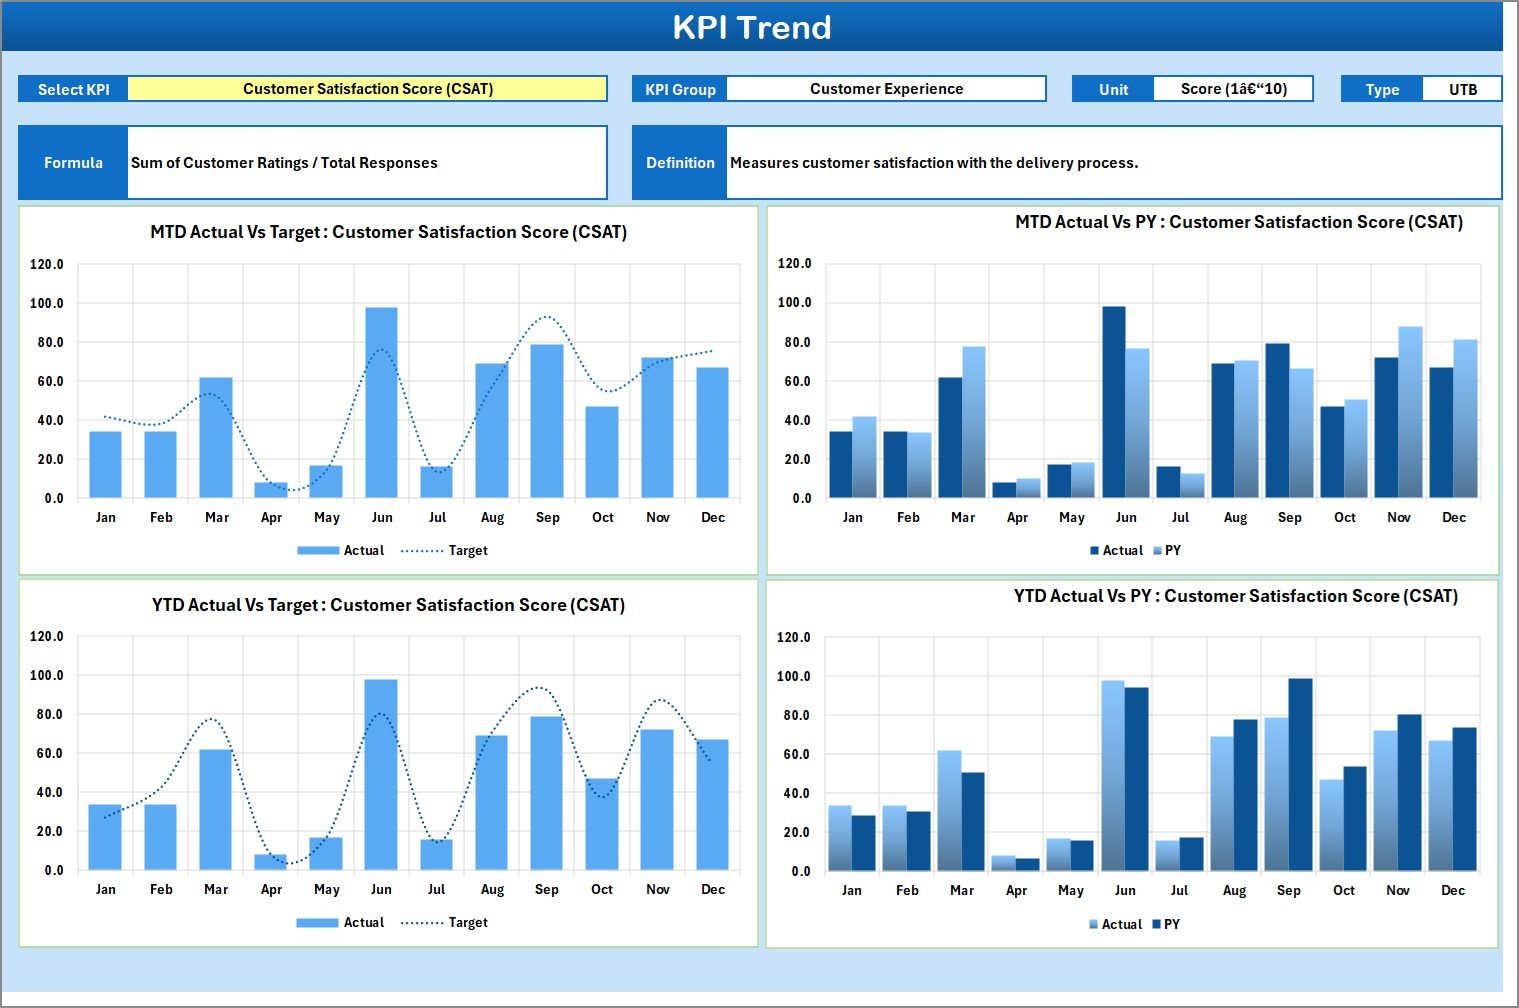
The KPI Trend Sheet provides a detailed breakdown of each KPI’s historical performance. It allows users to select a KPI name from a dropdown (cell C3) and analyze how it has evolved over time.
Features of the KPI Trend Sheet:
-
🔍 KPI Metadata:
View essential details such as KPI Group, Unit, Type (whether “Lower is Better” or “Upper is Better”), Formula, and Definition. -
📉 MTD and YTD Trend Analysis:
Visualize Month-to-Date and Year-to-Date performance for Actual, Target, and Previous Year (PY) data using interactive charts. -
🧭 Data-Driven Decision Making:
Identify long-term performance patterns, seasonal variations, and areas where corrective actions are needed.
The KPI Trend Sheet transforms raw data into meaningful trends, helping teams identify consistent strengths and recurring weaknesses.
3. Input Data Sheet – The Data Engine
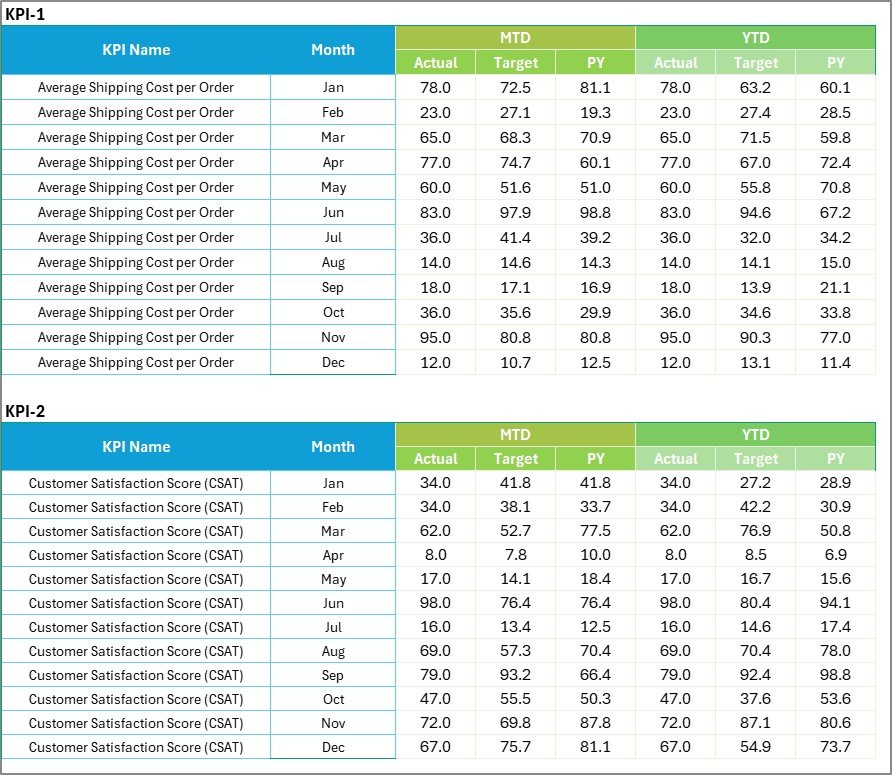
Every dashboard needs a reliable data foundation. The Input Data Sheet is the backbone of the Distribution KPI Scorecard, where you record and manage all KPI-related data.
Key Highlights:
-
✍️ Data Entry:
Enter KPI values such as Actual, Target, and Previous Year figures for each month. -
🔁 Flexibility:
The sheet allows you to easily add new records or update existing data without breaking formulas or visuals. -
📆 Timely Updates:
You can keep your scorecard current by regularly entering new performance data.
This sheet ensures all visuals in the dashboard remain dynamic and up to date, enabling real-time performance tracking.
4. KPI Definition Sheet – Establishing the Foundation
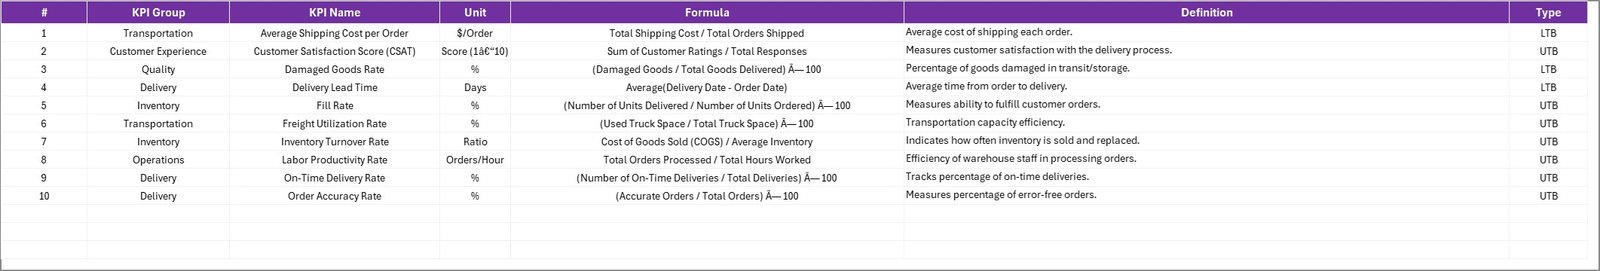
The KPI Definition Sheet is where you define and standardize all key performance indicators used in the scorecard. It promotes consistency and clarity across teams.
You can define:
-
KPI Name
-
KPI Group (e.g., Warehouse, Transportation, Order Management)
-
Unit of Measurement
-
Formula
-
Definition
This sheet helps avoid ambiguity and ensures everyone in the organization interprets each KPI in the same way.
Key KPIs You Can Track in the Distribution KPI Scorecard
The scorecard can be customized for your specific business needs. However, here are some common KPIs used in distribution management:
Operational KPIs
-
Order Fulfillment Rate (%): Measures the percentage of orders fulfilled without errors or delays.
-
On-Time Delivery (%): Evaluates how consistently deliveries meet the scheduled deadlines.
-
Backorder Rate (%): Tracks how often customer orders are delayed due to stock shortages.
-
Inventory Turnover Ratio: Indicates how frequently inventory is sold and replaced within a period.
Warehouse KPIs
-
Pick Accuracy (%): Measures how accurately orders are picked and packed.
-
Storage Utilization (%): Shows how efficiently warehouse space is being used.
-
Order Cycle Time (Days): Calculates the time between order receipt and dispatch.
-
Return Rate (%): Identifies the percentage of orders returned due to damage or errors.
Financial KPIs
-
Distribution Cost per Unit: Measures the total distribution cost for each unit shipped.
-
Freight Cost as % of Sales: Evaluates how much of your revenue goes toward freight expenses.
-
Profit per Order: Shows profitability on a per-order basis.
-
Damage Cost (%): Tracks losses from damaged goods during handling or shipping.
By customizing these KPIs, you can build a scorecard that aligns perfectly with your organization’s goals.
Advantages of Using a Distribution KPI Scorecard in Excel
The benefits of this Excel-based scorecard go far beyond visualization. Here’s how it adds value to your operations:
1. Centralized Performance Tracking
Instead of managing multiple reports, you can consolidate all performance metrics in one place. This simplifies analysis and reduces reporting time.
2. Instant Insights with Visuals
The use of charts, indicators, and slicers makes it easier to interpret data visually. You can spot trends, bottlenecks, and successes instantly.
3. Customizable and Scalable
The template is flexible. You can easily add new KPIs, modify formulas, or expand data ranges to accommodate future needs.
4. No Special Software Needed
Built entirely in Excel, this scorecard requires no additional software or coding knowledge. Anyone familiar with Excel can use it effectively.
5. Improved Decision-Making
With accurate data and visual indicators, managers can make timely and informed decisions to optimize distribution efficiency.
6. Enhanced Accountability
The clear tracking of targets vs. actuals ensures accountability across departments, motivating teams to achieve better results.
Click to Purchases Distribution KPI Scorecard in Excel
How to Use the Distribution KPI Scorecard Effectively
Here’s a quick step-by-step guide on how to get the most out of this Excel template:
-
Go to the KPI Definition Sheet and define all the KPIs relevant to your operations.
-
Enter data (Actual, Target, PY values) for each month in the Input Data Sheet.
-
Open the Scorecard Sheet and use the dropdowns to select your month and view performance results.
-
Review visual indicators to assess overall KPI health.
-
Navigate to the KPI Trend Sheet to view performance trends over time.
-
Regularly update your data to ensure the scorecard always reflects current performance.
By following these steps, you’ll have a real-time snapshot of your distribution operations, enabling proactive management.
Best Practices for the Distribution KPI Scorecard in Excel
To maximize the efficiency and accuracy of your scorecard, follow these best practices:
1. Define KPIs Clearly
Ensure every KPI has a clear definition, unit, and formula. This eliminates confusion and ensures everyone measures performance the same way.
2. Maintain Data Accuracy
Update data regularly and double-check for errors. Accurate data ensures meaningful analysis and reliable decision-making.
3. Use Conditional Formatting Wisely
Keep color indicators simple — for instance, green for good performance, red for poor, and yellow for average. Too many colors can confuse users.
4. Standardize Data Entry
Use consistent formats for dates, units, and metrics. This prevents calculation errors and keeps reports clean.
5. Back Up Regularly
Since Excel files can be overwritten or corrupted, save backup copies to maintain your data history.
6. Review Trends Monthly
Regularly monitor trends in the KPI Trend Sheet to identify early warning signs or opportunities for optimization.
7. Link KPIs to Business Goals
Always ensure that each KPI supports a larger organizational objective, such as cost reduction, speed improvement, or customer satisfaction.
8. Train Your Team
Train key users on how to update, read, and interpret the scorecard. A well-informed team will make better use of the data.
Tips for Customizing the Template
-
🧩 Add Filters or Slicers: For departments, product categories, or regions.
-
📅 Include a Date Selector: To make trend analysis easier.
-
📈 Add Pivot Charts: For deeper KPI insights.
-
📦 Expand KPI Definitions: Add performance benchmarks or responsible owners.
-
💾 Protect Formulas: Lock cells containing critical formulas to prevent accidental changes.
Customization makes your Distribution KPI Scorecard more relevant to your unique business needs.
Conclusion
The Distribution KPI Scorecard in Excel is more than just a reporting tool — it’s a performance powerhouse for modern logistics and supply chain teams.
By offering real-time visibility, actionable insights, and dynamic visuals, it helps organizations stay on top of their distribution goals and streamline operations.
Whether you manage a small warehouse or a large-scale distribution network, this Excel template simplifies tracking, promotes accountability, and supports continuous improvement.
With proper implementation and regular updates, it becomes your go-to system for smarter distribution management.
Click to Purchases Distribution KPI Scorecard in Excel
Frequently Asked Questions (FAQs)
1. What is a Distribution KPI Scorecard?
A Distribution KPI Scorecard is a structured Excel tool that tracks key performance indicators such as delivery time, cost, and order accuracy to evaluate distribution performance.
2. How does this template help improve performance?
It provides visual insights into targets versus actual performance, helping teams identify problem areas quickly and take corrective action.
3. Can I customize the KPIs in this scorecard?
Yes, you can easily modify or add new KPIs by updating the KPI Definition and Input Data sheets according to your business needs.
4. Does it require advanced Excel skills?
No, the template is designed to be user-friendly. Basic Excel knowledge is enough to navigate, enter data, and analyze performance.
5. What’s the difference between MTD and YTD in this scorecard?
MTD (Month-to-Date) shows progress within the current month, while YTD (Year-to-Date) represents performance since the beginning of the year.
6. Can this scorecard handle multiple distribution centers?
Yes, you can include filters or slicers by region, branch, or warehouse to monitor multiple locations.
7. How often should I update the data?
It’s best to update data monthly or weekly, depending on your reporting cycle, to maintain accuracy and relevance.
8. Is this template suitable for small businesses?
Absolutely. It’s designed for flexibility, so both small and large organizations can use it effectively without needing specialized software.
9. Can I use this scorecard in Google Sheets?
Yes, you can upload it to Google Sheets for cloud-based collaboration, though some Excel-specific formulas may need minor adjustments.
10. Where can I get this Distribution KPI Scorecard template?
You can download it from NextGenTemplates.com, where it’s available as a ready-to-use Excel file complete with sample KPIs and dynamic visuals.
Click to Purchases Distribution KPI Scorecard in Excel
Visit our YouTube channel to learn step-by-step video tutorials