In today’s business world, diversity and inclusion (D&I) are no longer just buzzwords. They are essential pillars that drive organizational growth, innovation, and long-term success.Diversity & Inclusion KPI Dashboard in Excel A workforce that embraces diversity and ensures inclusion benefits from unique perspectives, stronger collaboration, and better decision-making.
However, simply talking about D&I is not enough. Companies must measure, monitor, and improve their progress in a systematic way. This is where a Diversity & Inclusion KPI Dashboard in Excel comes in.
This ready-to-use Excel tool helps HR managers, leaders, and decision-makers track key metrics, analyze workforce diversity, and assess the effectiveness of inclusion strategies. In this article, we will explore everything you need to know about this dashboard: its features, benefits, use cases, and best practices.
Click to Purchases Diversity & Inclusion KPI Dashboard in Excel
What Is a Diversity & Inclusion KPI Dashboard in Excel?
A Diversity & Inclusion KPI Dashboard is a performance management tool that consolidates key data into one central place. Instead of scattered reports or manual calculations, the dashboard provides interactive charts, tables, and performance indicators.
By using Excel, which is familiar to most professionals, organizations can easily measure KPIs such as gender ratio, representation by ethnicity, recruitment diversity, retention rates, pay equity, and employee engagement.
With this tool, leaders can quickly identify gaps, compare actual performance against targets, and make informed decisions to promote diversity and inclusion.
Key Features of the Diversity & Inclusion KPI Dashboard
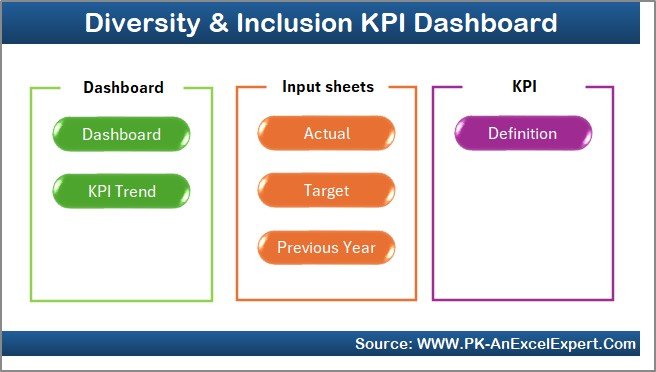
We have created a ready-to-use Diversity & Inclusion KPI Dashboard in Excel that consists of seven worksheets. Each sheet plays a specific role to ensure smooth data flow and accurate reporting.
1. Home Sheet
-
Works as an index sheet.
-
Contains 6 buttons for quick navigation to the respective worksheets.
-
Provides a structured entry point for users.
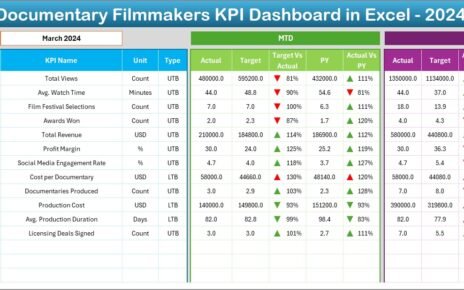
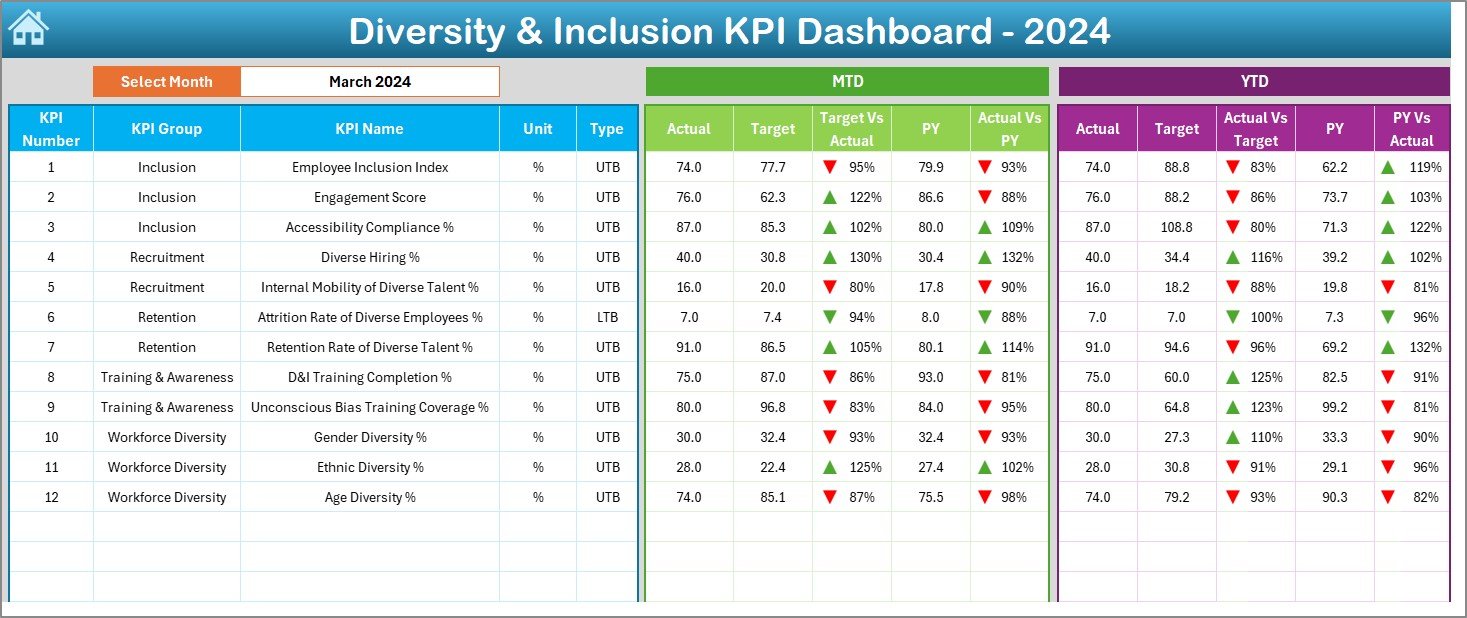
2. Dashboard Sheet
-
The main visualization sheet.
-
Includes a month selector (cell D3) to filter data by month.
-
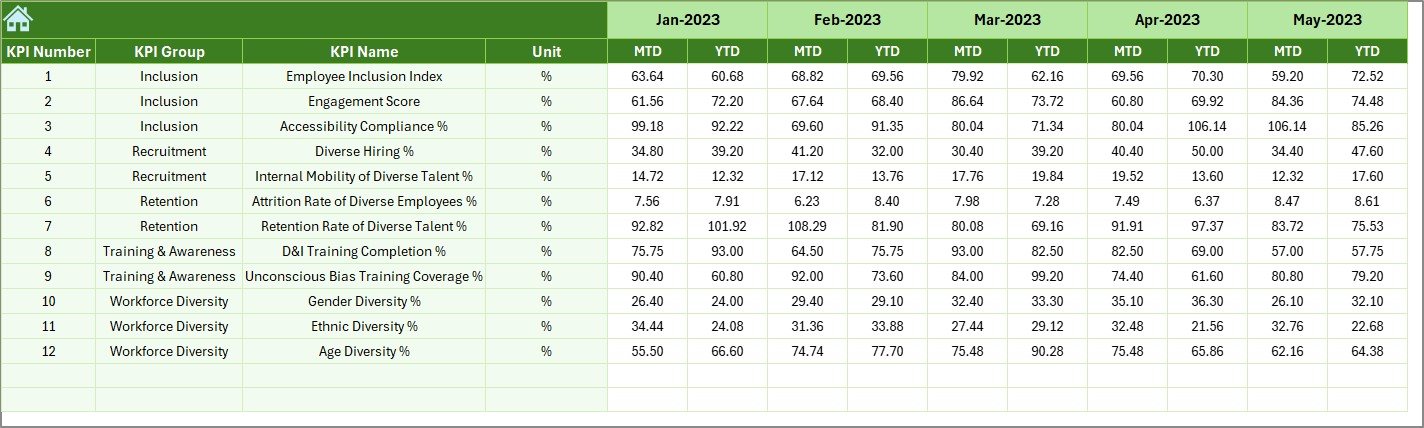
Displays MTD (Month-to-Date) and YTD (Year-to-Date) performance.
-
Compares Actual vs Target and Previous Year vs Actual with conditional formatting (green/red arrows).
-
Offers a clear, real-time performance snapshot.
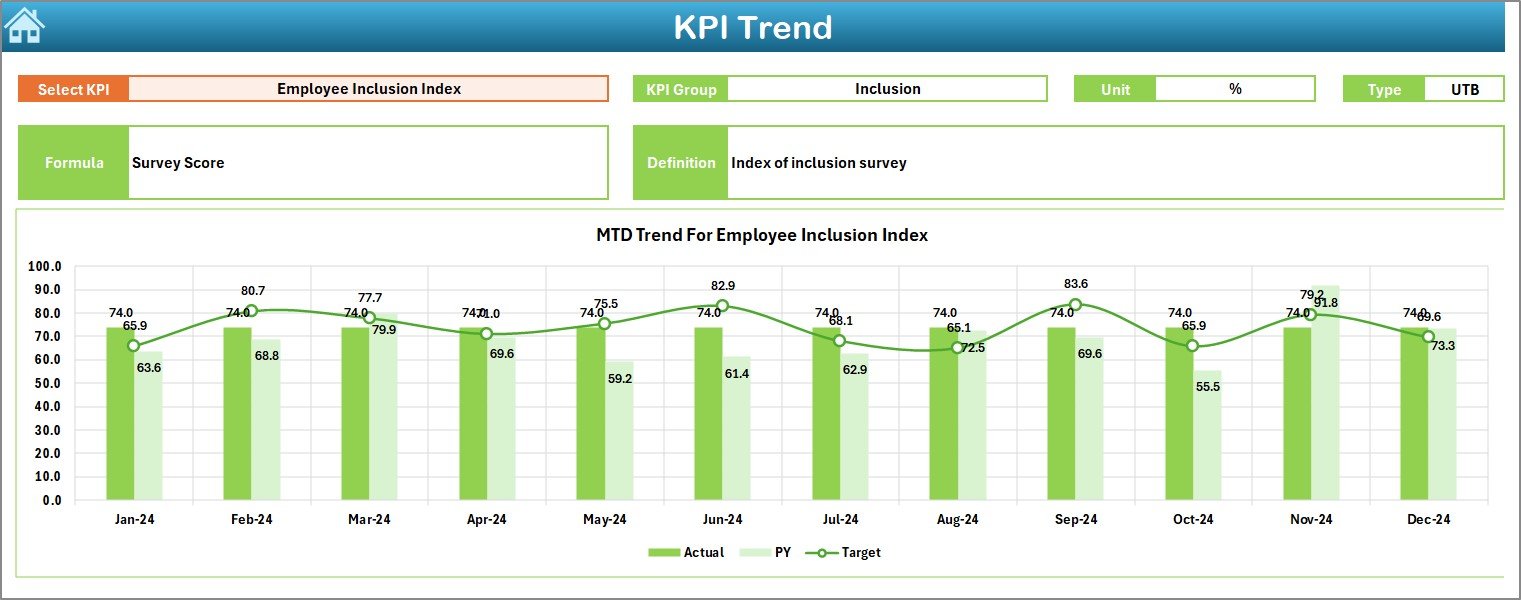
3. KPI Trend Sheet
-
Enables users to select a specific KPI (drop-down in cell C3).
-
Displays KPI Group, Unit, Type (UTB or LTB), Formula, and Definition.
-
Provides trend charts for MTD and YTD data across Actual, Target, and Previous Year values.
-
Helps spot long-term patterns in diversity and inclusion metrics.
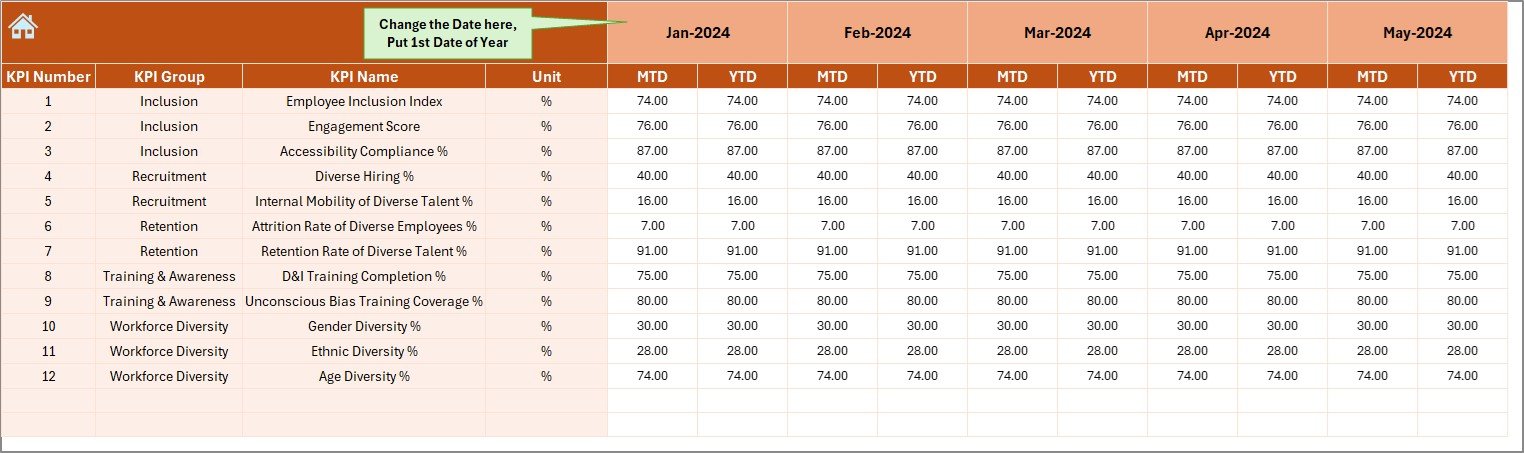
4. Actual Numbers Input Sheet
-
Input area for monthly actual numbers.
-
Flexible month selection in cell E1.
-
Allows users to maintain data consistently throughout the year.
5. Target Sheet
-
Records monthly and yearly targets for each KPI.
-
Ensures clarity when comparing goals against achievements.
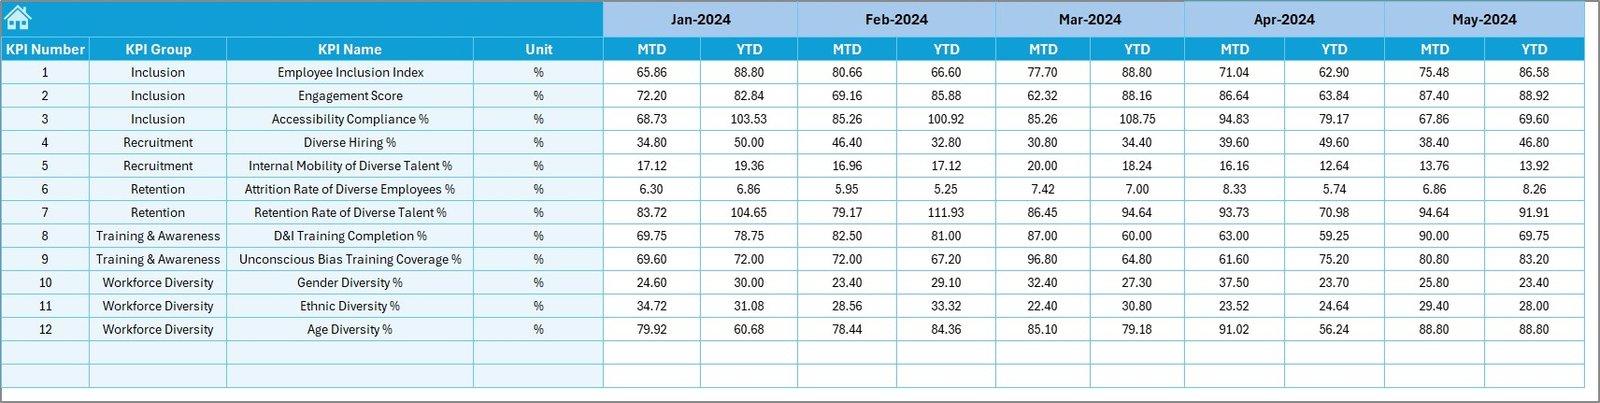
6. Previous Year Numbers Sheet
-
Stores historical data from the previous year.
-
Useful for identifying year-on-year improvements or declines.
7. KPI Definition Sheet
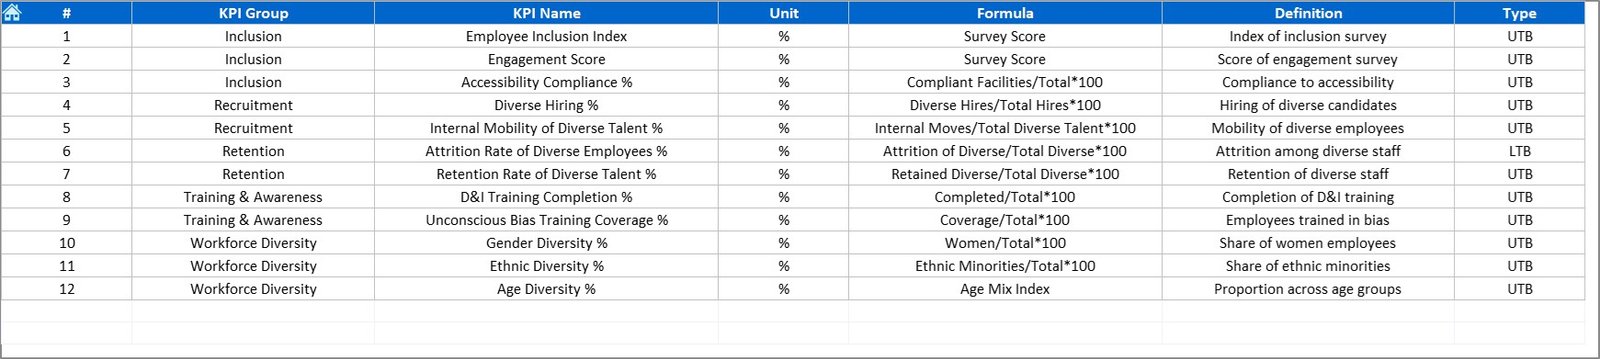
-
Contains all KPI details: Name, Group, Unit, Formula, and Definition.
-
Acts as a reference sheet for both new and experienced users.
Why Do Companies Need a Diversity & Inclusion Dashboard?
Organizations often make commitments to diversity and inclusion, but without measurable data, those commitments may remain symbolic. A KPI dashboard provides the data-driven insights needed to:
-
Ensure accountability at leadership and HR levels.
-
Identify strengths and areas for improvement.
-
Build trust with employees and stakeholders by being transparent.
-
Track progress over time with clear visualizations.
-
Align D&I efforts with business goals.
Advantages of Diversity & Inclusion KPI Dashboard in Excel
Implementing this Excel-based tool brings multiple benefits:
✅ Centralized Data – Combines all KPIs into one interface.
✅ Ease of Use – Excel is widely used and requires no expensive software.
✅ Customizable – Easily adaptable to your company’s unique KPIs.
✅ Real-Time Insights – Quick updates with input sheets.
✅ Better Decision-Making – Leaders can base strategies on actual data, not assumptions.
✅ Improved Transparency – Builds credibility with employees and stakeholders.
Important Diversity & Inclusion KPIs to Track
Some of the key metrics that organizations can monitor with this dashboard include:
-
Gender Ratio – Male vs Female distribution in the workforce.
-
Ethnic Representation – Diversity across different cultural backgrounds.
-
Pay Equity – Salary comparisons between different groups.
-
Recruitment Diversity – % of hires from underrepresented groups.
-
Retention Rates – How well diverse employees stay with the company.
-
Promotion Rates – Advancement opportunities across groups.
-
Leadership Diversity – Representation in senior roles.
-
Employee Engagement – Inclusion reflected in satisfaction scores.
Best Practices for Using a Diversity & Inclusion KPI Dashboard
To maximize the impact of this tool, follow these best practices:
🔹 Define Clear KPIs – Ensure every metric has a clear definition and formula.
🔹 Update Data Regularly – Input actual numbers monthly to keep the dashboard accurate.
🔹 Compare Against Targets – Use targets to measure success instead of raw numbers alone.
🔹 Analyze Trends – Focus on patterns over time, not just one-off figures.
🔹 Share Insights Transparently – Present the dashboard to leadership and employees.
🔹 Use It for Action – Data should drive initiatives such as training, hiring policies, and leadership programs.
Real-World Use Cases of Diversity & Inclusion Dashboards
Many organizations can benefit from using this dashboard:
-
HR Teams – Track hiring, retention, and promotion fairness.
-
Leadership Teams – Monitor progress against D&I commitments.
-
Employees – Gain confidence in the company’s inclusiveness.
-
External Stakeholders – Show transparency in reporting diversity data.
How to Get Started with the Dashboard
-
Download the Template – Use the ready-to-use Excel dashboard.
-
Customize the KPI Definition Sheet – Add or adjust KPIs to match company priorities.
-
Input Targets – Enter realistic monthly and yearly goals.
-
Feed Actual Data – Collect monthly data and update the input sheet.
-
Review Trends – Analyze KPI performance in the trend and dashboard sheets.
-
Take Action – Use the insights to design policies that promote inclusiveness.
Conclusion
Diversity and inclusion are vital for building modern, resilient, and innovative organizations. A Diversity & Inclusion KPI Dashboard in Excel offers a cost-effective and practical solution to measure progress, identify gaps, and strengthen initiatives.
By centralizing KPIs, automating comparisons, and visualizing trends, this dashboard enables organizations to take data-driven actions that create real impact. Companies that embrace such tools not only foster inclusive workplaces but also position themselves as industry leaders in equality and innovation.
Click to Purchases Diversity & Inclusion KPI Dashboard in Excel
Frequently Asked Questions (FAQs)
1. What is the purpose of a Diversity & Inclusion KPI Dashboard?
It helps organizations track and measure key diversity and inclusion metrics in one place, ensuring accountability and transparency.
2. Can this dashboard be customized for my company?
Yes, you can easily edit KPIs, targets, and data inputs to align with your company’s needs.
3. How often should I update the data?
It is best to update monthly for MTD and YTD tracking.
4. Do I need advanced Excel skills to use it?
No. The dashboard is user-friendly with drop-down menus and automated formulas.
5. Which KPIs should I track for diversity?
Common KPIs include gender ratio, ethnic representation, pay equity, recruitment diversity, retention, and promotion rates.
6. Can small businesses use this dashboard?
Yes, even small organizations can benefit since Excel requires no extra cost or complex setup.
7. Why is comparing with the previous year important?
It helps identify progress or decline over time and provides context for current results.
Visit our YouTube channel to learn step-by-step video tutorials
Click to Purchases Diversity & Inclusion KPI Dashboard in Excel
Watch the step-by-step video tutorial: