Managing a DIY home improvement store becomes more challenging every year. Customers expect faster service, competitive prices, and greater product availability. Store owners also want to track sales, returns, profit margins, and customer satisfaction without switching between dozens of spreadsheets. Because of this, many businesses search for a simple yet powerful reporting system that helps them make quick decisions.
A DIY Home Improvement Stores Dashboard in Excel solves this problem. It brings every key metric together in one place and offers a clear, visual, and interactive way to analyze performance. Since Excel is easy to use and available for most users, this dashboard becomes a practical and reliable solution for store managers, analysts, and business owners.
In this article, you will learn everything about the DIY Home Improvement Stores Dashboard in Excel—its structure, features, advantages, best practices, and answers to the most common questions.
Click to Purchases DIY Home Improvement Stores Dashboard in Excel
What Is a DIY Home Improvement Stores Dashboard in Excel?
A DIY Home Improvement Stores Dashboard in Excel is a ready-to-use reporting tool that tracks daily, weekly, and monthly performance of home improvement stores. It organizes data related to orders, customers, profit margins, suppliers, regions, product categories, and customer satisfaction into a clean and interactive Excel interface.
Because the dashboard uses slicers, drop-down lists, charts, and conditional formatting, it helps store managers understand which stores perform well, which customer types generate higher profits, and which regions need more focus. As a result, leaders can make faster decisions and plan better strategies.
Why Do DIY Home Improvement Stores Need a Dashboard?
DIY store operations involve multiple functions—sales, inventory, suppliers, customer service, and regional branches. When data sits in scattered files or manual reports, decision-making slows down.
However, a well-structured Excel dashboard offers the following benefits:
-
It centralizes all important KPIs in one view.
-
It highlights real-time performance trends.
-
It shows problem areas before they impact business.
-
It reduces manual data entry and repetitive tasks.
-
It allows easy comparisons across stores, regions, and customer groups.
Because of these advantages, many retail companies consider Excel dashboards essential for their day-to-day operations.
Click to Purchases DIY Home Improvement Stores Dashboard in Excel
Key Features of the DIY Home Improvement Stores Dashboard in Excel
This dashboard contains five interactive analysis pages, a page navigator, and additional supporting sheets. Every page focuses on a different dimension of business performance.
Below is an expanded and improved explanation of your already written information.
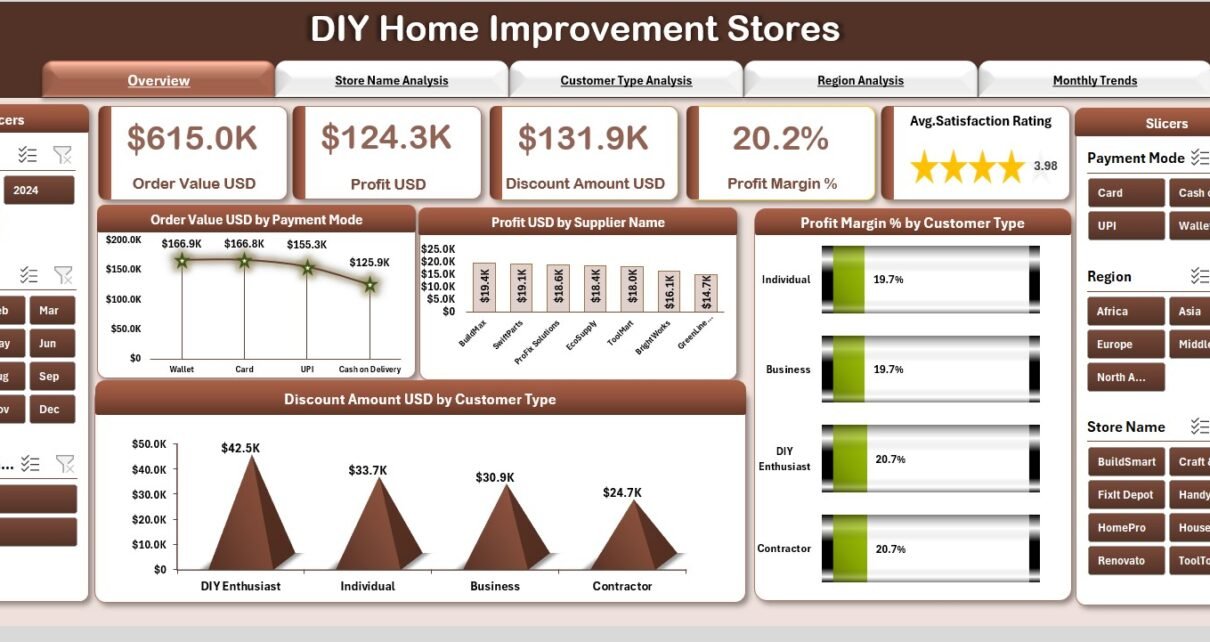
1. Overview Page – The Main Summary of Store Performance

The Overview Page acts as the central hub of the dashboard. Users can select filters using the right-side slicer panel, which may include:
-
Month
-
Region
-
Store Name
-
Customer Type
-
Supplier
-
Payment Mode
Because of these slicers, managers can instantly view performance for any period or business segment.
The page contains five KPI cards, such as:
-
Total Order Value (USD)
-
Total Profit (USD)
-
Average Profit Margin (%)
-
Total Discount Amount (USD)
-
Orders Returned (%)
Below the cards, the dashboard displays four essential charts:
-
Order Value (USD) by Payment Mode – Understand customer payment preferences.
-
Profit (USD) by Supplier Name – Identify suppliers that produce better margins.
-
Profit Margin (%) by Customer Type – See which segments are most profitable.
-
Discount Amount (USD) by Customer Type – Track how discounts impact customer groups.
These visuals help users quickly identify opportunities and issues.
2. Store Name Analysis – Compare the Performance of Different Stores
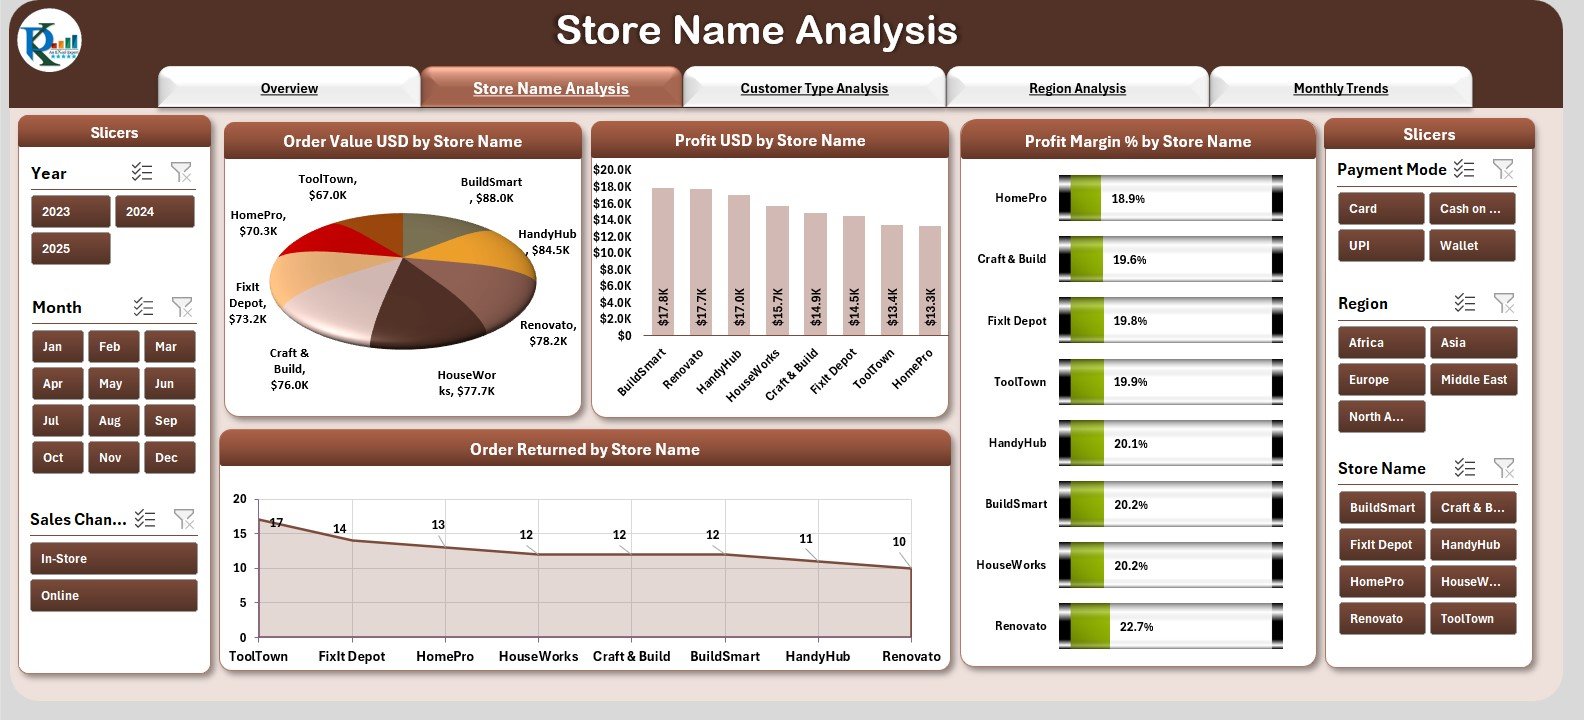
This page helps store owners analyze performance across multiple branches. Since each store operates in different locations, comparing them becomes important for growth and consistency.
You will find four key charts:
-
Order Value (USD) by Store Name – Shows which stores generate the highest sales.
-
Profit (USD) by Store Name – Helps identify high- and low-performing locations.
-
Profit Margin (%) by Store Name – Tracks operational efficiency.
-
Order Returned by Store Name – Highlights quality or operational issues.
Because the page focuses only on store-level performance, leaders can decide:
-
Which stores need training?
-
Which stores require more inventory?
-
Which stores deserve reward or recognition?
3. Customer Type Analysis – Understand Customer Behavior More Clearly

Every DIY store deals with different customer groups such as:
-
Homeowners
-
Contractors
-
Interior Designers
-
Electricians
-
Plumbers
Understanding their behavior helps increase sales and customer satisfaction.
This page includes four detailed charts:
-
Order Returned by Customer Type – Identify customer groups with higher return rates.
-
Order Value (USD) by Customer Type – Understand who buys more frequently.
-
Average Satisfaction Rating by Customer Type – Monitor service quality.
-
Order Pending (%) by Customer Type – Track delays or service issues.
Because of this analysis, store owners can plan targeted promotions, modify service strategies, and set better pricing.
Click to Purchases DIY Home Improvement Stores Dashboard in Excel
4. Region Analysis – Monitor Performance Across All Regions
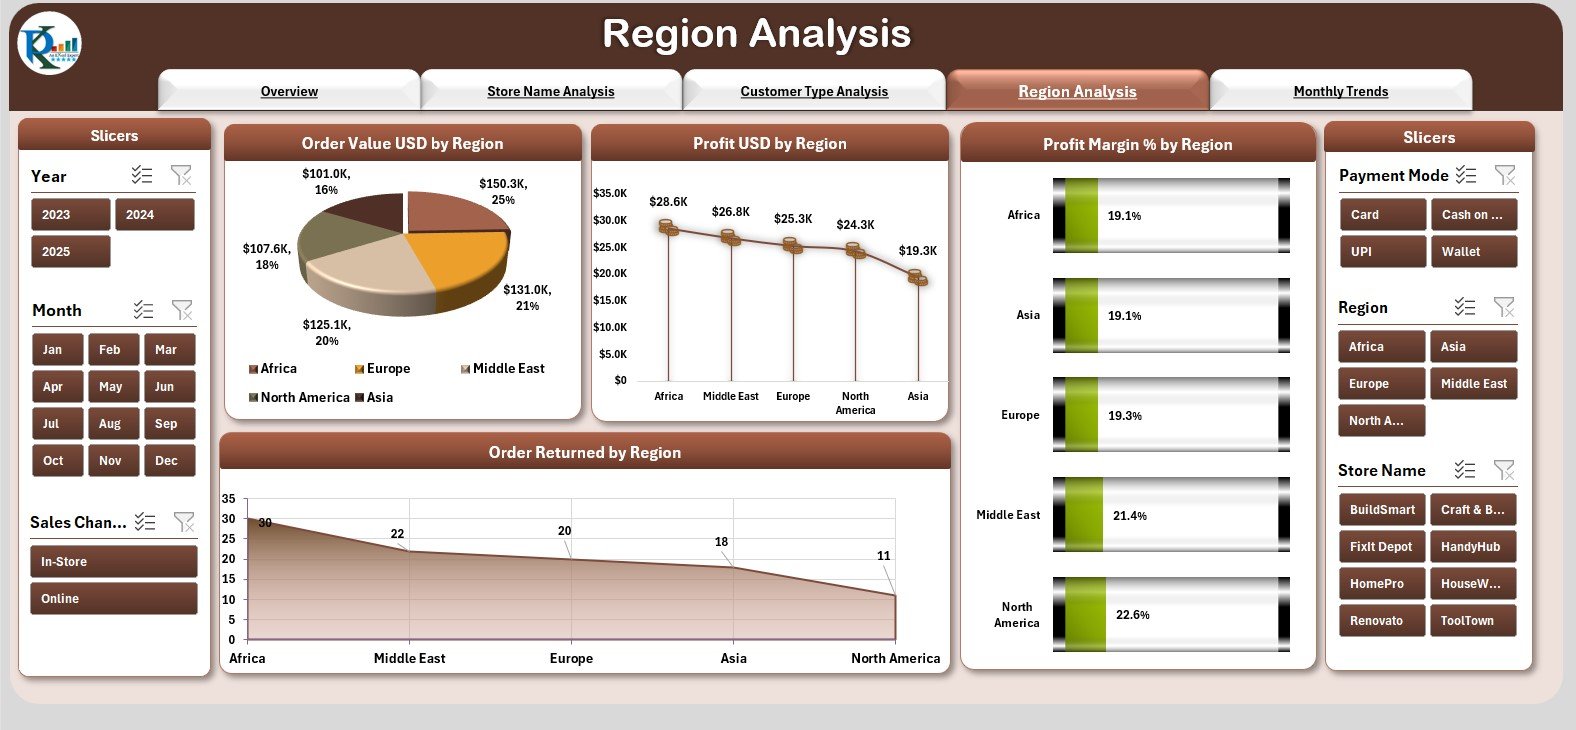
DIY home improvement stores often operate in different regions. Each region shows different sales trends, customer behavior, and profit levels.
The Region Analysis page includes four powerful charts:
-
Order Value (USD) by Region – Shows which regions are growing.
-
Profit (USD) by Region – Highlights strong and weak territories.
-
Profit Margin (%) by Region – Helps track business efficiency across regions.
-
Order Returned by Region – Detects areas with product or service complaints.
This page supports region-specific planning, marketing strategies, and inventory decisions.
5. Monthly Trends – Track Performance Month by Month
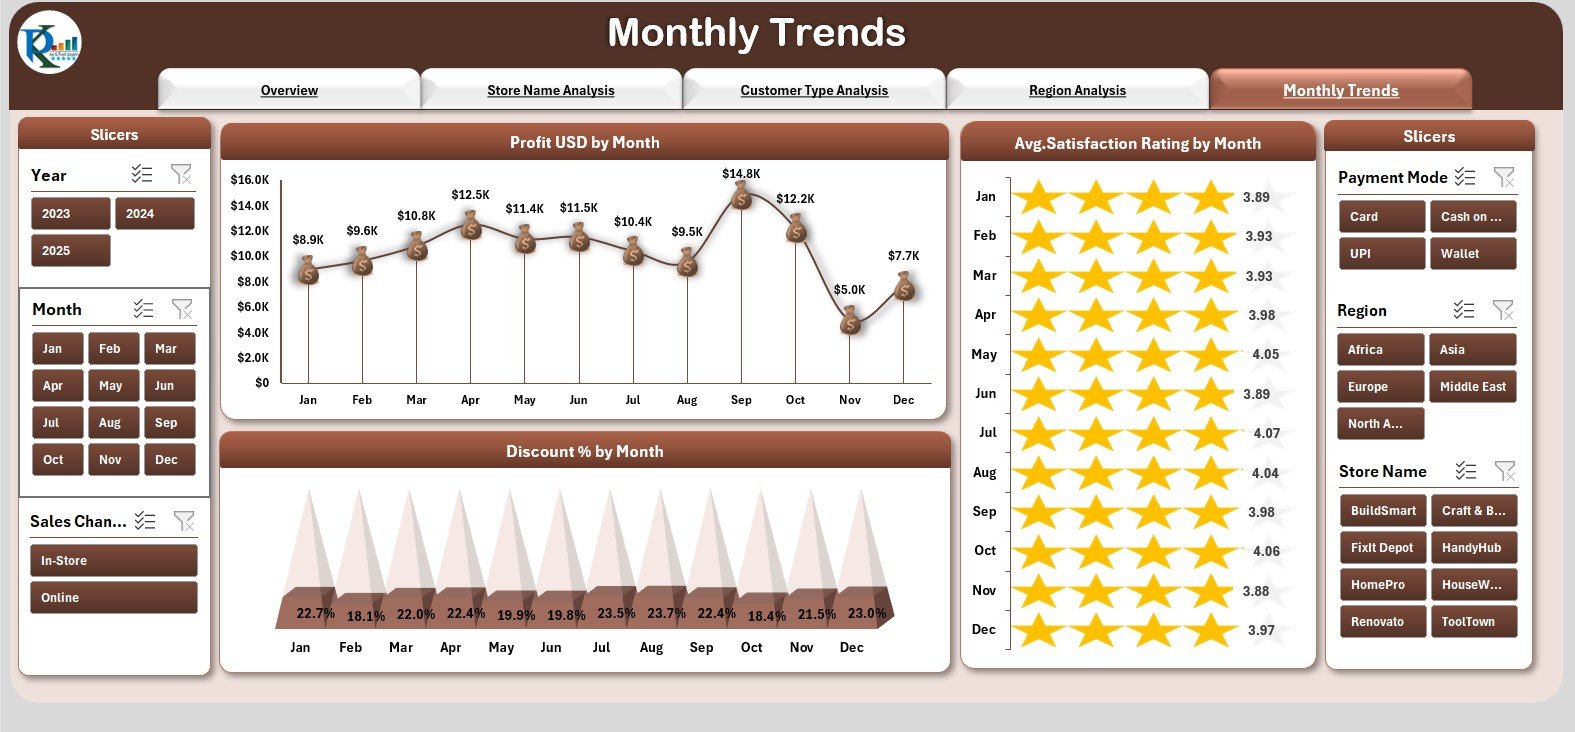
The Monthly Trends page helps stores stay updated on seasonal patterns and monthly business performance.
It includes three important charts:
-
Profit (USD) by Month – Tracks monthly profit trends.
-
Average Satisfaction Rating by Month – Shows how customer experience changes.
-
Discount (%) by Month – Helps identify seasonal promotions and discount strategies.
Because trends change every month, this page offers continuous feedback for improving business operations.
Support Sheet
The support sheet contains helper tables such as:
-
Dropdown lists
-
KPI mappings
-
Color codes
-
Lookup values
It ensures smooth functioning of the dashboard without affecting user data.
Data Sheet
The Data Sheet is the heart of the dashboard. It stores all raw data such as:
-
Order details
-
Payment mode
-
Region
-
Store name
-
Discount
-
Customer type
-
Profit
-
Supplier
-
Satisfaction rating
-
Returned status
Since all charts and KPIs depend on clean data, the Data Sheet forms the backbone of dashboard calculations.
Click to Purchases DIY Home Improvement Stores Dashboard in Excel
Advantages of the DIY Home Improvement Stores Dashboard in Excel
This dashboard offers many advantages that help store owners and managers make better decisions.
1. Clear View of Overall Performance
The dashboard brings all KPIs together, so business leaders see real-time performance at a glance.
2. Faster Decision-Making
Because visuals present data clearly, store owners can make decisions without analyzing multiple spreadsheets.
3. Better Customer Insights
The Customer Type Analysis page shows buying patterns, satisfaction scores, and return behavior.
4. Improved Store Comparison
Leaders can compare store sales, profit margins, and return rates quickly.
5. Region-Wise Planning
The Region Analysis page helps managers focus on underperforming regions.
6. Easy to Use and No Technical Skills Required
Since the dashboard is built in Excel, anyone can use it without special training.
7. Saves Time and Reduces Manual Efforts
Automated charts and KPIs reduce the need for repeated calculations.
8. Helps Improve Profitability
Understanding discount patterns, store performance, and supplier margins leads to better profitability.
Click to Purchases DIY Home Improvement Stores Dashboard in Excel
Best Practices for Using the DIY Home Improvement Stores Dashboard
To get the maximum benefit from the dashboard, store owners must follow the best practices below.
1. Update the Data Sheet Regularly
Always keep your order data and customer details updated.
2. Review Monthly Trends
Check monthly trends to plan seasonal promotions and improve customer experience.
3. Track Store-Level Performance Weekly
This helps identify issues at early stages.
4. Compare Regions Frequently
Regional differences highlight opportunities for growth.
5. Monitor Customer Satisfaction Closely
High satisfaction leads to repeated business and brand loyalty.
6. Use Slicers for Deeper Analysis
Slicers help you filter data quickly and find hidden insights.
7. Review Supplier Profit Margins
Some suppliers may bring higher profit; plan purchases accordingly.
8. Analyze Discount Impact
Check how discounts influence sales and profit.
Conclusion
A DIY Home Improvement Stores Dashboard in Excel offers a powerful and practical way to visualize store performance. Because it brings all data together in one place, managers can understand customer behavior, store performance, monthly trends, and region-wise growth instantly. With proper usage, this dashboard helps improve efficiency, reduce cost, increase profit, and create a better customer experience.
Whether you own a small local store or a chain of DIY stores, this dashboard becomes a valuable tool for your business growth.
Click to Purchases DIY Home Improvement Stores Dashboard in Excel
Frequently Asked Questions (FAQs)
1. What is a DIY Home Improvement Stores Dashboard in Excel?
It is a ready-to-use Excel template that tracks store performance, customer behavior, profit margins, and monthly trends using interactive charts and slicers.
2. Who can use this dashboard?
Store owners, analysts, managers, regional heads, and anyone who wants to monitor the performance of a DIY retail store.
3. Do I need advanced Excel skills to use it?
No, the dashboard is easy to use. You only update the data and refresh the charts.
4. What type of data does this template support?
Order value, customer types, discounts, supplier names, payment modes, regions, satisfaction ratings, and more.
5. Can I customize the dashboard?
Yes, you can edit colors, add charts, rename KPIs, or insert additional slicers depending on your needs.
6. Does the dashboard show store performance month-wise?
Yes, the Monthly Trends page helps you track profit, satisfaction rating, and discount patterns across months.
7. Can I use this dashboard for multiple stores?
Yes, the Store Name Analysis page displays performance for each store separately.
Click to Purchases DIY Home Improvement Stores Dashboard in Excel
Visit our YouTube channel to learn step-by-step video tutorials