Drone services are growing rapidly across industries such as agriculture, construction, surveying, logistics, infrastructure inspection, and media production. However, as drone operations scale, tracking performance using scattered spreadsheets becomes difficult. As a result, managers lose visibility, KPIs become unclear, and decisions slow down.
That is exactly why a Drone Services KPI Dashboard in Excel becomes a powerful and practical solution.
In this detailed blog post, you will learn what a Drone Services KPI Dashboard in Excel is, why it matters, how it works, and how drone businesses can use it to improve efficiency, profitability, and operational control. Moreover, this article covers dashboard structure, advantages, best practices, use cases, and frequently asked questions to help you implement it confidently.
Click to Purchases Drone Services KPI Dashboard in Excel
What Is a Drone Services KPI Dashboard in Excel?
A Drone Services KPI Dashboard in Excel is a ready-to-use performance management tool designed to track, analyze, and visualize key performance indicators related to drone operations.
Instead of reviewing raw data across multiple sheets, this dashboard converts drone service data into clear KPIs, trend charts, comparisons, and visual indicators. As a result, drone operators, managers, and business owners gain instant insight into operational health.
Additionally, because the dashboard is built entirely in Excel, it remains cost-effective, customizable, and easy to maintain.
Why Do Drone Service Providers Need a KPI Dashboard?
Drone operations involve multiple moving parts such as flight hours, mission success rates, turnaround time, revenue, costs, compliance, and client satisfaction. However, without a centralized dashboard, tracking these metrics becomes time-consuming.
A KPI dashboard solves this challenge by:
-
Centralizing all drone KPIs in one place
-
Highlighting target achievement and gaps clearly
-
Comparing current performance with previous year data
-
Supporting faster and more accurate decisions
-
Reducing manual reporting effort
As a result, drone businesses shift from reactive management to proactive control.
How Does the Drone Services KPI Dashboard in Excel Work?
The dashboard follows a simple and logical workflow.
First, users enter actual, target, and previous year values into dedicated input sheets. Then, Excel formulas, conditional formatting, and charts calculate KPIs automatically. Finally, the dashboard updates visuals dynamically based on selected month or KPI.
Because of this design, even non-technical users can manage the dashboard easily.
What Worksheets Are Included in the Drone Services KPI Dashboard?
This KPI dashboard contains seven structured worksheets, each serving a specific purpose.
What Is the Purpose of the Home Sheet?
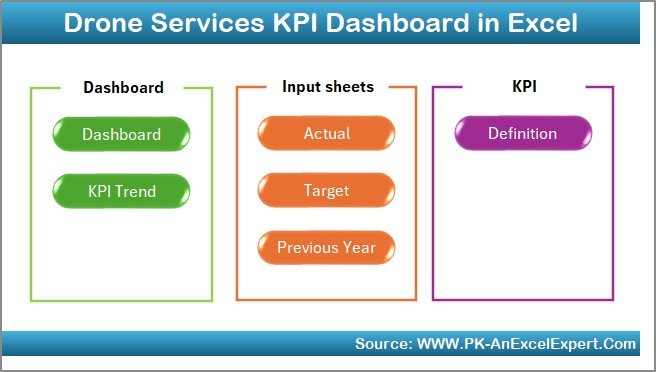
The Home Sheet acts as an index and navigation hub.
On this sheet, users see six navigation buttons that allow quick movement to key sections of the dashboard. As a result, users avoid scrolling or searching through tabs and navigate instantly.
This design improves usability, especially for senior stakeholders.
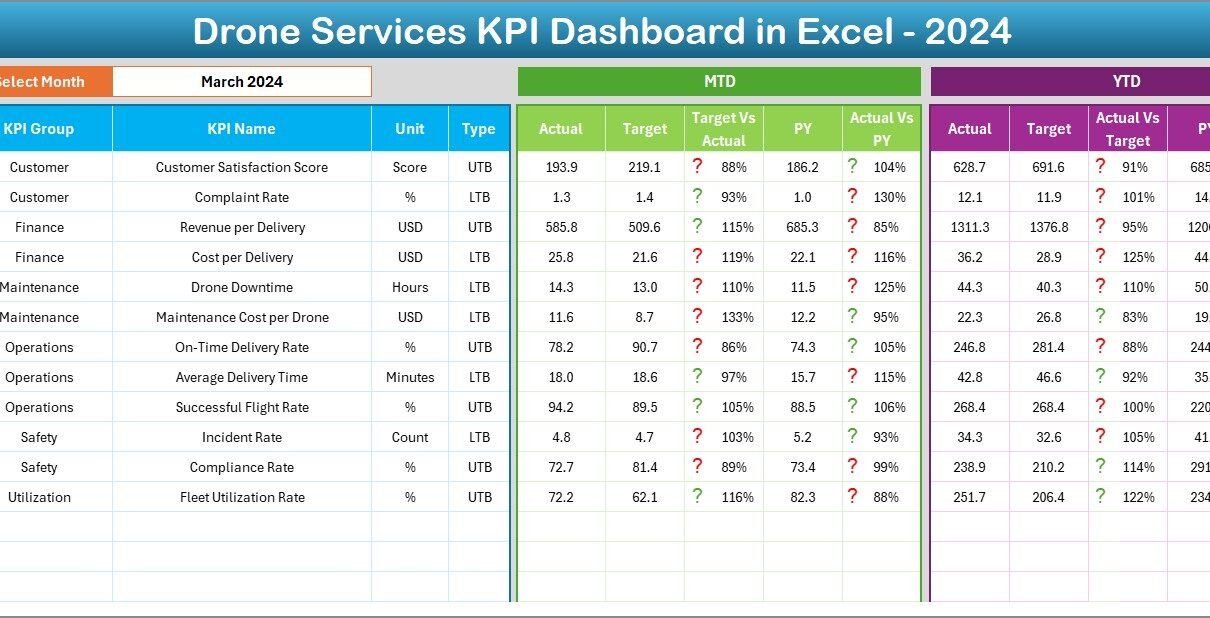
What Does the Dashboard Sheet Show?

The Dashboard Sheet is the core of the KPI dashboard.
How Does Month Selection Work?
On cell D3, users select the reporting month from a drop-down list. Once selected, the entire dashboard updates automatically for that month.
This feature allows fast month-wise performance analysis without manual filtering.
What KPIs Are Displayed on the Dashboard?
The dashboard displays both MTD (Month-to-Date) and YTD (Year-to-Date) metrics, including:
MTD Section
-
MTD Actual
-
MTD Target
-
MTD Previous Year
-
Target vs Actual %
-
Previous Year vs Actual %
-
Conditional formatting arrows (▲ ▼)
YTD Section
-
YTD Actual
-
YTD Target
-
YTD Previous Year
-
Target vs Actual %
-
Previous Year vs Actual %
-
Conditional formatting arrows (▲ ▼)
Because of these indicators, users instantly identify overperforming and underperforming KPIs.
How Does Conditional Formatting Improve Analysis?
Conditional formatting uses green upward arrows and red downward arrows to indicate KPI performance.
-
Green ▲ shows favorable performance
-
Red ▼ highlights underperformance
As a result, users do not need to analyze numbers manually. Visual signals guide attention immediately.
Click to Purchases Drone Services KPI Dashboard in Excel
What Is the KPI Trend Sheet Used For?
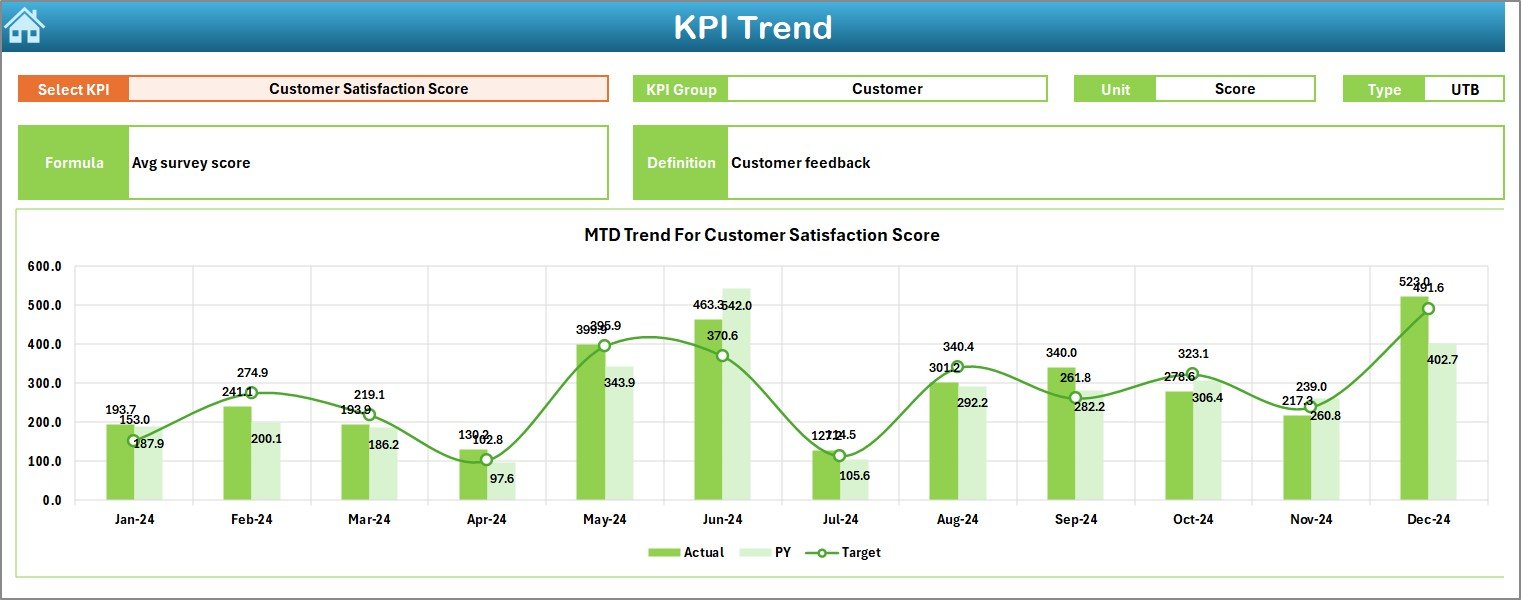
The KPI Trend Sheet focuses on deep KPI-level analysis.
How Do Users Select KPIs?
Users select a KPI name from a drop-down list available in cell C3. Once selected, all related information updates dynamically.
What Information Does the KPI Trend Sheet Display?
This sheet shows:
-
KPI Group
-
KPI Unit
-
KPI Type (Upper the Better or Lower the Better)
-
KPI Formula
-
KPI Definition
Additionally, it displays two trend charts:
-
MTD Trend Chart (Actual, Target, PY)
-
YTD Trend Chart (Actual, Target, PY)
Because of these charts, users easily analyze performance patterns over time.
Why Is the Actual Numbers Input Sheet Important?
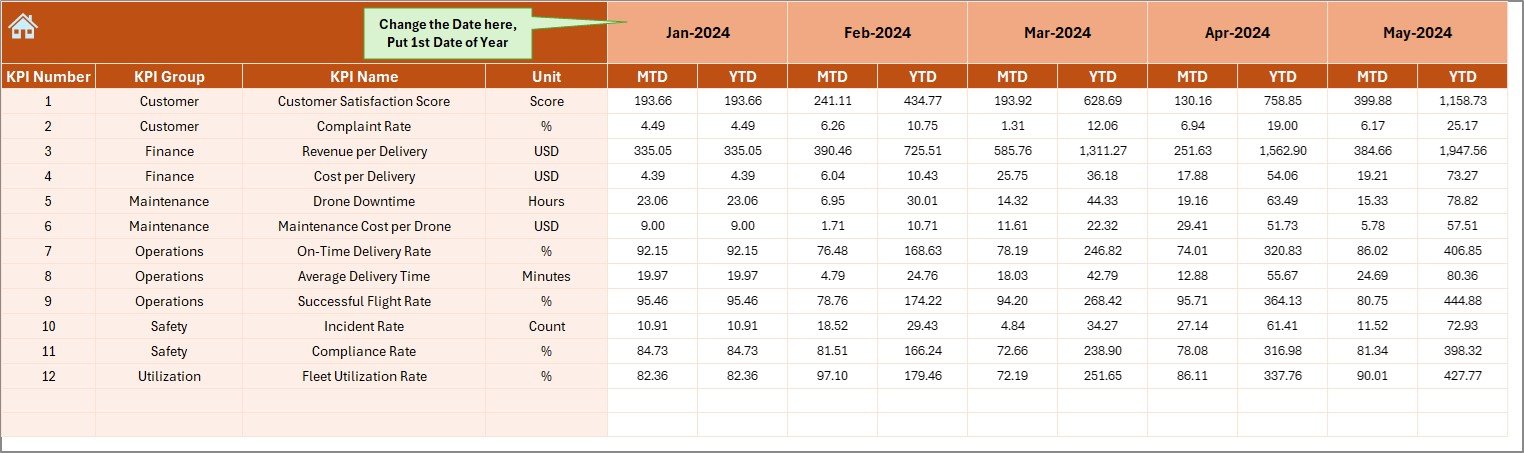
The Actual Numbers Input Sheet stores real operational data.
How Is Data Entered?
Users enter:
-
MTD Actual values
-
YTD Actual values
Users can change the reporting year by updating cell E1, where they enter the first month of the year.
This structure ensures flexibility across financial or calendar years.
What Is the Role of the Target Sheet?
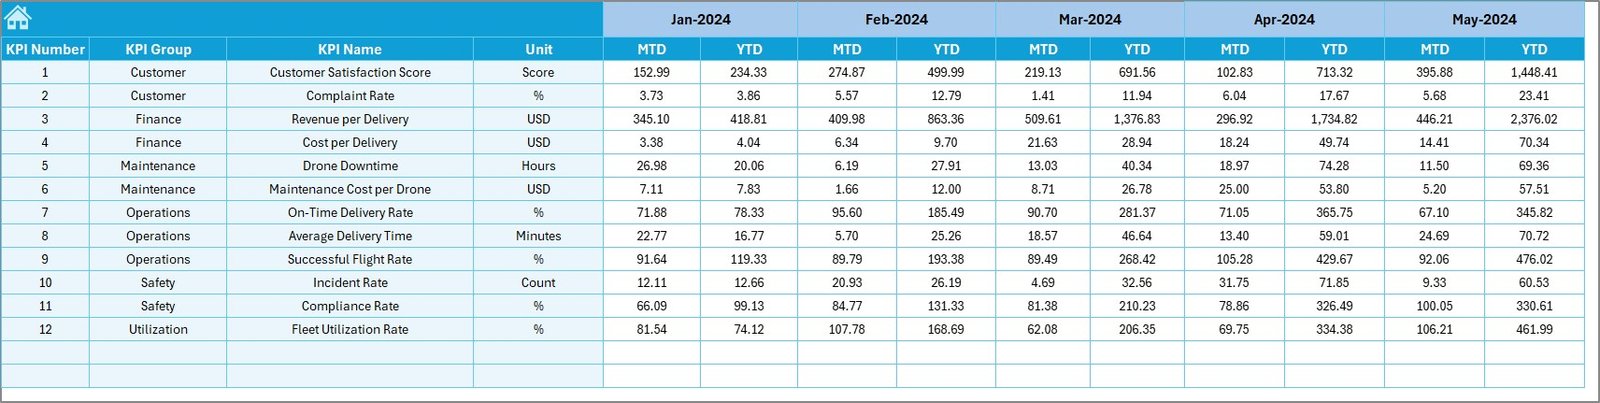
The Target Sheet stores target values for each KPI.
Users enter:
-
MTD Target values
-
YTD Target values
Because targets drive performance measurement, keeping this sheet updated ensures accurate dashboard results.
How Does the Previous Year Number Sheet Help?
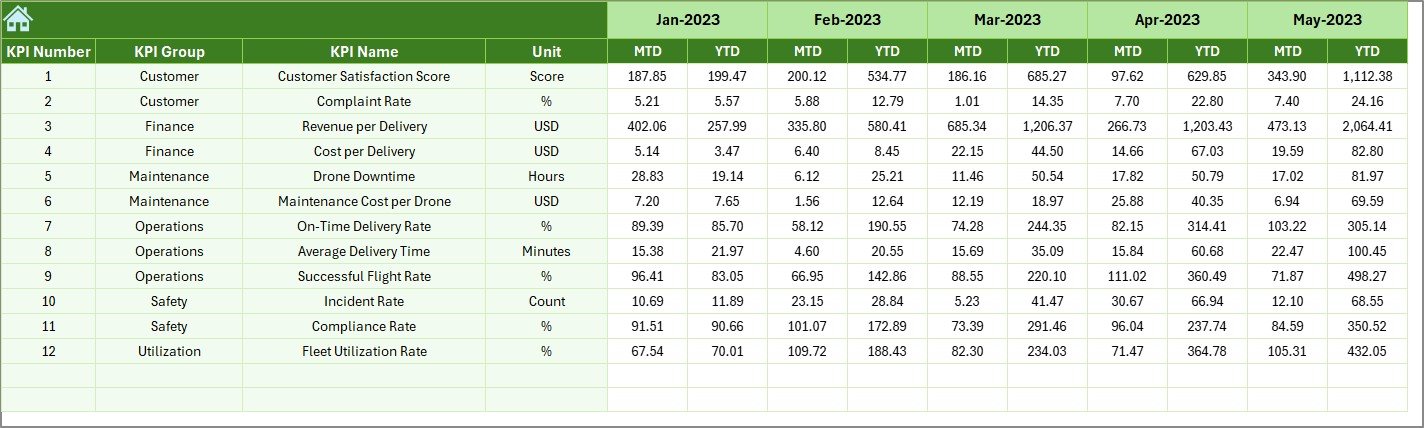
The Previous Year Number Sheet captures historical data.
Users enter previous year MTD and YTD values exactly like current year data. As a result, the dashboard enables year-over-year comparisons automatically.
This feature helps answer questions like:
-
Are drone operations improving year over year?
-
Which KPIs show consistent growth?
Why Is the KPI Definition Sheet Critical?
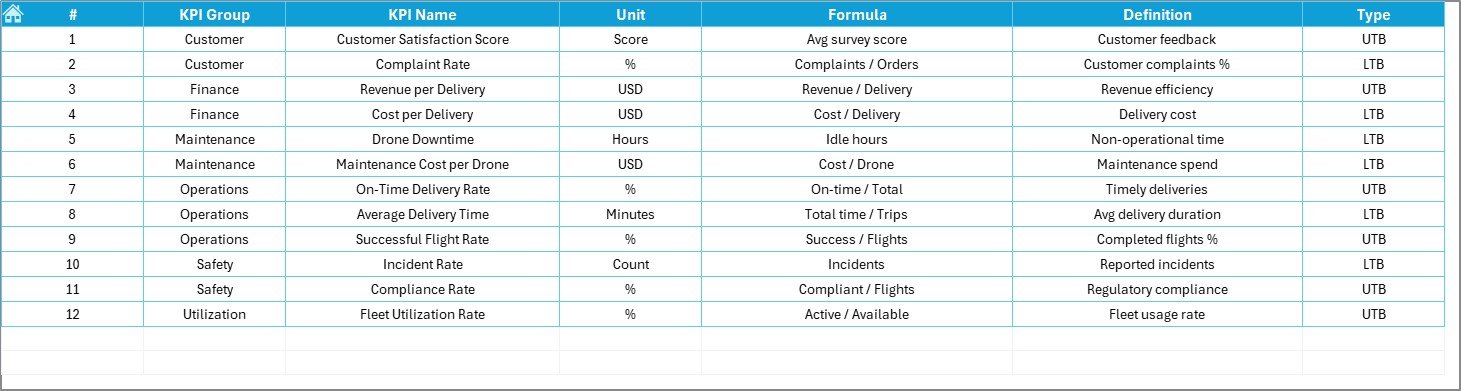
The KPI Definition Sheet defines the foundation of the dashboard.
It includes:
-
KPI Name
-
KPI Group
-
Unit
-
Formula
-
KPI Definition
This sheet ensures consistency, clarity, and governance across the organization. Moreover, it prevents confusion when multiple teams use the same dashboard.
Click to Purchases Drone Services KPI Dashboard in Excel
Advantages of Drone Services KPI Dashboard in Excel
Why Should Drone Businesses Use This Dashboard?
This dashboard offers several practical advantages.
-
Centralized KPI tracking in one Excel file
-
Easy month-wise and KPI-wise analysis
-
Clear target vs actual comparison
-
Visual performance indicators
-
Reduced reporting time
-
Improved operational visibility
-
Cost-effective and customizable solution
Because of these benefits, drone businesses gain control and confidence.
How Does This Dashboard Improve Operational Efficiency?
The dashboard highlights inefficiencies quickly. For example, if flight turnaround time increases or mission success rate drops, red indicators appear immediately.
As a result, managers take corrective action faster.
Who Can Benefit from a Drone Services KPI Dashboard?
This dashboard supports multiple stakeholders, including:
-
Drone service providers
-
UAV operations managers
-
Project managers
-
Business owners
-
Operations and compliance teams
-
Finance and planning teams
Each role gains tailored insights without complex tools.
Best Practices for the Drone Services KPI Dashboard in Excel
How Can You Maximize Dashboard Value?
Follow these best practices for optimal results.
-
Define KPIs clearly before implementation
-
Use consistent units and formulas
-
Update actual numbers regularly
-
Review MTD and YTD performance together
-
Set realistic and achievable targets
-
Train users to interpret arrows and percentages correctly
-
Maintain KPI definitions centrally
When teams follow these practices, the dashboard delivers long-term value.
How Does This Dashboard Support Business Growth?
By tracking trends and comparing year-over-year performance, the dashboard supports:
-
Better capacity planning
-
Smarter pricing decisions
-
Improved client service quality
-
Data-driven expansion strategies
As a result, drone businesses scale with confidence.
Common Use Cases of Drone Services KPI Dashboard
Where Can This Dashboard Be Applied?
This dashboard fits many drone service applications, such as:
-
Agricultural drone spraying and monitoring
-
Construction site surveys
-
Infrastructure inspections
-
Mapping and land surveys
-
Media and cinematography services
-
Logistics and delivery drones
Each use case benefits from clear KPI visibility.
Click to Purchases Drone Services KPI Dashboard in Excel
Conclusion: Why Should You Use a Drone Services KPI Dashboard in Excel?
A Drone Services KPI Dashboard in Excel transforms raw drone operation data into actionable insights. It simplifies reporting, improves accountability, and strengthens performance management.
Because it uses Excel, it remains affordable, flexible, and easy to adopt. Moreover, the dashboard empowers decision-makers to act faster, manage risks, and drive growth.
In a competitive drone services market, relying on manual tracking no longer works. Therefore, adopting a KPI dashboard becomes a strategic advantage.
Frequently Asked Questions (FAQs)
What KPIs can be tracked in a Drone Services KPI Dashboard?
You can track KPIs such as flight hours, mission success rate, turnaround time, revenue per mission, operational cost, and compliance metrics.
Can beginners use this Excel dashboard?
Yes. The dashboard uses simple input sheets and drop-downs, making it suitable for beginners.
Does the dashboard support MTD and YTD analysis?
Yes. It tracks both Month-to-Date and Year-to-Date performance.
Can I customize KPIs and targets?
Absolutely. You can edit KPI definitions, targets, and formulas easily.
Is this dashboard suitable for small drone startups?
Yes. It works well for both small startups and large drone service providers.
Click to Purchases Drone Services KPI Dashboard in Excel
Visit our YouTube channel to learn step-by-step video tutorials