Home>Blogs>Charts and Visualization>Dynamic Comparison Analysis Chart in Excel>Dynamic Comparison Analysis Chart
Dynamic Comparison Analysis Chart
01
May 2021
87Comments Off on Dynamic Comparison Analysis Chart
PK
Meet PK, the founder of PK-AnExcelExpert.com! With over 15 years of experience in Data Visualization, Excel Automation, and dashboard creation. PK is a Microsoft Certified Professional who has a passion for all things in Excel. PK loves to explore new and innovative ways to use Excel and is always eager to share his knowledge with others. With an eye for detail and a commitment to excellence, PK has become a go-to expert in the world of Excel. Whether you're looking to create stunning visualizations or streamline your workflow with automation, PK has the skills and expertise to help you succeed. Join the many satisfied clients who have benefited from PK's services and see how he can take your Excel skills to the next level!
https://www.pk-anexcelexpert.com
Related Articles
Excel Formula to create Unique list form multiple columns in Excel
Unique list form multiple columns in Excel Ever felt overwhelmed by managing lists in Excel, especially when they sprawl across
Derivatives Trading KPI Dashboard in Power BI
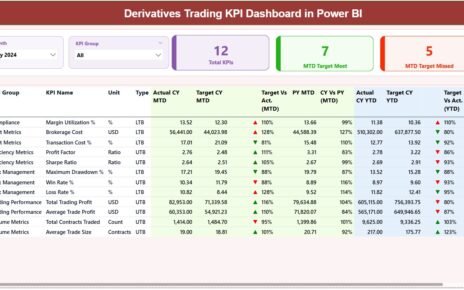
Derivatives trading involves high volumes, rapid market movements, and constant exposure to risk. Therefore, trading teams, risk managers, and leadership
Biodegradable Packaging Dashboard in Power BI
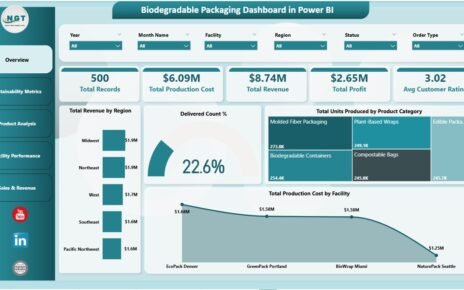
Introduction The Biodegradable Packaging Dashboard in Power BI is a powerful analytic tool designed to provide insights into the production,


