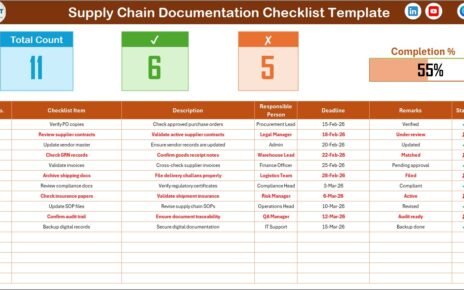
Supply chains move fast. Documents move even faster. Contracts update. Invoices change. Compliance rules evolve. Shipping papers expire. Therefore, businesses
In today’s digital education world, data has become the foundation of growth and success. Online learning platforms generate massive amounts
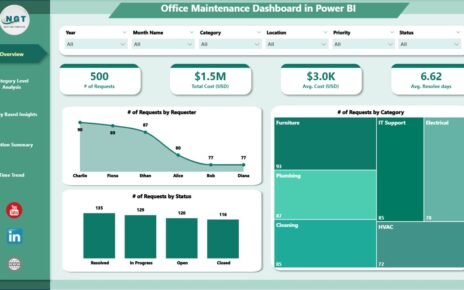
In today’s fast-paced corporate world, office maintenance plays a crucial role in ensuring that workplace environments are safe, efficient, and