The e-logistics industry has grown rapidly in recent years. Today, online shopping, quick commerce, and digital marketplaces rely heavily on efficient logistics systems. Every day, logistics startups manage thousands of deliveries, multiple vehicle types, different operating teams, and customer orders from various cities.
Because of this complexity, logistics startups must continuously monitor operational performance. However, many startups still rely on scattered spreadsheets and manual reports. As a result, decision-makers struggle to understand delivery performance, operating costs, and customer satisfaction levels.
Click to Purchases E-logistics Startups Dashboard in Power BI
Therefore, companies need a centralized analytics system that can track logistics performance in real time.
This is where the E-logistics Startups Dashboard in Power BI becomes extremely valuable.
A Power BI dashboard helps logistics startups visualize operational data, track key metrics, analyze delivery performance, and control operational costs from a single interface. Instead of analyzing multiple reports, managers can easily understand business performance through interactive charts and data visualizations.
In this detailed guide, you will learn:
-
What an E-logistics dashboard in Power BI is
-
Why logistics startups need analytics dashboards
-
Key features of the dashboard
-
Important logistics KPIs
-
Advantages of using Power BI dashboards
-
Best practices for logistics analytics
-
Frequently asked questions about logistics dashboards
What Is an E-Logistics Startups Dashboard in Power BI?
Click to Purchases E-logistics Startups Dashboard in Power BI
An E-logistics dashboard in Power BI is an interactive data visualization tool that helps logistics companies analyze delivery operations, customer satisfaction, revenue performance, and operational costs.
Instead of reviewing different spreadsheets or reports, the dashboard displays all important logistics metrics in a single place.
For example, a logistics manager can quickly see:
-
Total delivery records
-
Revenue generated from different customer types
-
Delivery performance by vehicle type
-
Customer satisfaction ratings by city
-
Operational costs across teams
Because Power BI provides interactive filtering and visual analytics, decision-makers can explore logistics data easily and make faster business decisions.
Moreover, logistics startups can identify operational inefficiencies and improve delivery performance using real-time insights.
Why Do E-Logistics Startups Need a Power BI Dashboard?
Logistics startups operate in a fast-moving environment. Every day, companies manage delivery routes, driver teams, customer orders, and operational costs.
However, without a structured analytics system, it becomes difficult to track performance effectively.
Therefore, a Power BI dashboard helps logistics startups solve several operational challenges.
Key Reasons Logistics Startups Need Analytics
1. Monitor Delivery Performance
Delivery performance plays a critical role in customer satisfaction. The dashboard allows managers to monitor delivery records, analyze trends, and identify performance gaps.
2. Track Operational Costs
Operating costs include fuel expenses, vehicle maintenance, driver payments, and logistics infrastructure costs. With Power BI, startups can monitor these costs and control operational spending.
3. Improve Customer Experience
Customer ratings provide valuable feedback about delivery quality. By analyzing customer ratings by city or startup name, companies can identify areas that need improvement.
4. Analyze Revenue Performance
Revenue analytics help companies understand which delivery services generate the highest income.
5. Support Data-Driven Decisions
Instead of relying on guesswork, managers can make strategic decisions based on accurate logistics data.
Key Features of the E-Logistics Startups Dashboard in Power BI
The E-logistics Startups Dashboard in Power BI includes five powerful analytical pages. Each page focuses on a specific operational area and helps managers analyze logistics performance in detail.
Let us explore each dashboard page.
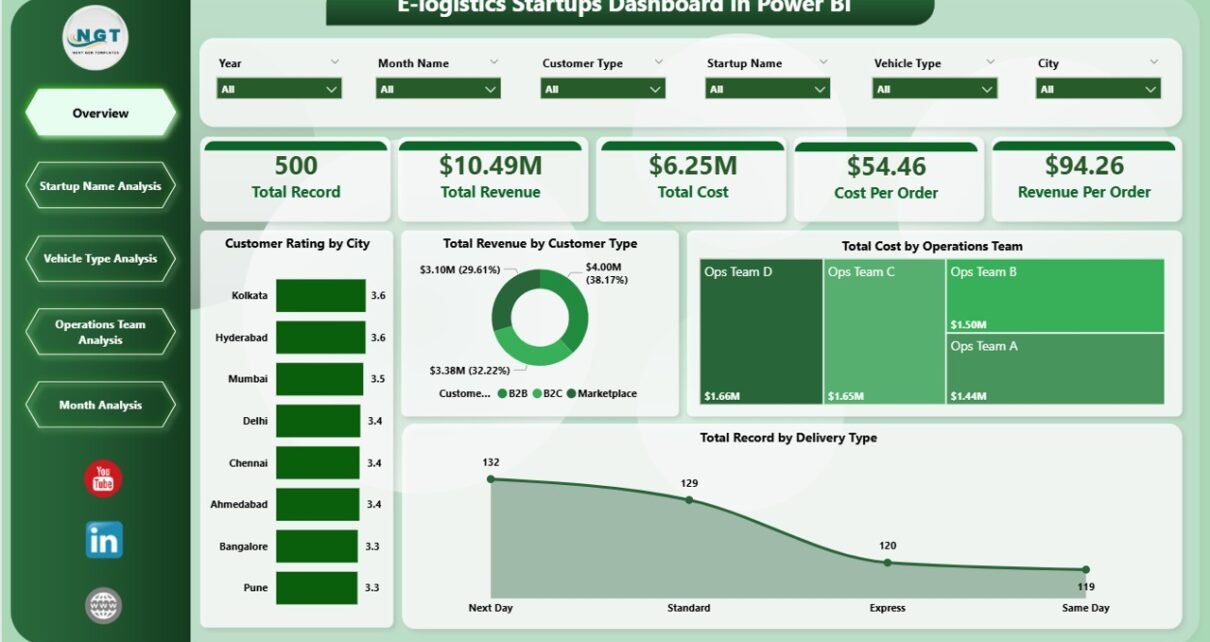
1. Overview Page – How Does It Provide Quick Business Insights?
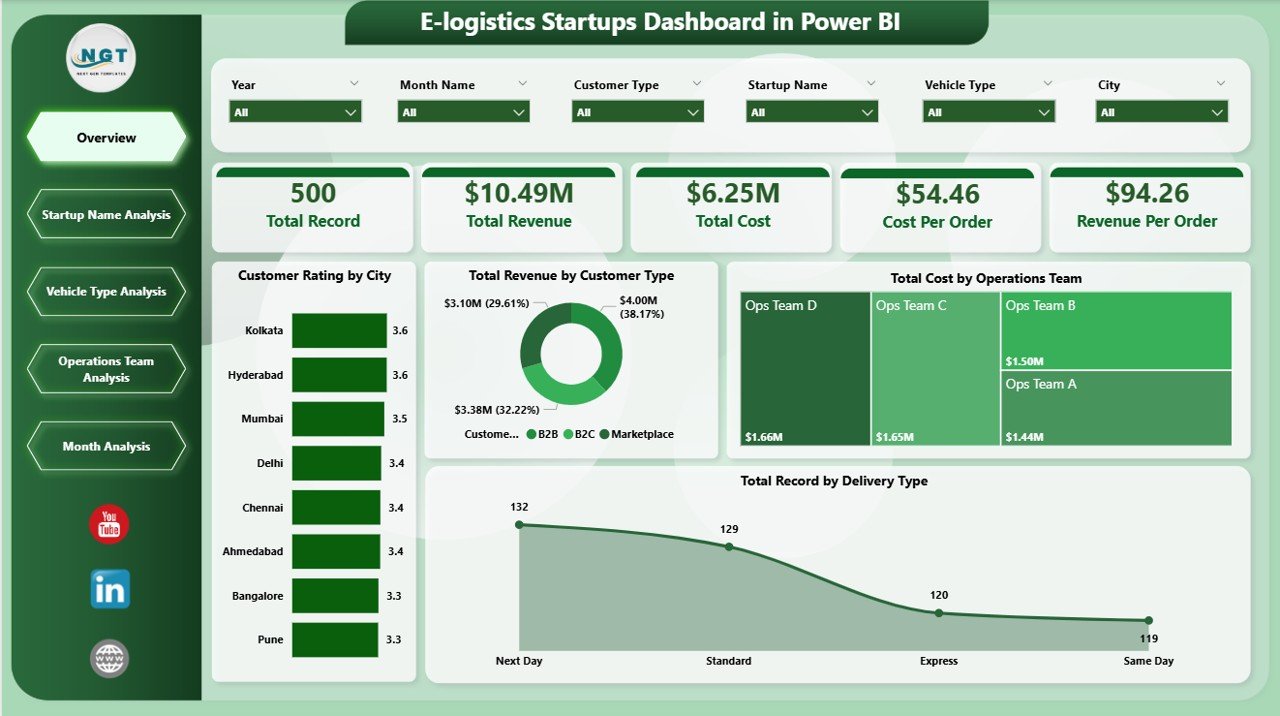
The Overview Page serves as the main summary page of the dashboard. It provides a high-level view of logistics operations.
This page includes interactive slicers that allow users to filter data based on different parameters.
Key Metrics Displayed on the Overview Page
The dashboard includes several KPI cards and charts that summarize logistics performance.
Important KPI Cards
-
Customer Rating by City
-
Total Revenue by Customer Type
-
Total Cost by Operating Team
-
Total Record by Delivery Type
These KPIs allow managers to quickly understand delivery performance, revenue distribution, and operational costs.
Benefits of the Overview Page
-
Provides a quick snapshot of logistics performance
-
Helps managers track major KPIs instantly
-
Supports faster decision-making
Because this page summarizes the most important metrics, it becomes the starting point for logistics performance analysis.
Click to Purchases E-logistics Startups Dashboard in Power BI
2. Startup Name Analysis – How Can Companies Compare Startup Performance?
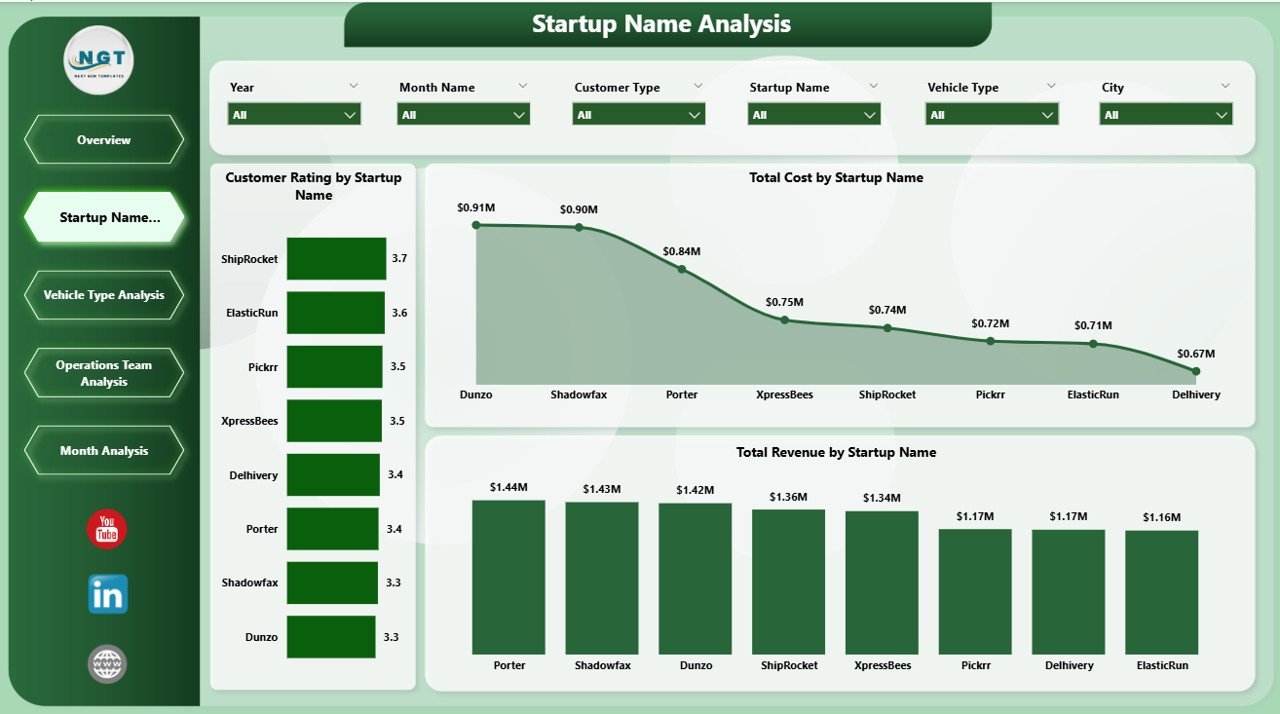
The Startup Name Analysis Page focuses on comparing performance across different logistics startups.
Many logistics companies operate multiple startup brands or delivery services. Therefore, comparing their performance becomes essential.
Charts Available in This Section
-
Customer Rating by Startup Name
-
Total Revenue by Startup Name
-
Total Cost by Startup Name
Insights Provided by Startup Analysis
This page helps managers understand:
-
Which startup provides the best customer experience
-
Which startup generates the highest revenue
-
Which startup incurs the highest operational cost
Because of these insights, companies can identify profitable startups and improve underperforming ones.
3. Vehicle Type Analysis – Why Does Vehicle Performance Matter?
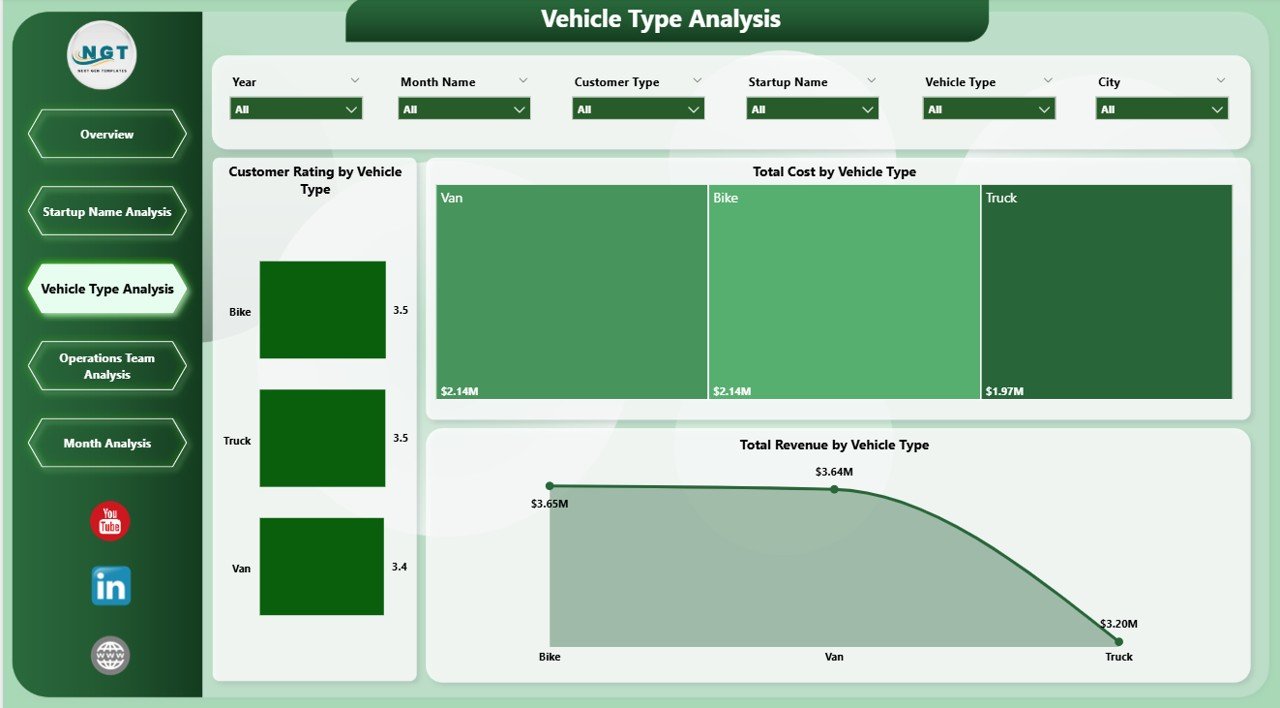
Vehicle selection plays a major role in logistics efficiency. Different delivery types require different vehicles.
For example:
-
Motorbikes work best for small urban deliveries
-
Vans handle medium-sized shipments
-
Trucks manage bulk deliveries
Therefore, analyzing vehicle performance becomes very important.
Charts Included in Vehicle Type Analysis
-
Customer Rating by Vehicle Type
-
Total Revenue by Vehicle Type
-
Total Cost by Vehicle Type
Key Insights from Vehicle Analysis
The dashboard allows companies to identify:
-
Which vehicle type generates the highest revenue
-
Which vehicles incur the highest costs
-
Which vehicles deliver better customer satisfaction
Because of these insights, logistics managers can optimize fleet utilization.
4. Operations Team Analysis – How Can Teams Improve Logistics Efficiency?
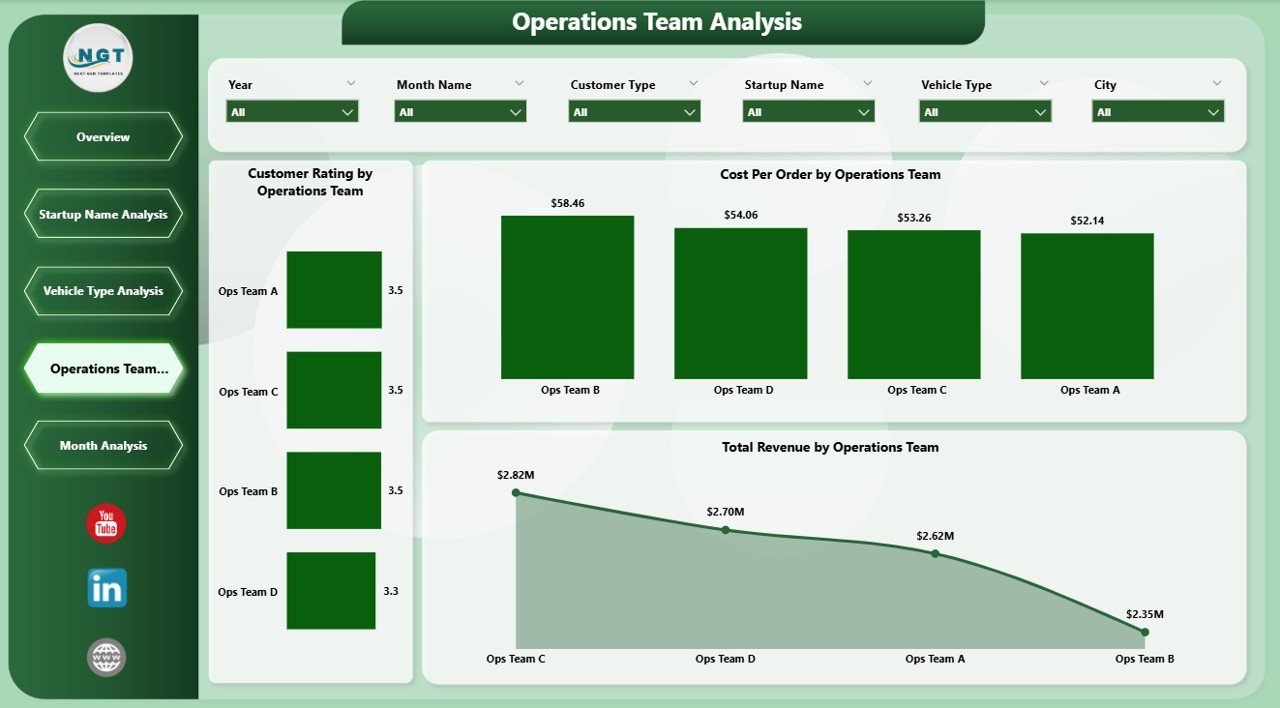
Operations teams play a crucial role in logistics startups. These teams manage delivery scheduling, driver coordination, warehouse operations, and route planning.
Therefore, evaluating team performance becomes essential.
Charts in the Operations Team Analysis Page
-
Customer Rating by Operating Team
-
Total Revenue by Operating Team
-
Total Cost by Operating Team
Benefits of Operations Team Analysis
This page helps organizations:
-
Identify high-performing logistics teams
-
Compare operational efficiency across teams
-
Optimize team workload distribution
As a result, companies can improve delivery operations and service quality.
5. Month Analysis – How Does Monthly Trend Analysis Help Logistics Companies?
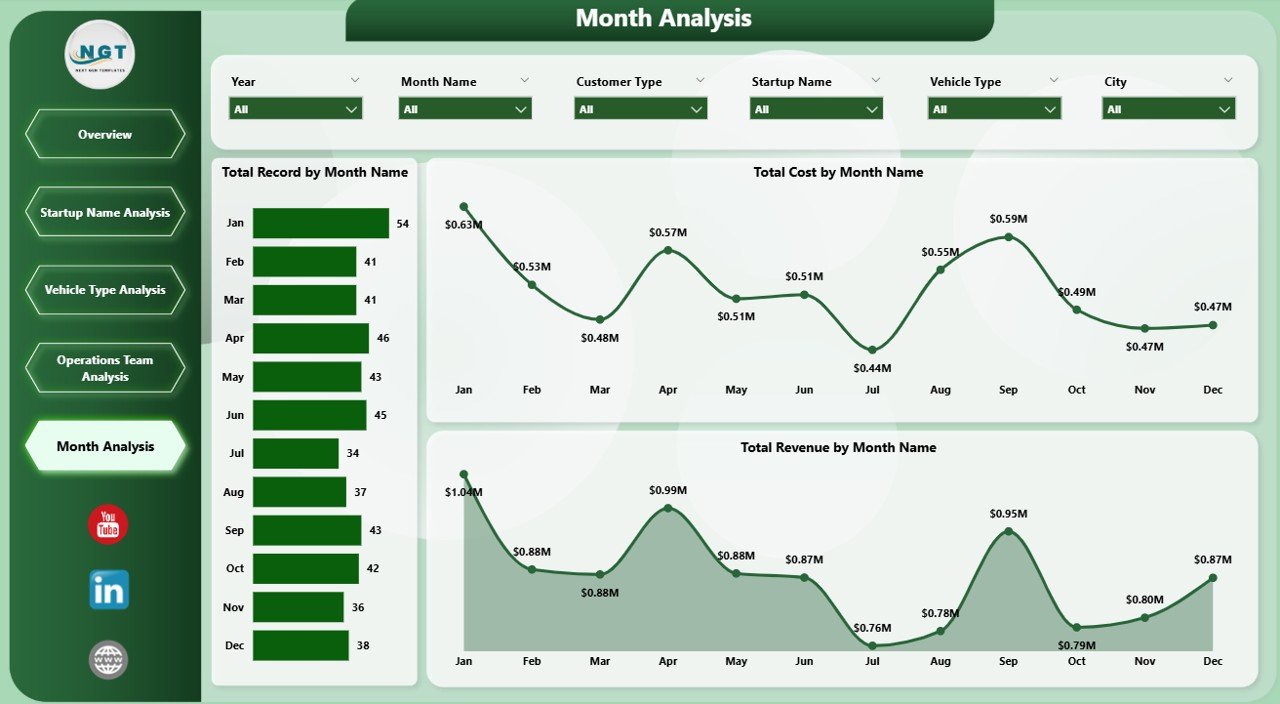
Logistics performance changes throughout the year due to seasonal demand, promotional campaigns, and market trends.
Therefore, analyzing monthly trends helps companies plan operations more effectively.
Charts Available in Month Analysis
-
Total Record by Month
-
Total Revenue by Month
-
Total Cost by Month
Insights from Monthly Analysis
This page helps businesses:
-
Identify peak delivery months
-
Track revenue growth trends
-
Monitor monthly operational costs
Because of these insights, companies can forecast demand and improve resource planning.
Important KPIs for E-Logistics Startups
Click to Purchases E-logistics Startups Dashboard in Power BI
To manage logistics operations successfully, companies must track several important KPIs.
Here are some key logistics performance indicators:
-
Total Delivery Records
-
Revenue by Customer Type
-
Customer Satisfaction Rating
-
Cost per Delivery
-
Revenue by Startup
-
Delivery Performance by Vehicle Type
-
Operational Cost by Team
-
Monthly Revenue Growth
When companies monitor these KPIs regularly, they can improve operational performance significantly.
Advantages of the E-Logistics Startups Dashboard in Power BI
Using a Power BI dashboard provides several advantages for logistics startups.
🚀 Centralized Data Management
The dashboard consolidates all logistics data into one platform. As a result, companies avoid scattered reports.
📊 Better Data Visualization
Interactive charts help users understand logistics performance quickly.
⚡ Faster Decision-Making
Managers can analyze business performance instantly and take immediate actions.
📦 Improved Operational Efficiency
Companies can identify operational bottlenecks and optimize delivery operations.
⭐ Enhanced Customer Experience
Customer rating analysis helps organizations improve delivery service quality.
Opportunities for Improvement in Logistics Analytics
Although dashboards provide powerful insights, organizations should continuously improve their analytics systems.
Possible Improvements
-
Integrate real-time delivery tracking
-
Connect dashboards with GPS logistics systems
-
Include predictive demand forecasting
-
Analyze driver performance metrics
-
Implement automated reporting
These improvements can make logistics dashboards even more powerful.
Best Practices for the E-Logistics Startups Dashboard in Power BI
To maximize the value of logistics dashboards, companies should follow some best practices.
✔ Use Clean and Structured Data
Accurate data ensures reliable insights.
✔ Track the Right KPIs
Focus on metrics that directly impact logistics performance.
✔ Update Data Regularly
Frequent updates ensure the dashboard reflects current business performance.
✔ Use Interactive Filters
Slicers allow users to analyze data based on different conditions.
✔ Train Teams to Use the Dashboard
Employees should understand how to interpret dashboard insights.
By following these best practices, logistics startups can fully leverage the power of data analytics.
Conclusion
The logistics industry continues to evolve rapidly. As e-commerce grows, logistics startups must manage complex delivery networks, multiple vehicle types, operational teams, and customer expectations.
However, manual reporting methods often fail to provide clear insights.
The E-logistics Startups Dashboard in Power BI solves this challenge by transforming raw logistics data into powerful visual insights.
Through interactive charts and analytics, businesses can track delivery performance, monitor operational costs, evaluate team productivity, and improve customer satisfaction.
Therefore, logistics startups that adopt data-driven dashboards can significantly improve operational efficiency and gain a competitive advantage in the logistics industry.
Frequently Asked Questions (FAQs)
What is an E-logistics dashboard?
An E-logistics dashboard is a data visualization tool that helps logistics companies track delivery performance, revenue, operational costs, and customer satisfaction using interactive charts.
Why should logistics startups use Power BI dashboards?
Power BI dashboards help startups monitor key metrics, analyze logistics performance, and make faster data-driven decisions.
What data can be included in a logistics dashboard?
Logistics dashboards typically include:
-
Delivery records
-
Revenue data
-
Customer ratings
-
Vehicle performance
-
Operational costs
-
Monthly delivery trends
Can Power BI handle large logistics datasets?
Yes. Power BI can process large datasets and visualize them through interactive reports and dashboards.
Who should use the E-logistics dashboard?
This dashboard benefits:
-
Logistics startups
-
Delivery companies
-
Supply chain managers
-
Operations managers
-
E-commerce fulfillment teams
Click to Purchases E-logistics Startups Dashboard in Power BI
Visit our YouTube channel to learn step-by-step video tutorials