Economic Development Boards (EDBs) play a vital role in shaping regional economies. They attract investments, support industries, create employment opportunities, and promote economic growth. However, managing multiple economic indicators becomes difficult when organizations rely on scattered spreadsheets and manual reports.
Therefore, organizations increasingly use data-driven dashboards to track performance and measure progress. Among the most effective solutions, the Economic Development Boards KPI Dashboard in Power BI stands out as a powerful analytical tool.
This dashboard transforms complex economic data into interactive visual insights. As a result, decision-makers can quickly analyze performance, track key indicators, and identify areas that require improvement.
In this comprehensive guide, you will learn everything about the Economic Development Boards KPI Dashboard in Power BI, including its features, structure, advantages, best practices, and frequently asked questions.
Click to buy Economic Development Boards KPI Dashboard in Power BI
What Is an Economic Development Boards KPI Dashboard in Power BI?
An Economic Development Boards KPI Dashboard in Power BI is an interactive business intelligence solution that helps economic development agencies track and analyze performance indicators.
The dashboard collects and visualizes key economic data such as:
- Investment inflow
- Job creation statistics
- Industrial development indicators
- Export growth metrics
- Infrastructure project performance
- Business registrations and expansions
Because Power BI converts raw data into interactive visuals, stakeholders can monitor progress quickly and make informed decisions.
Furthermore, organizations can easily track monthly performance, yearly trends, and target achievements through clear visual reports.
Why Do Economic Development Boards Need KPI Dashboards?
Economic development organizations manage large volumes of data. Without a structured reporting system, leaders struggle to understand performance trends.
However, a Power BI KPI dashboard simplifies data analysis and improves decision-making.
Key reasons why organizations use KPI dashboards:
- Track economic development performance
- Monitor investment projects
- Evaluate policy effectiveness
- Identify growth opportunities
- Improve transparency and reporting
Moreover, dashboards provide real-time insights, which help governments and development agencies respond quickly to economic changes.
Key Features of the Economic Development Boards KPI Dashboard in Power BI
This dashboard offers a structured and easy-to-use analytical system. It contains three main pages that help users monitor performance efficiently.
Let us explore each page in detail.
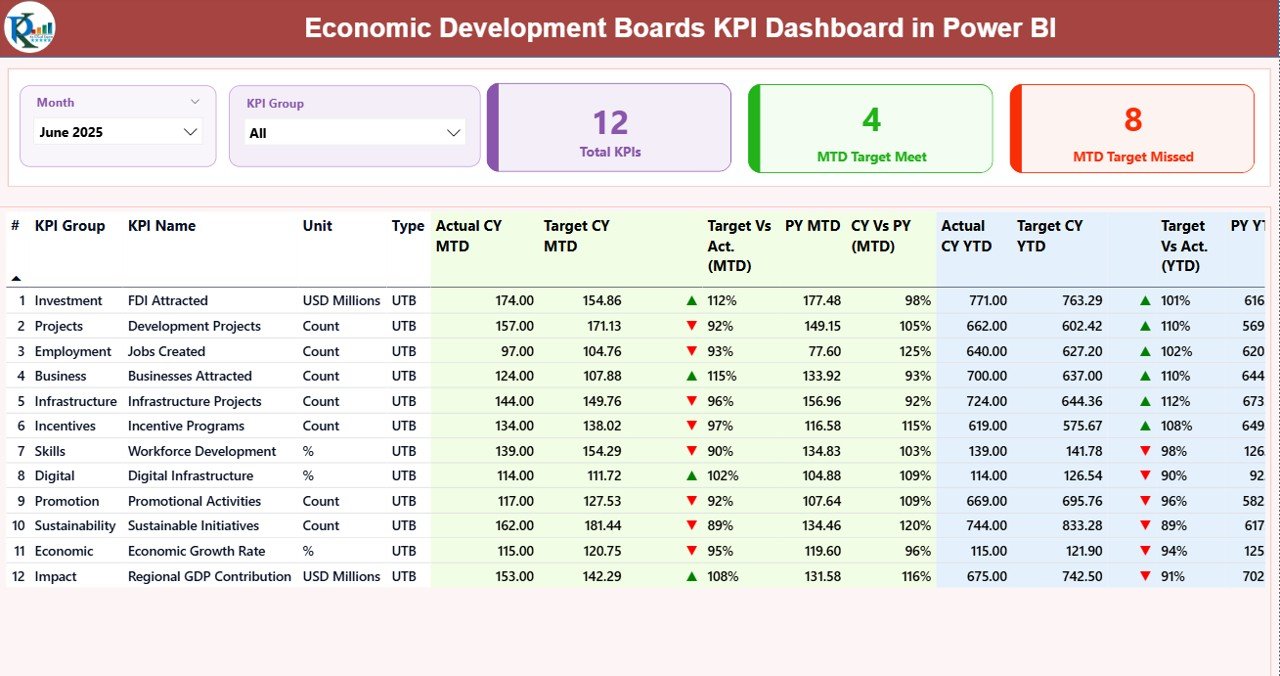
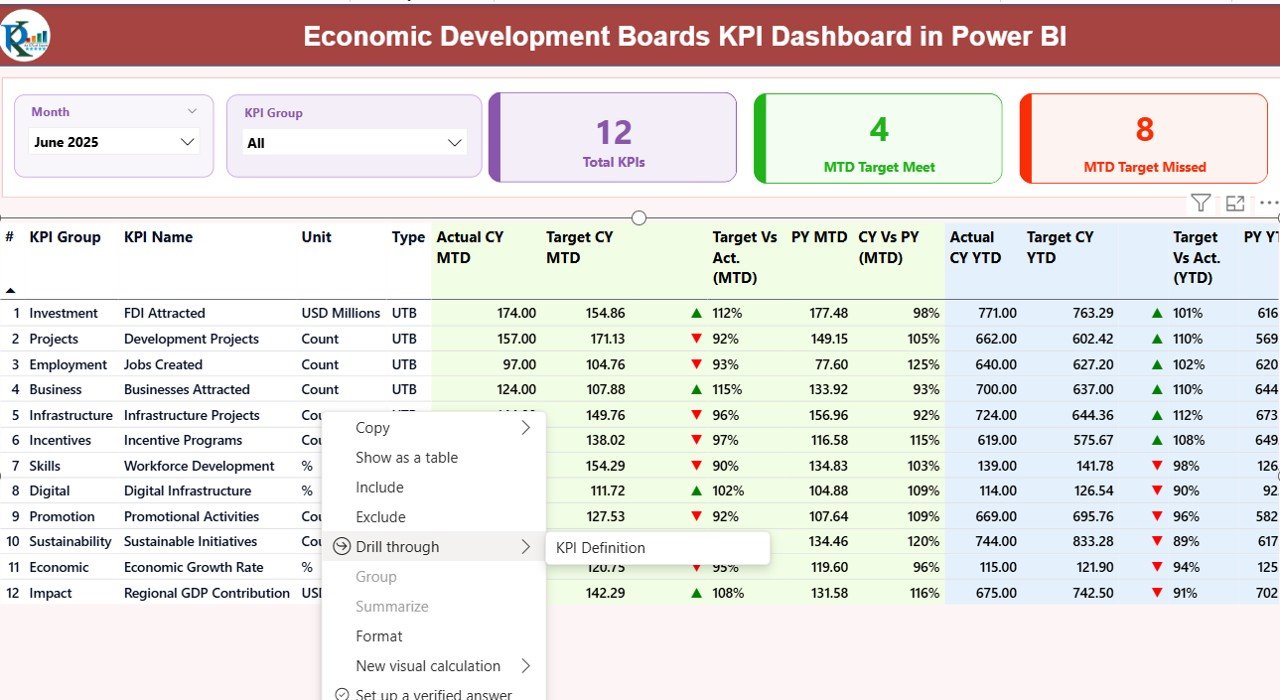
Summary Page – The Main Dashboard View
The Summary Page acts as the central hub of the dashboard. Users can quickly view key economic indicators and performance metrics.
Slicers for Interactive Analysis
At the top of the dashboard, users can filter the data using two slicers:
- Month slicer – Analyze performance for a specific month
- KPI Group slicer – Filter KPIs by category or economic sector
Because of these slicers, users can quickly narrow down the data and analyze specific metrics.
KPI Cards for Quick Insights
The dashboard displays three KPI cards that summarize important performance indicators.
These cards show:
- Total KPIs Count – Total number of tracked indicators
- MTD Target Meet Count – KPIs that achieved monthly targets
- MTD Target Missed Count – KPIs that did not reach targets
Therefore, executives can quickly understand overall performance without analyzing detailed reports.
Detailed KPI Performance Table
Below the KPI cards, the dashboard displays a detailed table that shows complete KPI information.
This table includes the following fields:
KPI Number
This field represents the sequence number of each KPI. It helps users organize and track indicators efficiently.
KPI Group
This column categorizes KPIs into different economic sectors or strategic groups.
For example:
- Investment KPIs
- Employment KPIs
- Infrastructure KPIs
- Export KPIs
Because of this grouping, organizations can analyze performance by category.
KPI Name
This column displays the name of the key performance indicator.
Examples include:
- Total Investment Projects
- Jobs Created
- Export Growth Rate
- Industrial Expansion Count
Unit of Measurement
Each KPI uses a specific unit such as:
- USD
- Percentage
- Number of projects
- Number of jobs
This ensures that users understand the measurement scale.
KPI Type
The dashboard categorizes KPIs into two types:
LTB – Lower the Better
Examples include:
- Unemployment rate
- Project delays
UTB – Upper the Better
Examples include:
- Investment inflow
- Job creation
This classification helps interpret performance correctly.
MTD (Month-To-Date) KPI Metrics
The dashboard provides detailed MTD performance indicators.
These metrics include:
Actual CY MTD
This field shows the actual value of the KPI for the current month.
Target CY MTD
This column displays the monthly target value set by the organization.
MTD Icon Indicator
The dashboard uses visual icons to show performance status:
- ▲ Green Arrow – Target achieved
- ▼ Red Arrow – Target missed
Because visual indicators improve readability, decision-makers can identify issues immediately.
Target vs Actual (MTD)
This metric calculates the percentage difference between actual and target values.
Formula used:
Actual MTD / Target MTD
This percentage helps organizations evaluate performance quickly.
PY MTD (Previous Year Month-To-Date)
This column compares current performance with the same month in the previous year.
CY vs PY (MTD)
This metric measures growth or decline compared to last year.
Formula used:
Current Year MTD / Previous Year MTD
Because of this comparison, organizations can analyze year-over-year progress.
YTD (Year-To-Date) KPI Metrics
Besides monthly indicators, the dashboard also provides year-to-date performance metrics.
These metrics include:
Actual CY YTD
This value represents the total KPI performance for the current year.
Target CY YTD
This field shows the annual target value for the KPI.
YTD Icon Indicator
Similar to MTD metrics, the dashboard uses visual arrows to indicate performance:
- Green arrow – Target achieved
- Red arrow – Target missed
Target vs Actual (YTD)
This metric evaluates performance against the annual target.
Formula used:
Actual YTD / Target YTD
PY YTD (Previous Year)
This field shows the performance for the same period last year.
CY vs PY (YTD)
This metric compares current yearly performance with previous year results.
Formula used:
Current Year YTD / Previous Year YTD
Because of these comparisons, organizations can measure long-term growth trends.
Click to buy Economic Development Boards KPI Dashboard in Power BI
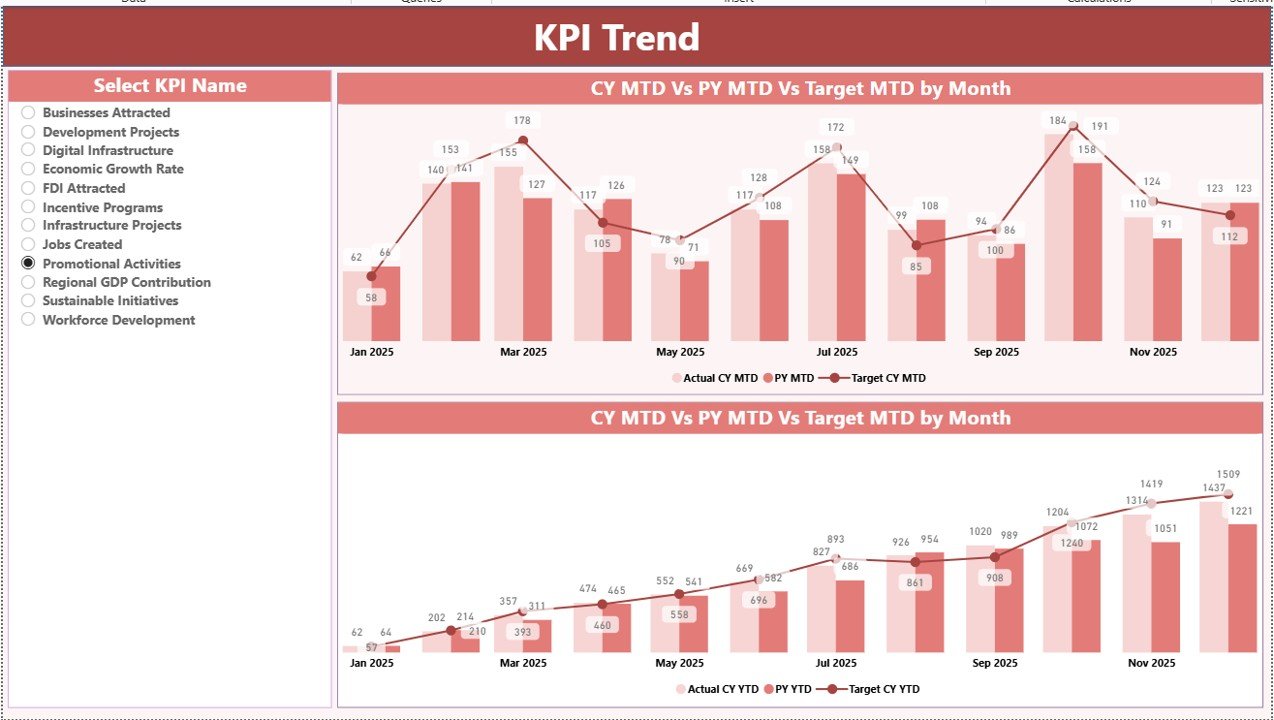
KPI Trend Page – Performance Analysis
The KPI Trend Page provides a visual representation of KPI performance.
This page helps users analyze trends and patterns in economic indicators.
Combo Charts for Performance Tracking
The dashboard includes two combo charts that display:
- Current year actual values
- Previous year values
- Target values
These charts analyze both:
- MTD performance
- YTD performance
Because visual charts simplify complex data, analysts can easily identify trends.
KPI Selection Slicer
Users can select a specific KPI using the slicer on the left side of the page.
Once users choose a KPI, the charts automatically update.
Therefore, decision-makers can analyze performance for individual indicators.
Click to buy Economic Development Boards KPI Dashboard in Power BI
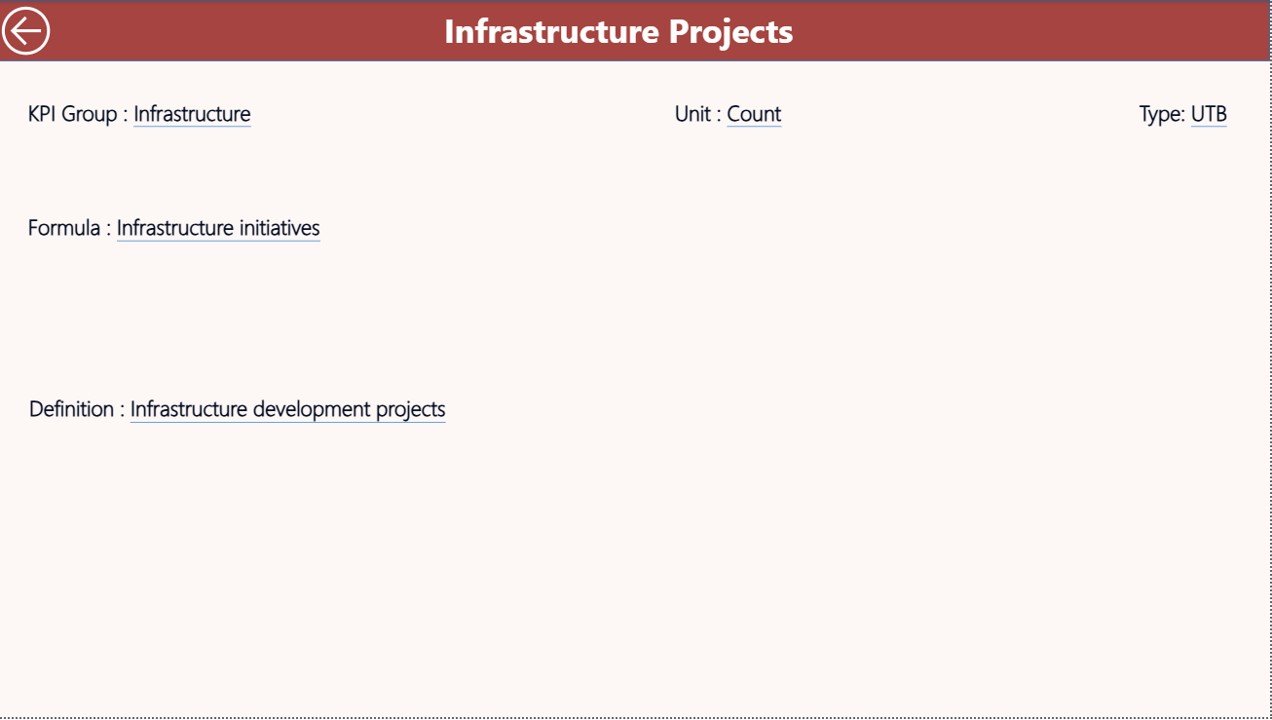
KPI Definition Page – Detailed KPI Information
The KPI Definition Page acts as a drill-through page.
Although this page remains hidden in the dashboard, users can access it from the summary page.
Information Available on This Page
This page provides detailed KPI documentation including:
- KPI Formula
- KPI Definition
- KPI Measurement Unit
- KPI Category
- KPI Calculation logic
Because clear KPI definitions improve data transparency, organizations maintain consistent reporting standards.
Back Button Navigation
Users can easily return to the main dashboard by clicking the Back Button located at the top left corner.
This improves navigation and user experience.
Click to buy Economic Development Boards KPI Dashboard in Power BI
Excel Data Source for the Dashboard
The Power BI dashboard uses Excel as the primary data source.
Users simply update the Excel file and refresh the Power BI dashboard.
The Excel file contains three worksheets.
Input_Actual Sheet – Recording Actual KPI Values
The Input_Actual sheet captures the real performance values.
Users must fill the following fields:
- KPI Name
- Month (use the first date of the month)
- MTD value
- YTD value
Once users update these values, Power BI automatically updates the visuals.
Input_Target Sheet – Setting KPI Targets
The Input_Target sheet stores KPI target values.
Users must fill:
- KPI Name
- Month
- Target MTD value
- Target YTD value
Because this sheet stores target benchmarks, organizations can measure performance accurately.
Click to buy Economic Development Boards KPI Dashboard in Power BI
KPI Definition Sheet – KPI Documentation
The KPI Definition sheet stores detailed KPI metadata.
Users must enter the following information:
- KPI Number
- KPI Group
- KPI Name
- Unit of Measurement
- Formula
- Definition
- KPI Type (LTB or UTB)
This structured data ensures consistent KPI interpretation across teams.
Click to buy Economic Development Boards KPI Dashboard in Power BI
Advantages of the Economic Development Boards KPI Dashboard in Power BI
Organizations benefit significantly from this dashboard.
- Centralized Economic Performance Monitoring
The dashboard consolidates multiple indicators into one centralized platform.
Therefore, leaders can monitor performance quickly.
- Faster Decision Making
Because Power BI provides real-time insights, decision-makers respond faster to economic changes.
- Improved Data Transparency
Clear KPI definitions ensure consistent reporting across departments.
- Interactive Data Exploration
Slicers and filters allow users to analyze data from different perspectives.
- Trend Analysis
Year-over-year comparisons reveal long-term economic trends.
- Improved Accountability
Organizations can track whether teams achieve their targets.
- Data-Driven Policy Planning
Governments and development agencies can use insights to create better policies.
Best Practices for the Economic Development Boards KPI Dashboard in Power BI
Organizations should follow several best practices when implementing KPI dashboards.
Define Clear KPIs
Always select indicators that directly measure economic development goals.
Maintain Data Accuracy
Ensure that Excel data sources remain clean and updated.
Update Data Regularly
Regular updates ensure accurate reports and reliable insights.
Use Meaningful KPI Targets
Targets should align with economic development strategies.
Train Users
Train team members to understand KPI metrics and dashboard navigation.
Document KPI Definitions
Clear definitions ensure consistent interpretation of indicators.
Monitor Trends
Always analyze both monthly and yearly trends before making decisions.
How Does Power BI Improve Economic Development Analytics?
Power BI significantly improves data analysis and reporting.
Visual Data Insights
Power BI converts complex data into intuitive visuals.
Automated Data Refresh
Users simply update Excel data and refresh the dashboard.
Interactive Dashboards
Filters and slicers provide flexible data exploration.
Scalability
Organizations can expand the dashboard as new KPIs emerge.
Integration with Other Data Sources
Power BI can connect with databases, APIs, and other systems.
Therefore, organizations can build comprehensive analytics platforms.
Who Can Use the Economic Development KPI Dashboard?
Several organizations can benefit from this dashboard.
Economic Development Agencies
These agencies track investment and economic growth indicators.
Government Departments
Government planners monitor policy performance and development projects.
Investment Promotion Agencies
These organizations evaluate investment attraction strategies.
Policy Analysts
Analysts study economic trends and development outcomes.
City Development Authorities
Local governments monitor urban development projects.
Conclusion
Economic development organizations manage complex performance indicators. Without structured analytics tools, leaders struggle to interpret large volumes of data.
However, the Economic Development Boards KPI Dashboard in Power BI simplifies performance monitoring through interactive reports and visual analytics.
Because the dashboard integrates Excel data with Power BI visualizations, organizations gain powerful insights into economic performance.
Furthermore, decision-makers can track KPIs, compare targets, analyze trends, and improve policy outcomes.
Therefore, adopting a KPI dashboard represents a major step toward data-driven economic development management.
Frequently Asked Questions (FAQs)
What is an Economic Development KPI Dashboard?
An Economic Development KPI Dashboard is a visual reporting tool that tracks economic performance indicators such as investment, job creation, and infrastructure development.
Why should organizations use Power BI for KPI dashboards?
Power BI provides interactive visuals, real-time data updates, and advanced analytics capabilities.
Therefore, organizations can analyze performance more efficiently.
What data sources does the dashboard use?
The dashboard primarily uses Excel data sources, including actual KPI values, target values, and KPI definitions.
Can organizations customize the dashboard?
Yes. Organizations can add new KPIs, modify targets, and adjust visuals based on their requirements.
What types of KPIs can economic development boards track?
Organizations can track indicators such as:
- Investment inflow
- Job creation
- Industrial development
- Export growth
- Infrastructure progress
How often should organizations update KPI data?
Organizations should update KPI data monthly or quarterly to ensure accurate performance monitoring.
Visit our YouTube channel to learn step-by-step video tutorials
Watch the step-by-step video tutorial: