The education technology industry grows faster than ever before. Online courses, digital learning platforms, and virtual classrooms generate massive volumes of data every single day. However, many EdTech organizations still struggle to convert that data into clear and actionable insights. As a result, leaders often make decisions based on assumptions instead of facts.
That is exactly where an EdTech Dashboard in Power BI becomes a game-changing solution.
This article explains what an EdTech Dashboard in Power BI is, why EdTech organizations need it, how each dashboard page works, and how it supports smarter decision-making. Moreover, you will discover its advantages, best practices, opportunities for improvement, and frequently asked questions in a simple and practical way.
If you manage an EdTech platform, learning business, or training organization, this guide will help you understand how Power BI dashboards can elevate performance, revenue, and learner success.
Click to buy EdTech Dashboard in Power BI
What Is an EdTech Dashboard in Power BI?
An EdTech Dashboard in Power BI is an interactive analytics solution that visualizes key education and business metrics in one centralized view. It connects learner data, course performance, revenue information, and engagement metrics into easy-to-read dashboards.
Instead of reviewing spreadsheets, raw databases, or disconnected reports, decision-makers can instantly track performance across multiple dimensions. As a result, teams gain clarity, speed, and confidence.
Moreover, Power BI allows real-time filtering, drill-downs, and visual storytelling. Therefore, educators and executives can explore trends, patterns, and gaps without technical complexity.
Why Do EdTech Organizations Need a Power BI Dashboard?
EdTech platforms operate in a competitive and data-heavy environment. Every enrollment, quiz attempt, completion rate, and revenue transaction creates valuable insights. However, without a structured dashboard, that data remains underutilized.
An EdTech Dashboard in Power BI helps organizations:
- Track learner engagement clearly
- Monitor course performance continuously
- Analyze revenue and enrollment growth
- Identify dropouts and learning challenges
- Improve strategic planning with data
Because everything appears in one place, teams save time and reduce decision risks.
What Are the Key Objectives of an EdTech Dashboard in Power BI?
An EdTech dashboard serves multiple objectives at the same time. Instead of focusing only on academic outcomes or only on revenue, it balances both perspectives.
Primary objectives include:
- Improve learner success and completion rates
- Increase revenue visibility by segment and plan
- Identify weak courses or difficulty levels
- Monitor growth trends month by month
- Support instructors and content creators
As a result, organizations align learning outcomes with business performance.
How Is the EdTech Dashboard in Power BI Structured?
This EdTech Dashboard contains five well-designed pages in the Power BI desktop file. Each page focuses on a specific analytical purpose. Together, they provide a complete 360-degree view of the EdTech ecosystem.
Let us explore each page in detail.
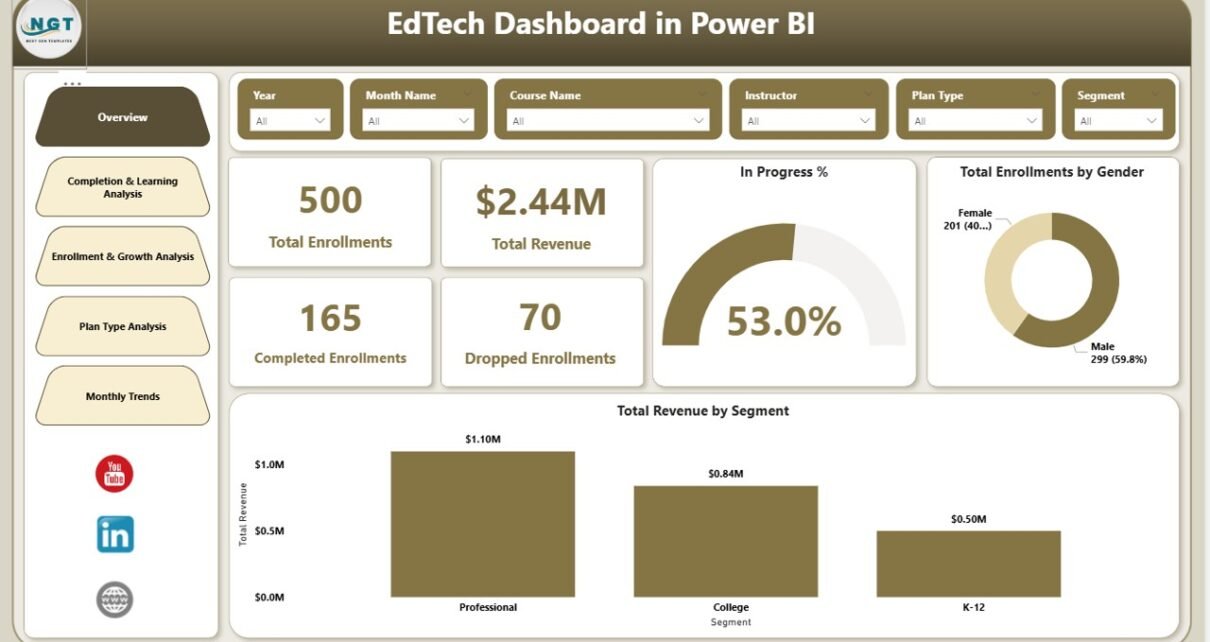
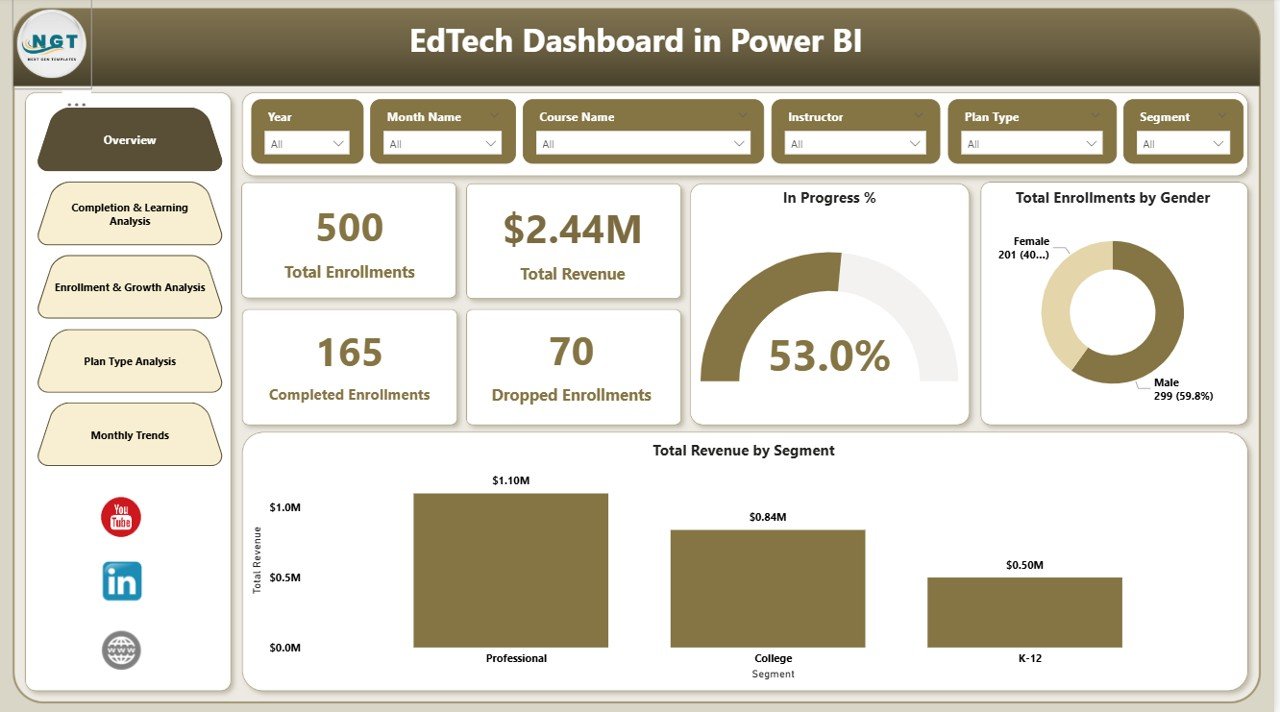
Overview Page: What High-Level Insights Does It Provide?
The Overview page acts as the executive summary of the dashboard. It delivers instant visibility into the most important KPIs.
Key metrics displayed on the Overview page:
- Total Revenue – Shows overall income from all courses and plans
- Total Enrollments – Indicates total learners enrolled
- Completed – Displays successfully completed enrollments
- Dropped – Highlights learners who discontinued courses
- In Progress % – Shows ongoing learner participation
- Revenue by Segment – Breaks revenue by learner or business segment
- Total Enrollments by Gender – Reveals gender-based participation
Because this page summarizes performance instantly, leaders can quickly assess the health of the platform.
Click to buy EdTech Dashboard in Power BI
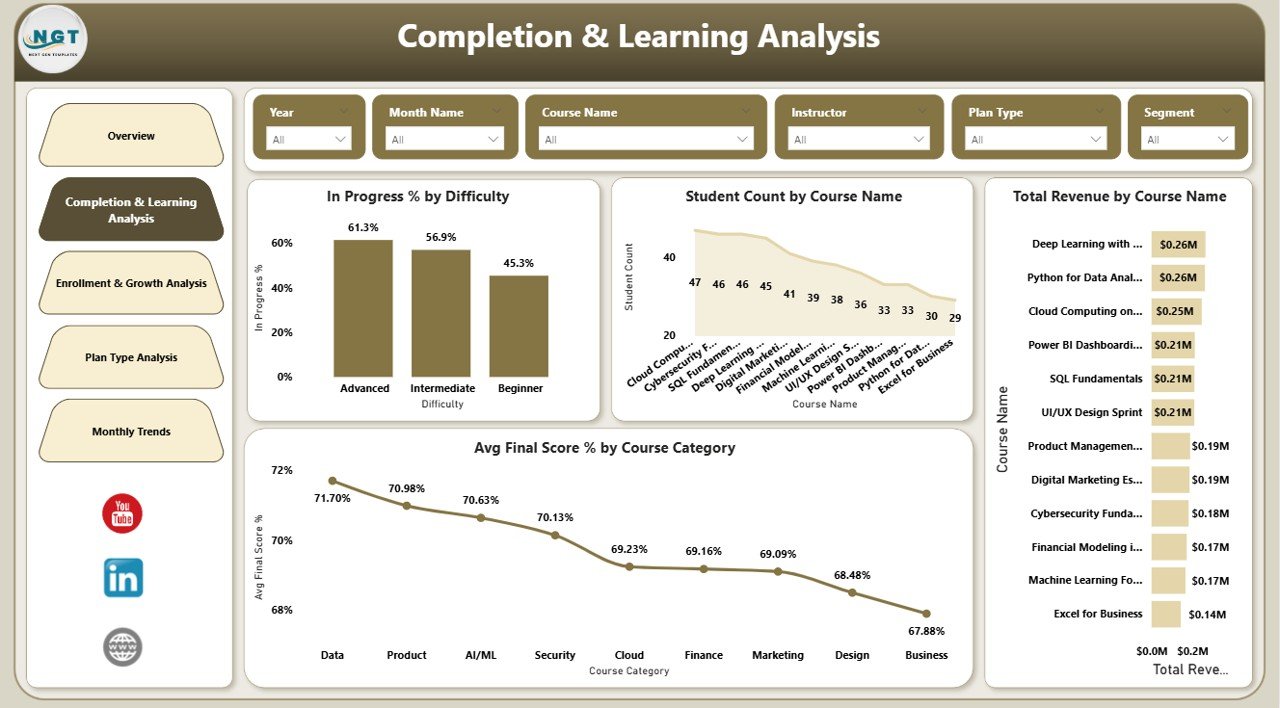
Completion & Learning Analysis Page: How Do Learners Perform?
The Completion & Learning Analysis page focuses on academic and learning outcomes. It helps teams understand how students interact with courses and content.
Key insights on this page include:
- Progress % by Difficulty – Compares learner progress across difficulty levels
- Student Count by Course Name – Identifies popular and underperforming courses
- Revenue by Course Name – Connects learning performance with financial results
- Avg. Final Score % by Course Category – Evaluates learning quality across categories
As a result, educators can improve course design, difficulty balance, and assessment strategies.
Click to buy EdTech Dashboard in Power BI
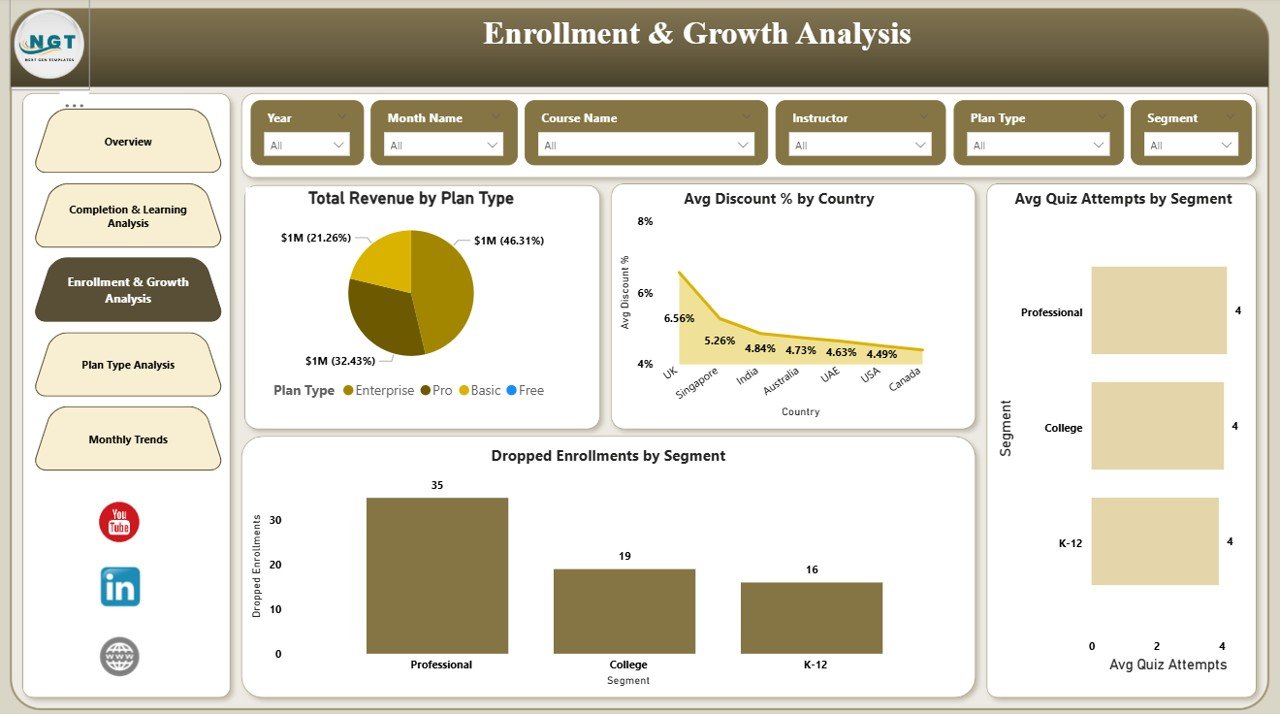
Enrollment & Growth Analysis Page: How Is the Platform Growing?
Growth analytics play a crucial role in EdTech success. The Enrollment & Growth Analysis page focuses on expansion, acquisition, and learner behavior.
This page provides insights such as:
- Revenue by Plan Type – Shows which pricing plans generate the most income
- Avg. Discount % by Country – Highlights regional pricing strategies
- Dropped by Segment – Identifies dropout trends across segments
- Avg. Quiz Attempts by Segment – Reveals learner engagement levels
Because growth trends appear clearly, marketing and sales teams can optimize acquisition strategies.
Click to buy EdTech Dashboard in Power BI
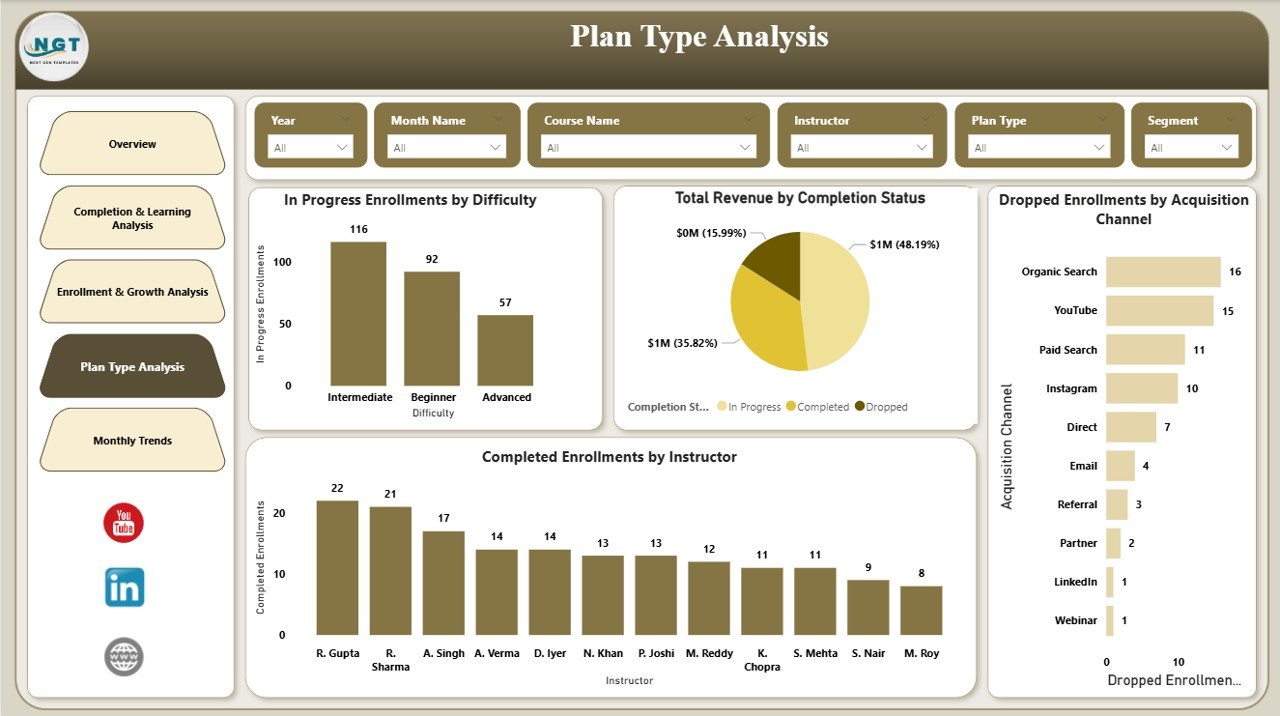
Plan Type Analysis Page: Which Plans Perform Best?
Pricing plans often determine profitability. The Plan Type Analysis page evaluates plan-based performance in depth.
Metrics included on this page:
- In Progress by Difficulty – Shows learner engagement by difficulty level
- Completed by Instructor – Compares instructor effectiveness
- Total Revenue by Completion Status – Links revenue to learner outcomes
- Dropped Enrollments by Acquisition Status – Analyzes onboarding effectiveness
Therefore, organizations can refine pricing models and instructor assignments.
Click to buy EdTech Dashboard in Power BI
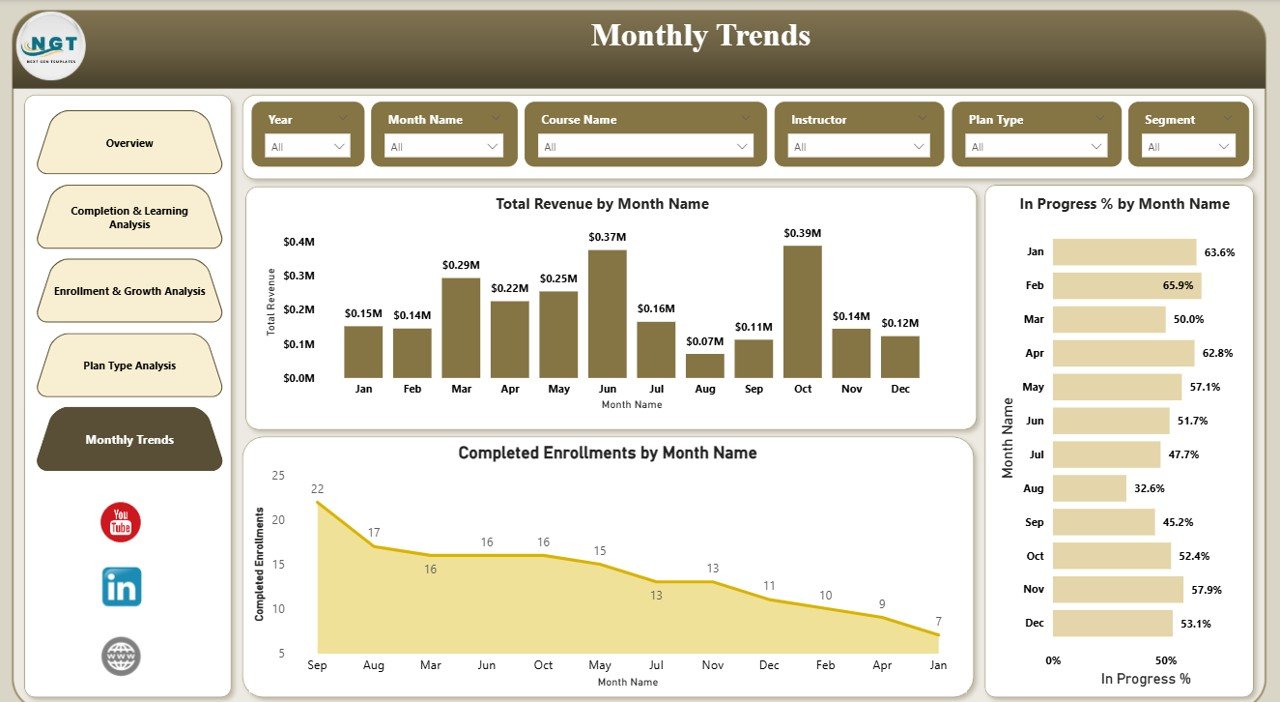
Monthly Trends Page: How Does Performance Change Over Time?
Trends matter because they reveal momentum. The Monthly Trends page tracks performance month by month.
This page includes:
- Total Revenue by Month – Shows financial growth patterns
- Completed Enrollments by Month – Tracks learning success trends
- In Progress % by Month – Monitors learner engagement consistency
Because trends appear visually, leaders can forecast future performance more accurately.
Click to buy EdTech Dashboard in Power BI
What Are the Advantages of an EdTech Dashboard in Power BI?
An EdTech Dashboard in Power BI offers several strategic advantages that directly impact learning quality and business growth.
Key advantages include:
- Centralized Data Visibility – All metrics appear in one dashboard
- Faster Decision-Making – Leaders act based on real-time insights
- Improved Learner Outcomes – Early identification of dropouts and challenges
- Revenue Optimization – Clear visibility into plans, segments, and courses
- Deep Analytics Without Complexity – No advanced technical skills required
As a result, organizations become more agile and data-driven.
What Opportunities for Improvement Does an EdTech Dashboard Reveal?
Beyond tracking performance, this dashboard highlights improvement opportunities.
Examples include:
- Identifying courses with low completion rates
- Detecting difficulty levels that cause learner dropouts
- Adjusting pricing plans based on revenue trends
- Improving instructor performance through data
- Enhancing learner engagement strategies
Therefore, continuous improvement becomes systematic and measurable.
How Does an EdTech Dashboard Improve Strategic Planning?
Strategic planning depends on reliable data. This dashboard supports planning by providing historical trends, comparative analysis, and predictive indicators.
Because leaders can analyze:
- Revenue growth patterns
- Enrollment seasonality
- Course popularity shifts
- Learner engagement changes
They can plan expansions, content investments, and marketing campaigns with confidence.
Best Practices for the EdTech Dashboard in Power BI
To maximize value, organizations should follow proven best practices.
Best practices include:
- Define clear KPIs aligned with learning and revenue goals
- Keep visuals simple and easy to interpret
- Use consistent filters across all pages
- Update data regularly for accuracy
- Train stakeholders to explore insights independently
When teams follow these practices, dashboards deliver long-term value.
Who Can Benefit from an EdTech Dashboard in Power BI?
This dashboard serves multiple stakeholders across the EdTech ecosystem.
Beneficiaries include:
- EdTech founders and executives
- Academic and learning managers
- Course instructors and content creators
- Sales and marketing teams
- Data and analytics professionals
Because the dashboard adapts to different roles, it supports organization-wide alignment.
How Does Power BI Enhance EdTech Analytics Compared to Excel?
Although Excel remains powerful, Power BI offers advanced visualization, scalability, and interactivity.
Power BI enables:
- Real-time filtering and drill-downs
- Interactive visuals and dashboards
- Better performance with large datasets
- Seamless sharing and collaboration
Therefore, EdTech organizations achieve deeper insights with less effort.
Conclusion: Why Should You Use an EdTech Dashboard in Power BI?
An EdTech Dashboard in Power BI transforms scattered education data into actionable intelligence. It empowers organizations to improve learner outcomes, optimize revenue, and scale sustainably.
Because the dashboard combines academic performance, engagement metrics, and financial insights, it supports smarter and faster decisions. As EdTech competition intensifies, data-driven clarity becomes essential.
If you want full control over your EdTech performance, this dashboard provides the visibility you need.
Frequently Asked Questions About EdTech Dashboard in Power BI
What is the main purpose of an EdTech Dashboard in Power BI?
The main purpose is to track learning performance, enrollment trends, and revenue metrics in one interactive platform for better decision-making.
Can non-technical users use an EdTech Dashboard in Power BI?
Yes, Power BI dashboards use visual and interactive elements that non-technical users can easily understand and explore.
Does the EdTech Dashboard support real-time data?
Yes, Power BI supports scheduled and real-time data refresh depending on the data source configuration.
Can this dashboard handle large EdTech datasets?
Yes, Power BI efficiently handles large datasets and complex relationships without performance issues.
Is the EdTech Dashboard customizable?
Yes, organizations can customize KPIs, visuals, filters, and pages based on their specific requirements.
How does this dashboard help reduce learner dropouts?
It identifies dropout patterns by course, segment, difficulty level, and acquisition source, enabling early intervention.
Can instructors benefit from this dashboard?
Yes, instructors can analyze completion rates, average scores, and learner engagement to improve teaching strategies.
Is Power BI suitable for growing EdTech startups?
Absolutely. Power BI scales easily and supports growth without requiring complex infrastructure.
Visit our YouTube channel to learn step-by-step video tutorials
Watch the step-by-step video tutorial:
Click to buy EdTech Dashboard in Power BI