In today’s fast-evolving digital education landscape, data-driven decision-making has become vital for every EdTech organization. Whether you are running an online learning platform, managing a digital academy, or leading a training institution, understanding performance through Key Performance Indicators (KPIs) ensures sustainable growth and measurable outcomes.
That’s where the EdTech KPI Scorecard in Excel comes in — a powerful, ready-to-use template designed to help you track educational, operational, and financial performance efficiently. Built entirely in Microsoft Excel, this scorecard gives you a complete overview of how your EdTech initiatives perform month-to-month and year-to-date.
Click to Purchases EdTech KPI Scorecard in Excel
What Is an EdTech KPI Scorecard in Excel?
An EdTech KPI Scorecard is a structured Excel-based reporting system that helps institutions and learning companies monitor their key metrics with clarity and consistency. It enables stakeholders to view, analyze, and compare actual results with defined targets across multiple performance areas such as:
-
Student engagement
-
Course completion rates
-
Learning outcomes
-
Instructor performance
-
Platform growth
-
Financial performance
By automating calculations and using interactive features like dropdowns, conditional formatting, and charts, the EdTech KPI Scorecard saves time and simplifies performance reporting for management and educators alike.
Click to Purchases EdTech KPI Scorecard in Excel
Key Features of the EdTech KPI Scorecard in Excel
This scorecard template has been designed for simplicity, flexibility, and impact. It includes four essential worksheets that form a complete reporting ecosystem.
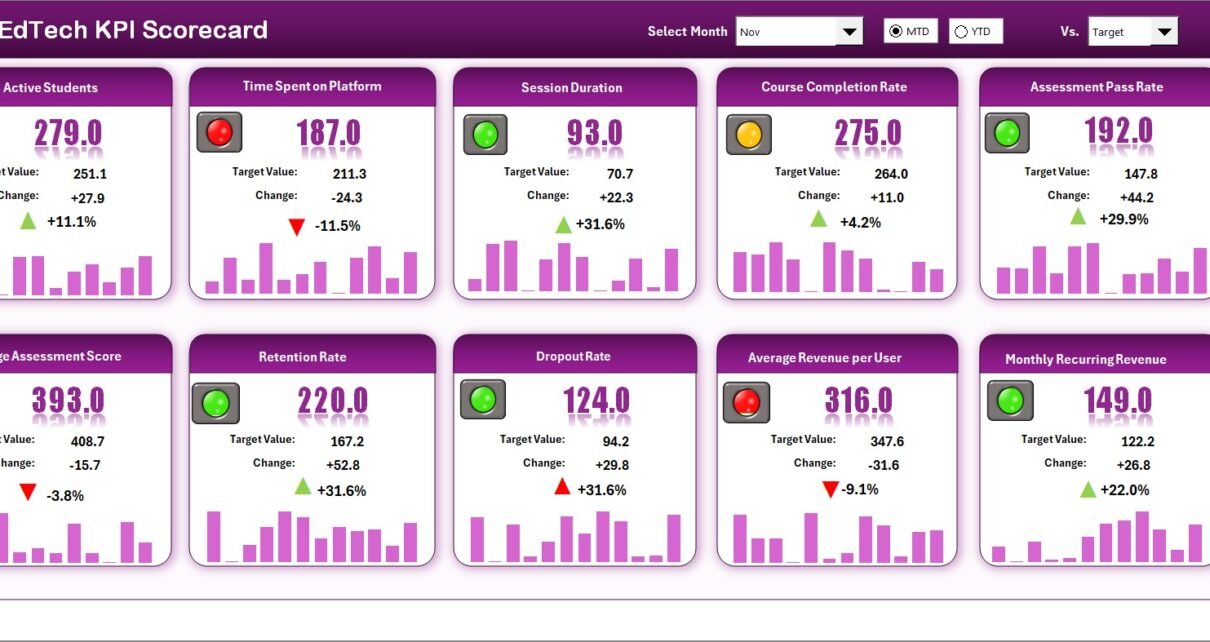
1️⃣ Scorecard Sheet – The Performance Dashboard
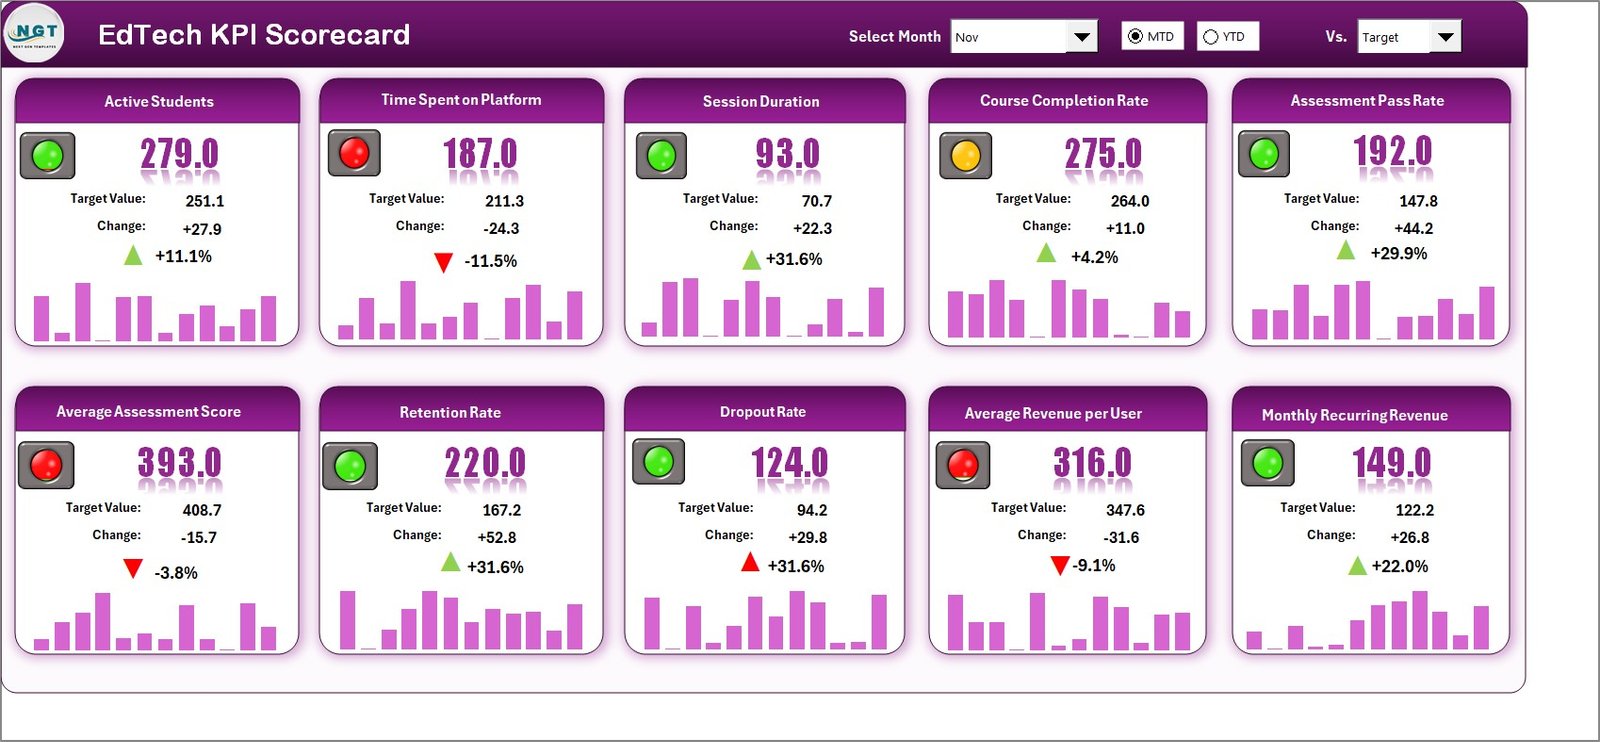
The Scorecard Sheet serves as the central interface where you can view all KPI results in one place.
Key features include:
-
🎯 Dropdown Menus: Easily select the month and view Month-to-Date (MTD) or Year-to-Date (YTD) results.
-
📊 Actual vs Target Comparison: Instantly compare actual performance with pre-set targets for each KPI.
-
🟢🔴 Visual Indicators: Conditional formatting highlights KPIs that meet or miss their goals using color-coded arrows or icons.
-
📘 Comprehensive View: Quickly access all KPI data, including trends, targets, and progress indicators, for a holistic understanding.
This sheet provides an instant performance snapshot for management reviews, presentations, and decision-making meetings.
2️⃣ KPI Trend Sheet – Analyze Trends Over Time
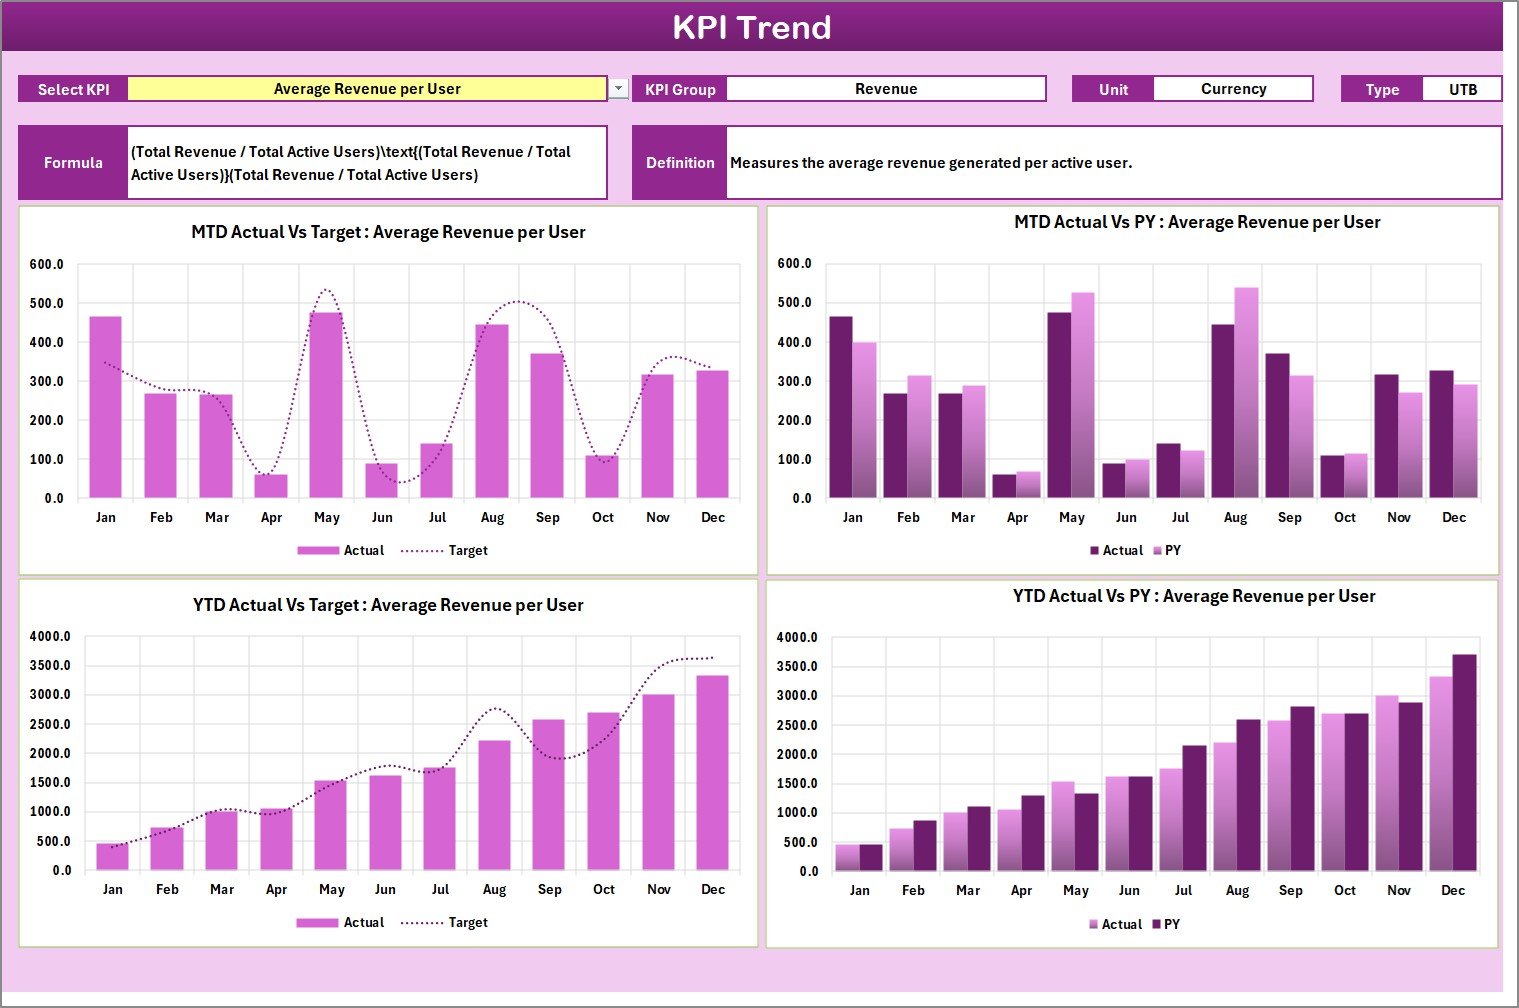
The KPI Trend Sheet gives you a visual representation of performance trends. You can select any KPI from a dropdown (located at range C3) and view its trend over time.
Features include:
-
KPI Metadata Display: The selected KPI’s Group, Unit, Type (Lower/Upper the Better), Formula, and Definition are displayed automatically.
-
Dynamic Trend Charts: Interactive charts show Actual, Target, and Previous Year (PY) performance for both MTD and YTD.
-
Performance Tracking: Identify patterns, progress, and anomalies over different time periods.
This sheet helps you understand long-term improvements or dips in performance and provides actionable insights for strategy adjustments.
Click to Purchases EdTech KPI Scorecard in Excel
3️⃣ Input Data Sheet – Capture All KPI Values
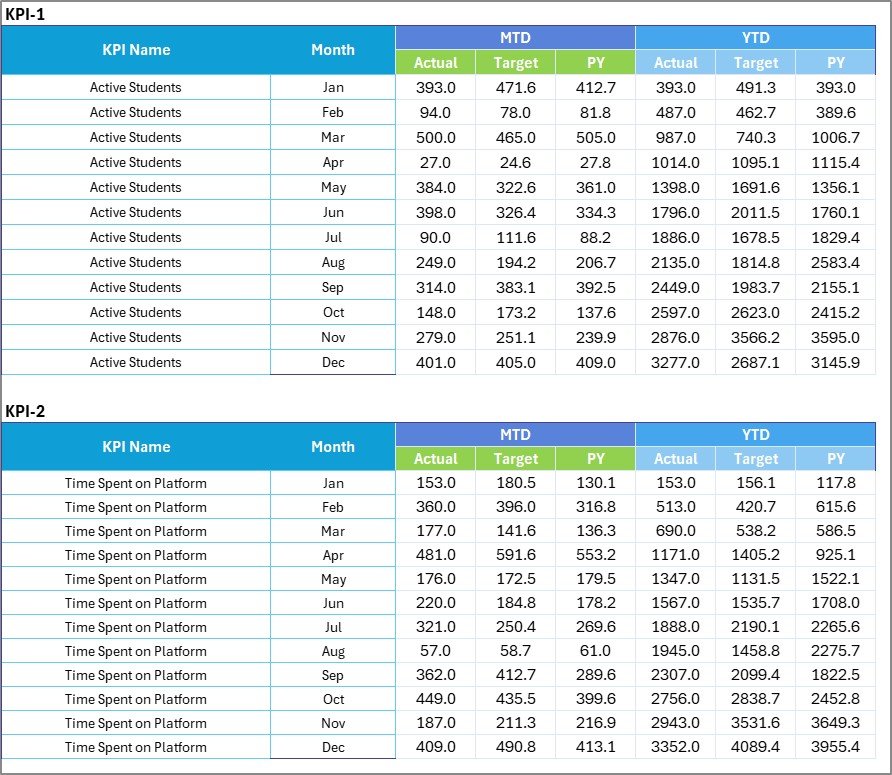
The Input Data Sheet is the data entry point for your scorecard. It stores all actual, target, and previous year data for each KPI.
Highlights:
-
Simple Data Entry: Enter data directly in organized columns.
-
Automated Updates: Once data is entered, the scorecard automatically reflects updated performance.
-
Scalable Structure: Add more KPIs or months as your EdTech operations expand.
Keeping this sheet updated ensures the dashboard remains accurate and reliable.
4️⃣ KPI Definition Sheet – Standardize Your Metrics
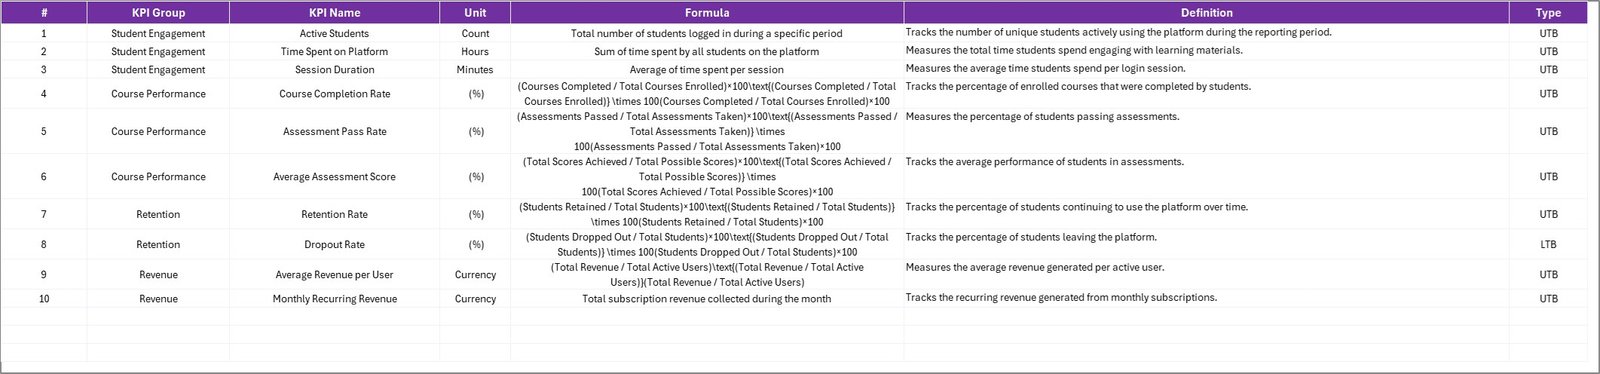
This sheet defines the logic behind every KPI to maintain uniformity and transparency across the organization.
You can record:
-
KPI Name
-
KPI Group (such as Academic, Engagement, Financial, or Operational)
-
Unit of Measurement (%, Count, Score, etc.)
-
Formula Used for Calculation
-
Definition or Description
-
Type (Upper the Better / Lower the Better)
This structure ensures all stakeholders interpret each KPI consistently, preventing confusion and maintaining data integrity.
Why Use an EdTech KPI Scorecard in Excel?
Education technology organizations generate vast amounts of data daily. From learner progress to platform traffic, each number tells a story. However, without a structured system to monitor KPIs, valuable insights may go unnoticed.
Here’s why using an Excel-based EdTech KPI Scorecard can transform your reporting process:
1. Centralized Performance Tracking
All your metrics — from student engagement to ROI — are available in one unified workbook.
2. Instant Visual Insights
Charts, conditional formatting, and color-coded visuals help identify performance gaps at a glance.
3. Automated Comparison
MTD, YTD, and PY comparisons instantly reveal growth patterns and problem areas.
4. Customizable and Scalable
Easily modify KPIs, formulas, or visuals based on your institution’s evolving needs.
5. No Complex Tools Needed
Built in Excel, it requires no coding or specialized software — accessible for everyone.
Important KPIs to Track in EdTech
To ensure balanced performance analysis, you should include KPIs from multiple categories. Below are some recommended ones:
Click to Purchases EdTech KPI Scorecard in Excel
Academic KPIs
-
Course Completion Rate (%) – Measures the percentage of students completing a course.
-
Average Assessment Score (%) – Evaluates student understanding and performance.
-
Instructor Effectiveness Score – Captures teaching quality based on feedback or results.
Engagement KPIs
-
Active Users per Month – Tracks consistent learner engagement.
-
Average Session Duration (Minutes) – Shows how long learners stay active.
-
Content Interaction Rate (%) – Measures engagement with course materials.
Operational KPIs
-
Support Ticket Resolution Time (Hours) – Tracks responsiveness to learner queries.
-
System Uptime (%) – Ensures platform reliability and uptime efficiency.
Financial KPIs
-
Revenue per Learner ($) – Tracks profitability per user.
-
Cost per Enrollment ($) – Helps evaluate marketing and acquisition efficiency.
-
Subscription Renewal Rate (%) – Measures customer loyalty and satisfaction.
These KPIs can be easily integrated into your Excel scorecard, allowing real-time performance tracking and better data-driven decisions.
Click to Purchases EdTech KPI Scorecard in Excel
Advantages of EdTech KPI Scorecard in Excel
Implementing an EdTech KPI Scorecard offers numerous benefits for educational institutions and online learning platforms.
1. Improved Transparency
All departments — academic, technical, marketing, and support — can align their activities to organizational goals with clear visibility of KPIs.
2. Faster Decision-Making
Real-time updates and automatic visual indicators make it easier for leaders to make quick, informed decisions.
3. Performance Accountability
By comparing Actual vs Target metrics, teams can identify responsibility areas and improve accountability.
4. Strategic Growth Insights
Trend analysis provides deeper understanding of what’s driving or hindering performance, enabling proactive adjustments.
5. Enhanced Productivity
Teams spend less time collecting and formatting data, and more time analyzing and improving outcomes.
6. Cost-Effective and Flexible
Excel-based templates are affordable, require no coding, and can adapt to any EdTech organization’s workflow.
Best Practices for Using the EdTech KPI Scorecard
To maximize the potential of your Excel-based KPI scorecard, follow these best practices:
1. Define Clear KPI Objectives
Before setting up the scorecard, ensure every KPI aligns with your organization’s goals — whether they’re improving student engagement, reducing churn, or enhancing course quality.
2. Keep Data Entry Consistent
Update the Input Data Sheet regularly with verified information to ensure accuracy and reliability.
3. Use Conditional Formatting Wisely
Highlight critical thresholds with colors (e.g., green for success, red for underperformance) to make reports more readable.
4. Review KPIs Monthly
Conduct monthly performance reviews using MTD and YTD comparisons to detect trends early.
5. Document KPI Definitions
Always maintain the KPI Definition Sheet to ensure clarity and consistency when onboarding new team members or stakeholders.
6. Automate Where Possible
Use Excel formulas like IF, AVERAGEIFS, SUMIFS, and dynamic ranges to automate calculations.
7. Keep the Scorecard Simple
Avoid cluttering the dashboard. Display only essential KPIs and provide drill-downs for deeper analysis on the Trend Sheet.
Click to Purchases EdTech KPI Scorecard in Excel
How the EdTech KPI Scorecard Supports Decision-Making
This Excel-based scorecard bridges the gap between raw data and actionable insight. It empowers different stakeholders in unique ways:
-
For Management: Provides a top-level view of performance against targets.
-
For Academic Teams: Highlights learner progress and teaching impact.
-
For Marketing Teams: Tracks enrollments, leads, and ROI.
-
For IT Teams: Monitors uptime, engagement metrics, and user satisfaction.
With regular updates and analysis, the EdTech KPI Scorecard becomes a strategic command center for data-driven growth.
Steps to Implement the EdTech KPI Scorecard in Excel
Here’s a quick guide to get started:
-
Identify KPIs based on your EdTech goals.
-
Enter definitions in the KPI Definition Sheet (with units, formulas, and type).
-
Record data in the Input Data Sheet (Actual, Target, PY).
-
Use dropdowns in the Scorecard Sheet to filter month or KPI group.
-
Analyze results using charts and conditional formatting.
-
Review trends periodically and update targets based on performance.
Within minutes, your institution can shift from manual reporting to an automated performance tracking system.
Conclusion
The EdTech KPI Scorecard in Excel is not just a reporting tool — it’s a strategic framework for continuous improvement. With clear metrics, visual dashboards, and automated calculations, this scorecard empowers EdTech leaders to focus on what truly matters: enhancing learning outcomes, optimizing operations, and driving sustainable growth.
Whether you manage an online academy, e-learning startup, or educational enterprise, this Excel template brings precision, speed, and clarity to your decision-making process.
Start tracking smarter today — because what gets measured, gets improved.
Frequently Asked Questions (FAQs)
1. What is the purpose of an EdTech KPI Scorecard?
It helps organizations measure performance across educational, operational, and financial areas using defined KPIs, improving accountability and strategic decision-making.
2. Can I customize the KPIs in this Excel template?
Yes. You can easily add, modify, or remove KPIs in the Input Data and Definition Sheets to align with your organization’s needs.
3. Does the scorecard support both MTD and YTD analysis?
Absolutely. You can view Month-to-Date and Year-to-Date data side by side to understand short- and long-term trends.
4. How often should I update the scorecard?
Ideally, you should update it monthly or after every major reporting cycle to ensure accuracy and relevance.
5. Is it suitable for both small and large EdTech organizations?
Yes. The scorecard is scalable and adaptable for startups, universities, training companies, or large EdTech enterprises.
Click to Purchases EdTech KPI Scorecard in Excel
Visit our YouTube channel to learn step-by-step video tutorials