In today’s data-driven education landscape, institutions must continuously evaluate and improve their performance. Whether you’re running a school, university, training center, or e-learning platform, tracking the right Key Performance Indicators (KPIs) is crucial. But managing this data manually can become overwhelming. That’s where the Education and Learning Performance KPI Dashboard in Excel comes in — your all-in-one, ready-to-use solution to monitor educational outcomes and optimize performance.
This comprehensive guide will walk you through the dashboard features, advantages, best practices, and how it can revolutionize your education system — even if you’re not a tech expert!
Click to Purchases Education and Learning Performance KPI Dashboard in Excel
What Is the Education and Learning Performance KPI Dashboard in Excel?
The Education and Learning Performance KPI Dashboard is an Excel-based tool that enables educators and administrators to monitor, analyze, and enhance academic performance through visual data. Built with powerful formulas, conditional formatting, drop-downs, and automated charts, this dashboard consolidates every key metric in one place — saving you hours of manual tracking.
It includes 7 fully automated worksheet tabs designed to make your KPI tracking easier and smarter.
What’s Inside the Dashboard? (Sheet-by-Sheet Breakdown)
Home Sheet – Your Command Center
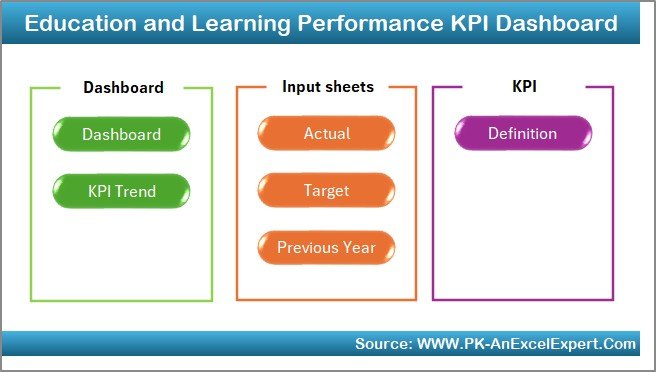
This is the index or navigation sheet where six quick-access buttons help you jump to the main sections of the dashboard. It keeps everything organized and user-friendly, even for first-time users.
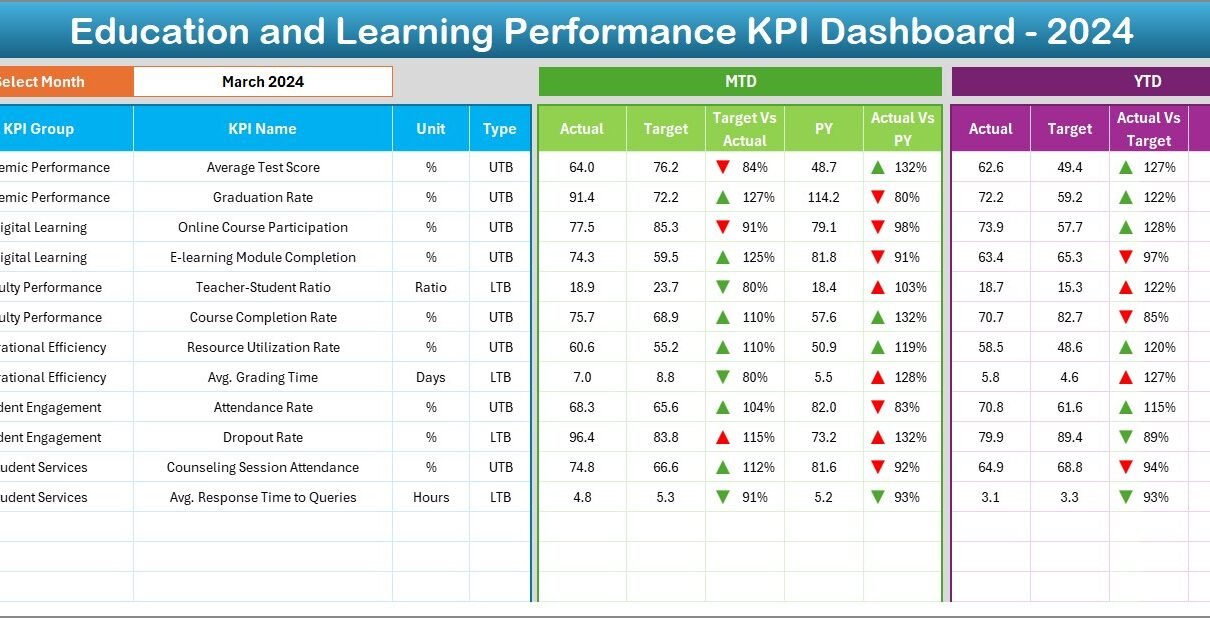
Dashboard Sheet – One-Stop Visual Insight
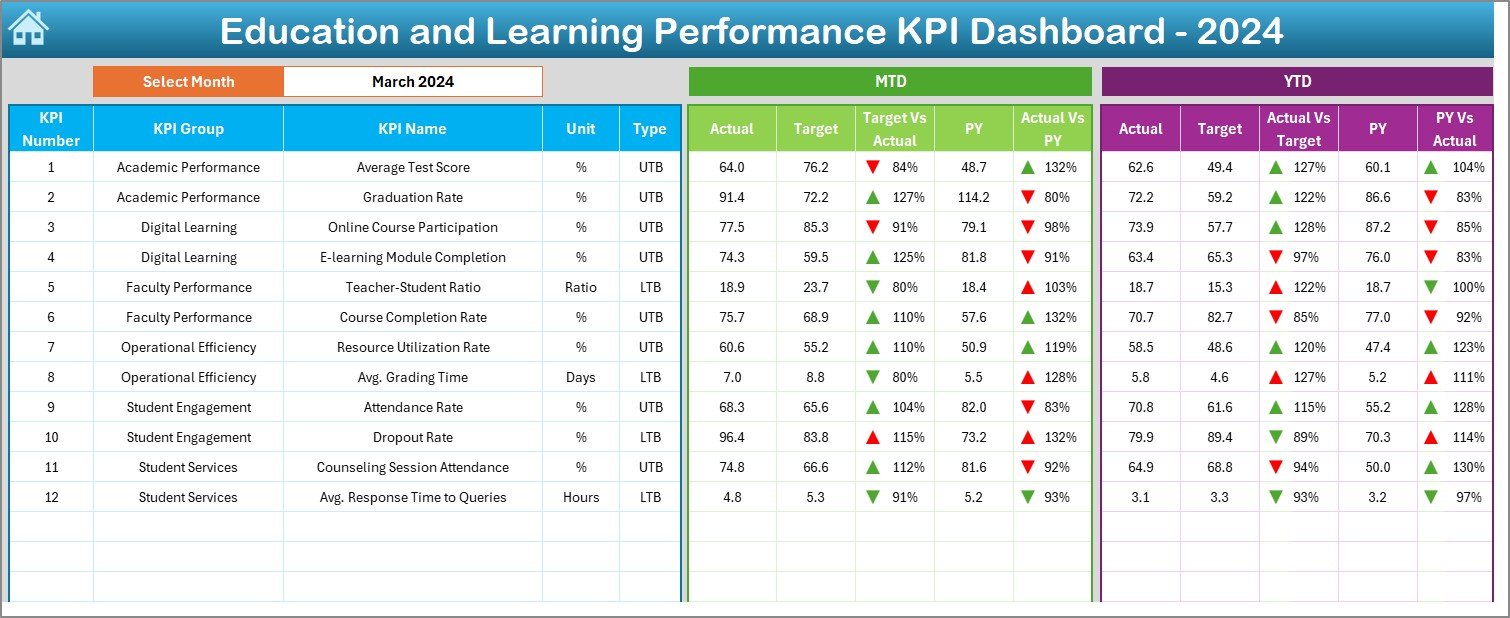
This is the heart of the template. Simply select the month from the drop-down in cell D3, and the entire dashboard updates automatically.
It shows:
-
MTD (Month-to-Date) values for Actual, Target, and Previous Year
-
YTD (Year-to-Date) values for the same
-
Visual arrows to instantly highlight whether you’re ahead or behind targets
-
Color-coded conditional formatting for easy data interpretation
This sheet is ideal for presentations and decision-making meetings.
Click to Purchases Education and Learning Performance KPI Dashboard in Excel
KPI Trend Sheet – Analyze Any KPI Over Time
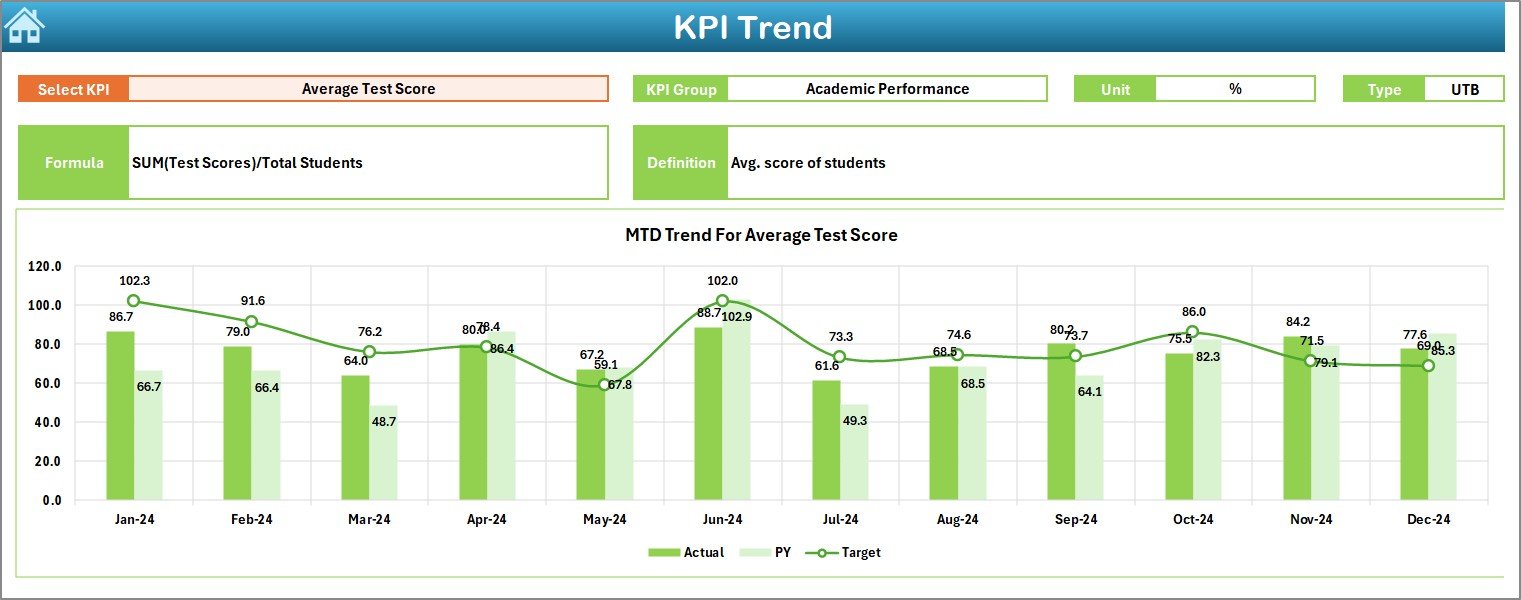
Want to dig deeper into a specific KPI?
Select the KPI from the drop-down in cell C3, and the sheet instantly displays:
-
KPI Group
-
Unit of Measurement
-
KPI Type (UTB: Upper the Better or LTB: Lower the Better)
-
Formula
-
Definition
Below this, you’ll see MTD and YTD trend charts comparing Actual vs. Target vs. Previous Year. It’s an excellent tool for spotting trends and taking timely action.
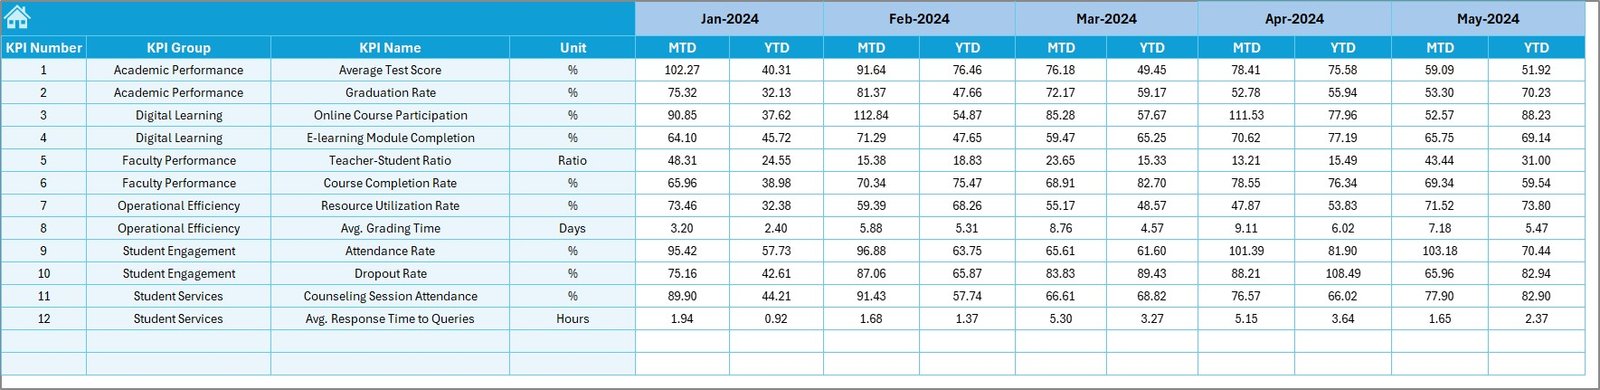
Actual Numbers Input Sheet – Update Your Raw Data
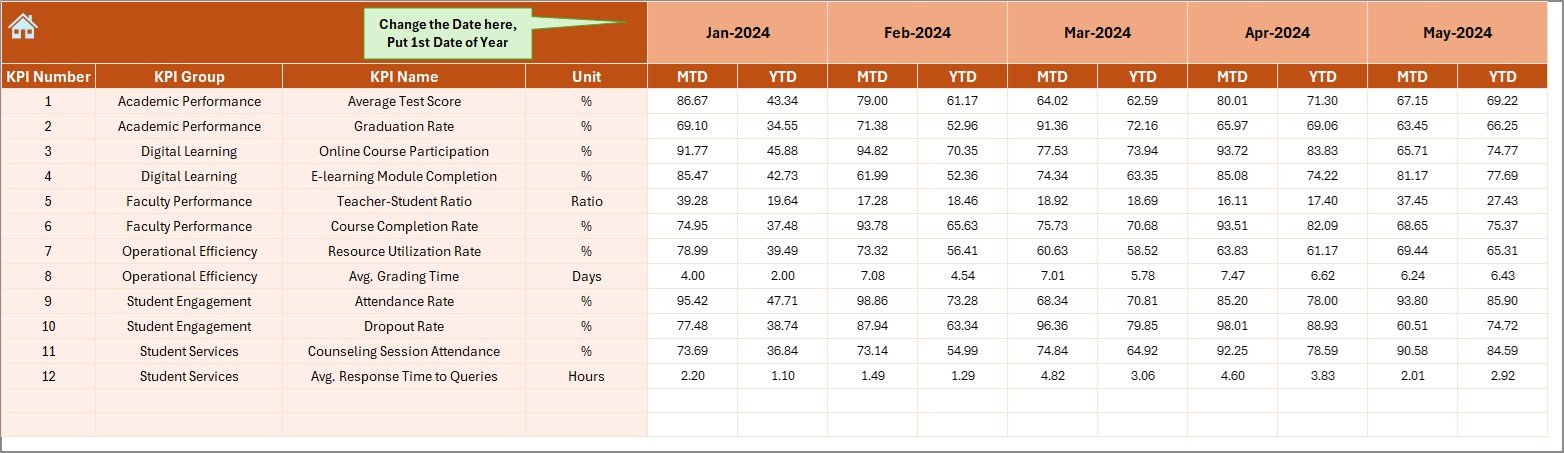
Here’s where you enter real performance figures each month. Just input the starting month in cell E1, and it dynamically adjusts the input range for MTD and YTD figures. This makes monthly updates simple and avoids confusion.
Target Sheet – Set Your Monthly Goals
This sheet is your planning zone. You can set MTD and YTD targets for each KPI across all months. Keeping track of targets alongside actual performance helps you measure progress accurately.
Previous Year Number Sheet – Year-on-Year Comparison
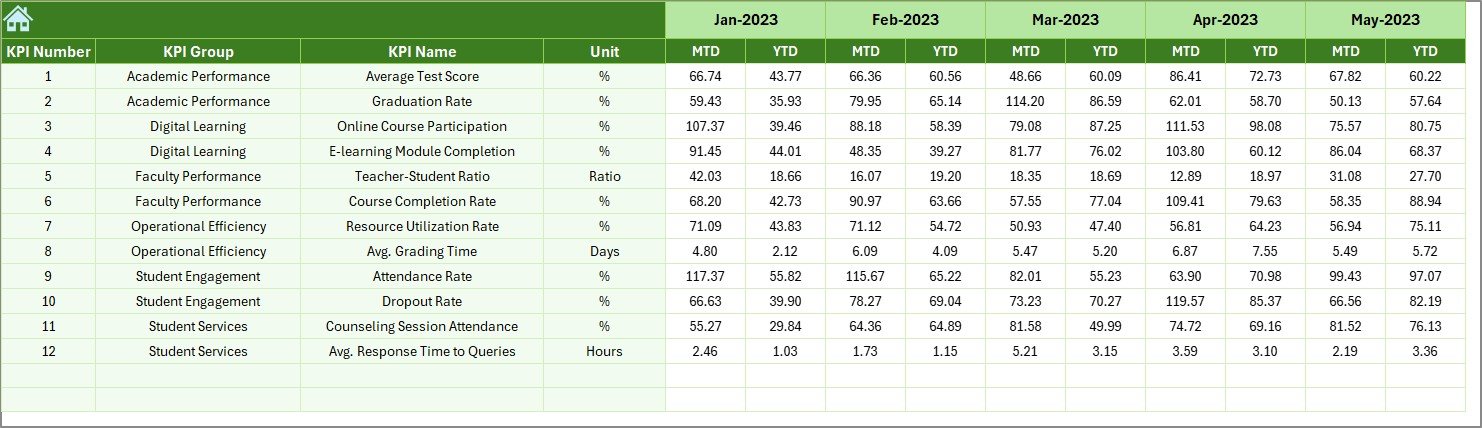
Add last year’s data in the same format as current year inputs. This allows the dashboard to display PY vs Actual trends and compare growth or decline.
KPI Definition Sheet – Know What You’re Measuring
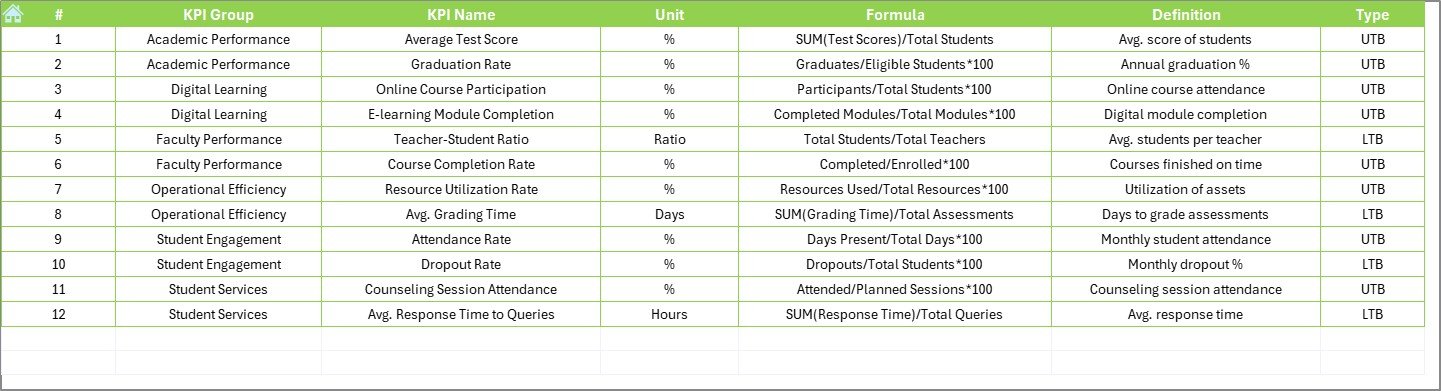
Clarity is power. In this tab, you’ll define each KPI in terms of:
-
Name
-
Group
-
Unit
-
Formula
-
Definition
This ensures everyone in your team understands what’s being measured and why.
Click to Purchases Education and Learning Performance KPI Dashboard in Excel
Advantages of Using the Education and Learning KPI Dashboard
Let’s take a look at how this dashboard makes a difference:
📈 Real-Time Tracking
Update the actual and target values monthly, and the dashboard instantly reflects the progress — no need to recalculate or redraw charts.
📊 Simplified Decision Making
The visual cues like up/down arrows and conditional formatting make it easy to identify areas that need improvement at a glance.
🧠 Improved Strategic Planning
Compare performance against both monthly goals and last year’s numbers, helping you make informed decisions backed by data.
🕒 Time-Saving Automation
Automated formulas and drop-down selections reduce manual errors and save hours of spreadsheet work.
🏫 Suitable for All Educational Settings
Whether you’re in K-12, higher education, training centers, or online learning platforms, this dashboard fits your needs.
Best Practices for Using the KPI Dashboard
To maximize the effectiveness of your KPI dashboard, follow these best practices:
1. Keep KPI Definitions Clear and Simple
Ensure your KPI Definition Sheet is well-documented so everyone knows what each metric represents.
2. Update Data Monthly
Set a routine to update the MTD/YTD figures and targets every month. Consistency is key.
3. Engage Stakeholders
Share the dashboard with staff, faculty, or board members to keep everyone aligned on goals and performance.
4. Use Conditional Formatting Wisely
Avoid clutter. Focus only on KPIs that matter and use formatting to highlight important metrics.
5. Review Trends Regularly
Don’t just look at one month — use the KPI Trend Sheet to analyze long-term performance.
What KPIs Should You Track?
Here are some examples of common Education and Learning KPIs you can include in the dashboard:
-
Student Attendance Rate – % of students present
-
Graduation Rate – % of students who successfully graduate
-
Student-Teacher Ratio – Number of students per teacher
-
Average Test Scores – Overall academic performance
-
Course Completion Rate – % of students completing a course
-
Dropout Rate – % of students who discontinue
-
Faculty Performance Index – KPI scores for teachers
-
Learning Satisfaction Score – Based on surveys or feedback
-
Assignment Submission Rate – % of assignments turned in on time
-
Digital Resource Utilization – % of students using LMS or e-resources
-
Student Engagement Index – Interaction in class or online platforms
-
Training Program Effectiveness – Pre/post-training performance gains
Why Use Excel for This Dashboard?
You might wonder — why not use Power BI or any other data visualization software?
While Power BI is great, Excel is universally accessible, doesn’t require special training, and works well for organizations of all sizes. With built-in functions and VBA, Excel can handle robust dashboards efficiently — and you already have it on your system!
How to Get Started with the Template
Here’s how to start using your dashboard:
-
Open the Excel file
-
Go to the KPI Definition sheet and customize the KPIs
-
Enter your monthly Target and Actual data
-
Add last year’s data for reference
-
Go to the Dashboard tab and select a month
-
Review the updated KPIs and charts
-
Share insights with your team!
Conclusion
The Education and Learning Performance KPI Dashboard in Excel is more than just a template — it’s a powerful decision-making tool that brings clarity, structure, and efficiency to your institution. With real-time tracking, automated calculations, and visual storytelling, this dashboard empowers educators and administrators to lead with data.
So whether you’re managing an entire school system or running a small learning center, adopting this KPI dashboard will take your performance tracking to the next level.
Frequently Asked Questions (FAQs)
1. What is a KPI in Education?
A Key Performance Indicator (KPI) in education is a measurable value that indicates how effectively an institution is achieving key objectives like attendance, test scores, or graduation rates.
2. Can I customize the KPIs in this Excel dashboard?
Yes! The KPI Definition tab allows full customization — you can rename KPIs, modify formulas, and even add new ones.
3. Do I need to know Excel formulas to use this dashboard?
Not at all. Everything is pre-configured. Just input the data in designated cells, and the dashboard updates automatically.
4. Can I use this dashboard for corporate training programs?
Absolutely. This dashboard isn’t limited to schools — it’s also perfect for tracking employee training, development, and performance in a corporate setting.
5. Is the dashboard mobile or tablet-friendly?
While the dashboard is optimized for desktop use, it’s still viewable on tablets and mobile devices using Excel’s mobile app.
6. How many KPIs can I track in this dashboard?
There’s no strict limit. However, for optimal performance and readability, we recommend keeping it between 10 to 25 KPIs.
7. Can I integrate this Excel dashboard with other systems?
You can manually import/export data to/from other systems. If needed, Power Query or VBA can be used for more automation.
Visit our YouTube channel to learn step-by-step video tutorials
Click to Purchases Education and Learning Performance KPI Dashboard in Excel
Watch the step-by-step video tutorial: