In the world of modern education, data plays a crucial role in improving quality, tracking performance, and ensuring accountability. From student engagement to teaching effectiveness, institutions can now measure key performance indicators (KPIs) with ease using digital tools. Among the most effective solutions is the Education and Learning Quality Assurance KPI Dashboard in Excel.
If you’re an educator, academic administrator, or quality assurance officer, this article will show you how this powerful Excel dashboard can transform how you measure educational success—clearly, consistently, and with full control.
Click to Purchases Education and Learning Quality Assurance KPI Dashboard in Excel
What is a Quality Assurance KPI Dashboard in Education?
A Quality Assurance KPI Dashboard in the education sector is a smart tool that visually tracks and monitors key performance indicators related to academic quality and operational excellence. It helps educational institutions:
-
Monitor key metrics like dropout rate, student-teacher ratio, course completion rate, etc.
-
Compare performance month-over-month and year-over-year.
-
Stay aligned with goals and compliance standards.
Instead of struggling with multiple files, complex charts, or disconnected reports, this dashboard centralizes everything in a single Excel workbook—making it ideal for data-driven decision-making.
Why Use Excel for Education KPI Dashboards?
Before we go deeper into the features, you may wonder: Why Excel?
Excel is universally available, easy to use, and customizable without expensive software. It’s a familiar tool for most staff and doesn’t require coding knowledge to operate. Using Excel for KPI tracking:
-
Saves time and effort.
-
Increases accessibility for the entire team.
-
Enables robust analysis with pivot tables and charts.
-
Supports monthly, quarterly, and yearly comparisons easily.
So, if you’re looking for a no-code, affordable, and powerful solution, Excel is a perfect fit.
Overview of the Education and Learning Quality Assurance KPI Dashboard
This ready-to-use Excel dashboard template is designed to help schools, colleges, training institutions, and universities track and improve education quality KPIs with precision. Let’s walk through the different components of this solution:
Home Sheet – Central Navigation Panel

The Home Sheet acts as the control center. It features six intuitive navigation buttons that help you jump directly to the key sheets in one click.
Whether you need to input data, view trends, or analyze the dashboard, this screen makes navigation simple—even for beginners.
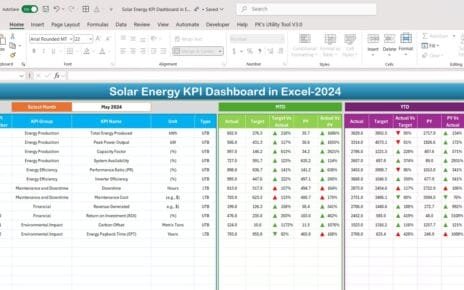
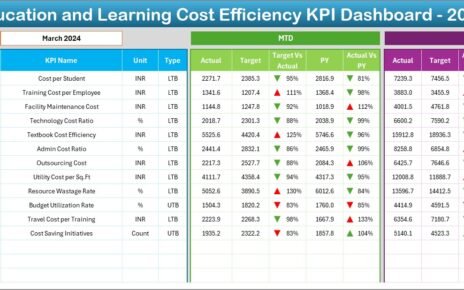
Dashboard Sheet – Real-Time KPI Overview
Click to Purchases Education and Learning Quality Assurance KPI Dashboard in Excel

The Dashboard Sheet provides a complete visual summary of your KPIs.
-
You can select the Month from a dropdown (cell D3), and all values will auto-refresh.
The dashboard compares:
- MTD (Month-to-Date) Actual, Target, and Previous Year
- YTD (Year-to-Date) Actual, Target, and Previous Year
-
Smart conditional formatting displays arrows for Target vs Actual and PY vs Actual—making it easy to spot trends.
This view is perfect for leadership meetings, board reviews, and monthly performance audits.
KPI Trend Sheet – Deep Dive into Metrics

Want to see how a specific KPI is performing over time?
Use the KPI Trend Sheet:
-
Select the KPI Name from a dropdown (cell C3).
View all the relevant metadata:
- KPI Group
- Unit
- Type (UTB – Upper the Better, LTB – Lower the Better)
- Formula
- Definition
-
Analyze MTD and YTD trends using interactive charts.
This allows data-driven insights for each KPI in isolation.
Click to Purchases Education and Learning Quality Assurance KPI Dashboard in Excel
Actual Numbers Input Sheet – Capture Live Data

The dashboard is only as good as the data it receives.
Use this sheet to:
-
Input MTD and YTD actual values for each KPI.
-
Select the relevant month from cell E1 to update data instantly.
-
Ensure the data entry process stays consistent across time periods.
It’s straightforward, user-friendly, and flexible for different departments.
Target Sheet – Set Performance Benchmarks

A dashboard without a benchmark is like a car without a destination.
The Target Sheet lets you:
-
Enter MTD and YTD target values for each KPI.
-
Update the monthly targets as academic plans evolve.
This ensures that you’re always comparing your actual results against realistic, time-bound goals.
Previous Year Number Sheet – Measure Long-Term Progress

Use this sheet to:
-
Input previous year’s data for each KPI (MTD and YTD).
-
Perform year-over-year (YOY) comparisons effortlessly.
Click to Purchases Education and Learning Quality Assurance KPI Dashboard in Excel
This perspective is critical to evaluate the long-term impact of teaching methods, administrative changes, or curriculum updates.
KPI Definition Sheet – Maintain Metric Clarity

Misunderstood metrics can lead to wrong decisions.
That’s why the KPI Definition Sheet is a must-have:
List every KPI along with its:
- Group
- Name
- Unit
- Formula
- Clear and concise definition
This acts as a dictionary for everyone using the dashboard and ensures consistency in reporting.
Advantages of Education & Learning Quality Assurance KPI Dashboard
✅ Real-Time Monitoring
You can track academic performance instantly—no waiting for manual reports.
✅ Data-Driven Decisions
With trends, targets, and actuals all in one place, your decisions become backed by facts, not assumptions.
✅ Improved Accountability
Whether it’s a department head or course coordinator, this tool helps ensure everyone meets their goals.
✅ Increased Efficiency
No need to manage multiple spreadsheets—one template does it all.
✅ Better Stakeholder Communication
With clean visuals and clear charts, you can easily present results to management, investors, or auditors.
Best Practices for Using the KPI Dashboard Effectively
-
Update Data Regularly
Keep the actuals and targets up to date every month for meaningful insights. -
Define Clear KPI Ownership
Assign responsibility for each KPI to ensure accountability. -
Keep Definitions Consistent
Always align your metrics with the definitions provided in the KPI sheet. -
Use Color Coding and Conditional Formatting
Visual indicators help identify performance gaps instantly. -
Review Monthly and Annually
Perform short-term and long-term reviews to spot trends and opportunities. -
Train Staff on Usage
Conduct quick workshops so that all team members know how to use the dashboard correctly.
How to Customize the Dashboard for Your Institution
Even though this Excel template is ready to use, you can customize it:
-
Add or remove KPIs based on your institution’s focus (e.g., e-learning platforms, technical training, etc.).
-
Localize the terminology or language.
-
Include additional sheets for specific reports (e.g., department-wise, gender-wise, or course-wise analysis).
The modular format of the dashboard makes customization simple and scalable.
Technical Requirements and Compatibility
This KPI dashboard is designed to work in Microsoft Excel 2016 or later (Windows or Mac). It uses:
-
Dropdown lists for KPI and month selection
-
Conditional formatting
-
Basic formulas (no complex VBA)
-
Pivot charts and tables for trend visualization
No external software or add-ons are needed.
Is This Dashboard Secure?
Click to Purchases Education and Learning Quality Assurance KPI Dashboard in Excel
Yes! Since it’s in Excel:
-
You can password-protect the file.
-
You can share it via OneDrive or Teams with limited access.
-
You can control editing permissions easily.
For institutions concerned about data security, Excel offers excellent built-in protection.
Ideal Users for This Dashboard
This dashboard can be used by:
-
School administrators
-
College deans and department heads
-
Quality assurance officers
-
Training managers in corporate learning environments
-
Government education boards
Anyone responsible for educational outcomes can use this dashboard to bring clarity, structure, and results.
Final Thoughts and Conclusion
The Education and Learning Quality Assurance KPI Dashboard in Excel is more than just a reporting tool—it’s a performance management system for academic excellence. It provides a holistic view of institutional performance, fosters a culture of transparency, and empowers teams to improve continuously.
Frequently Asked Questions (FAQs)
1. What KPIs can I track using this dashboard?
You can track metrics such as student-teacher ratio, dropout rates, exam pass rates, course completion rates, and much more. The dashboard is fully customizable to include the KPIs relevant to your institution.
2. Do I need any coding skills to use this dashboard?
No. This dashboard is built using Microsoft Excel formulas and dropdowns. You don’t need VBA or advanced technical skills.
3. Can I use this for school, college, or training institute?
Absolutely! It’s perfect for all types of educational setups—schools, colleges, universities, and training organizations.
4. Is this dashboard mobile-friendly?
While Excel is not designed for full mobile responsiveness, you can still view and edit it using Excel Mobile or Microsoft Teams on tablets and smartphones.
5. How often should I update the data?
Ideally, you should update MTD and YTD values monthly. This keeps the dashboard relevant and helps in accurate decision-making.
6. Can I add more KPIs to the dashboard?
Yes! You can add more rows to the KPI Definition, Actuals, Targets, and Previous Year sheets as needed.
7. Can I print the dashboard for reports?
Yes, the layout is designed for easy printing. You can also export the dashboard sheet as a PDF.
Visit our YouTube channel to learn step-by-step video tutorials
Click to Purchases Education and Learning Quality Assurance KPI Dashboard in Excel