Managing elder care services requires accuracy, empathy, efficiency, and accountability. However, many elder care organizations still depend on manual reports, scattered Excel files, or delayed MIS updates. As a result, decision-makers struggle to monitor service quality, caregiver performance, compliance, and operational efficiency on time.
That is exactly where an Elder Care Services KPI Dashboard in Power BI creates real impact.
This detailed guide explains what an Elder Care Services KPI Dashboard in Power BI is, how it works, its page-wise structure, key metrics, advantages, best practices, and frequently asked questions. By the end of this article, you will clearly understand how this ready-to-use dashboard helps elder care providers deliver better care while maintaining operational control.
Click to buy Elder Care Services KPI Dashboard in Power BI
What Is an Elder Care Services KPI Dashboard in Power BI?
An Elder Care Services KPI Dashboard in Power BI is a centralized, interactive analytics solution designed to track and monitor key performance indicators related to elder care operations.
Instead of reviewing long reports, managers can view real-time KPI performance on a single screen. Moreover, the dashboard converts raw Excel data into visual insights using cards, tables, icons, and trend charts.
As a result, care managers, administrators, and leadership teams gain instant clarity on:
- Service quality
- Caregiver efficiency
- Compliance performance
- Cost control
- Resident well-being outcomes
Why Do Elder Care Organizations Need KPI Dashboards?
Elder care services operate in a high-responsibility environment. Therefore, even small performance gaps can impact resident safety, satisfaction, and compliance.
However, without structured KPI tracking:
- Teams miss early warning signs
- Manual reporting consumes valuable time
- Data inconsistencies increase errors
- Decision-making becomes reactive
An Elder Care Services KPI Dashboard in Power BI solves these challenges by delivering timely, accurate, and visual insights.
How Does an Elder Care Services KPI Dashboard in Power BI Work?
The dashboard works by connecting Power BI to a structured Excel data source. After that, Power BI processes, models, and visualizes the data dynamically.
Data Flow Overview
- Teams enter data into Excel input sheets
- Power BI imports and refreshes the data
- KPI calculations update automatically
- Visuals reflect MTD and YTD performance
- Users analyze trends and take action
Because of this structure, the dashboard remains easy to update, scalable, and user-friendly.
What Data Sources Does the Dashboard Use?
The Elder Care Services KPI Dashboard in Power BI uses a single Excel file as its data source. This design keeps implementation simple and cost-effective.
Excel Worksheets Used
Input_Actual Sheet
Here, users enter actual KPI performance data:
- KPI Name
- Month (use the first date of the month)
- MTD Actual values
- YTD Actual values
Input_Target Sheet
This sheet stores target benchmarks:
- KPI Name
- Month (first date of the month)
- MTD Target values
- YTD Target values
KPI Definition Sheet
This sheet defines KPI metadata:
- KPI Number
- KPI Group
- KPI Name
- Unit
- Formula
- Definition
- Type (LTB or UTB)
Because of this structure, users can update data without touching Power BI logic.
What Pages Are Available in the Elder Care Services KPI Dashboard?
The dashboard contains three professionally designed pages, each serving a specific analytical purpose.
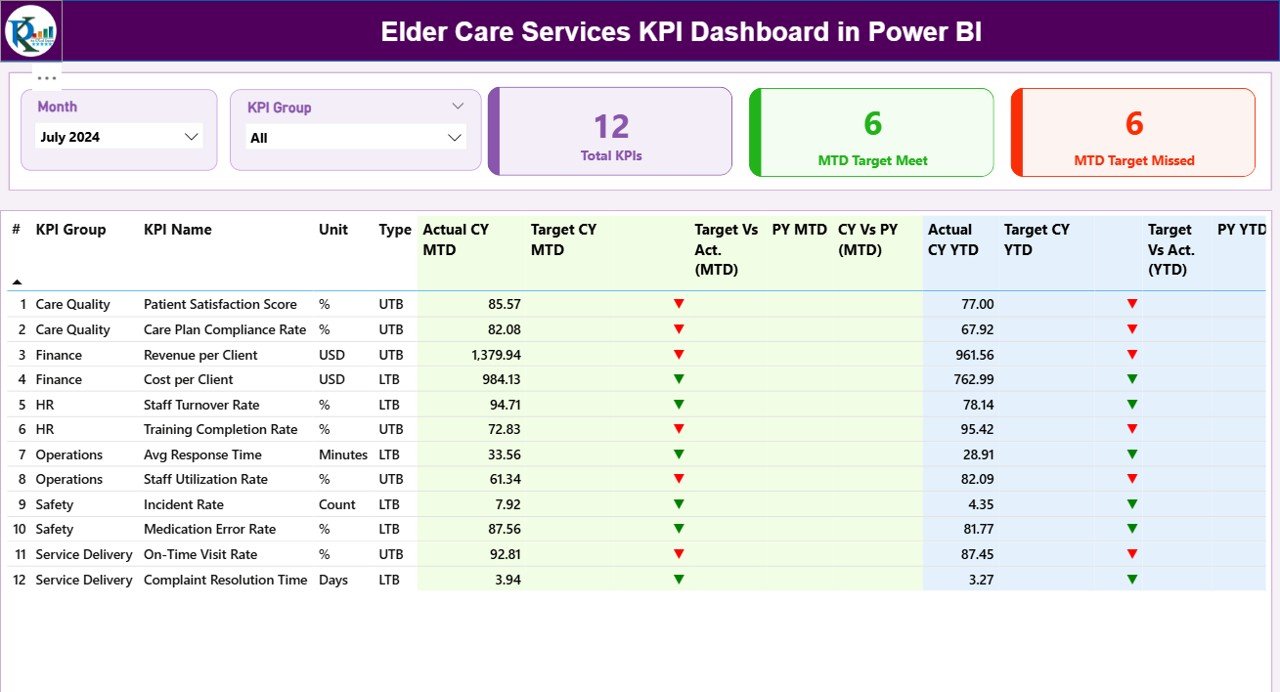
Summary Page: How Does It Provide Instant Performance Visibility?
The Summary Page acts as the control center of the dashboard.
Top-Level Slicers
At the top of the page, users can filter data using:
- Month slicer
- KPI Group slicer
These slicers instantly refresh all visuals.
KPI Cards on the Summary Page
The dashboard displays three high-impact KPI cards:
- Total KPIs Count
- MTD Target Meet Count
- MTD Target Missed Count
These cards immediately highlight overall performance health.
Detailed KPI Performance Table
Below the cards, the dashboard shows a comprehensive KPI table.
Columns Included in the Table
- KPI Number – Sequential identifier
- KPI Group – Category of KPI
- KPI Name – Name of the metric
- Unit – Measurement unit
- Type – LTB (Lower the Better) or UTB (Upper the Better)
MTD Performance Metrics
- Actual CY MTD – Current year MTD actual
- Target CY MTD – Current year MTD target
- MTD Icon – ▲ or ▼ icons with green/red colors
- Target vs Actual (MTD) – Actual ÷ Target (%)
- PY MTD – Previous year MTD value
- CY vs PY (MTD) – CY MTD ÷ PY MTD (%)
These metrics help teams assess short-term performance.
YTD Performance Metrics
- Actual CY YTD – Current year YTD actual
- Target CY YTD – Current year YTD target
- YTD Icon – ▲ or ▼ icons with status colors
- Target vs Actual (YTD) – Actual ÷ Target (%)
- PY YTD – Previous year YTD value
- CY vs PY (YTD) – CY YTD ÷ PY YTD (%)
As a result, leaders can track long-term progress effectively.
Click to buy Elder Care Services KPI Dashboard in Power BI
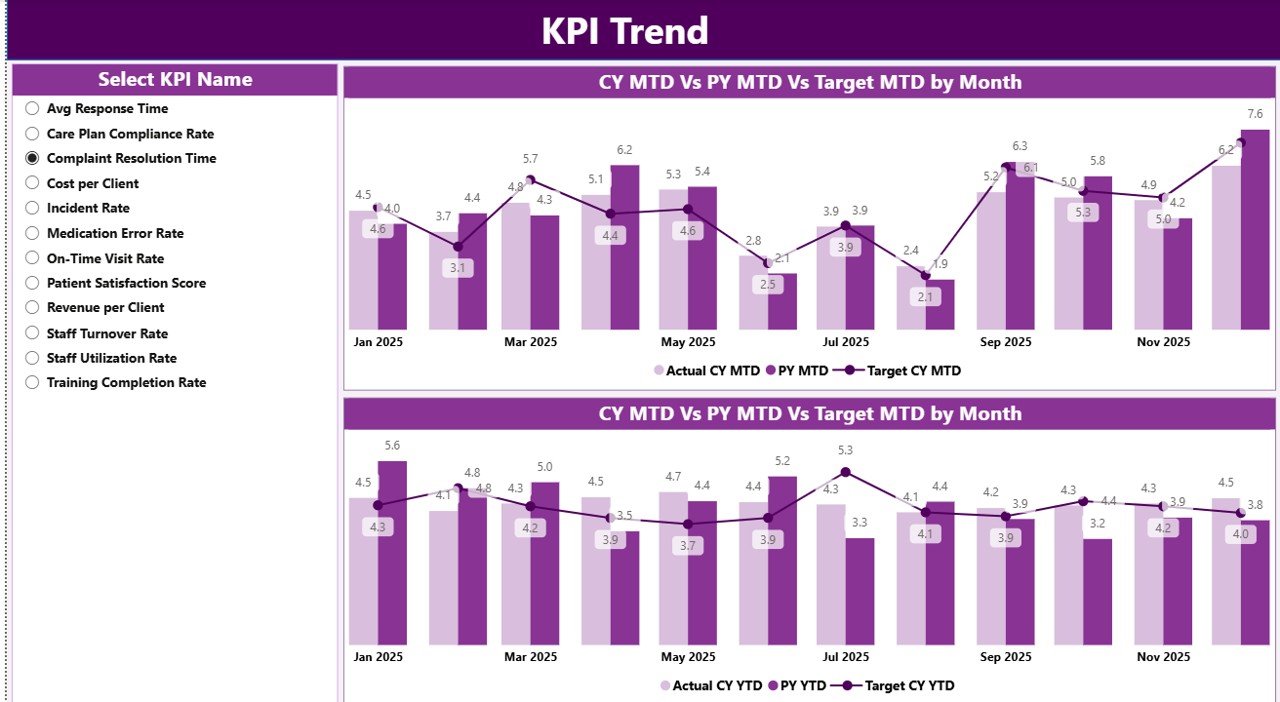
KPI Trend Page: How Does It Show Performance Over Time?
The KPI Trend Page focuses on historical analysis.
Key Features of the KPI Trend Page
- KPI Name slicer on the left
- Two combo charts:
MTD trend (CY, PY, Target)
YTD trend (CY, PY, Target)
Because of these visuals, users can quickly identify:
- Improvement patterns
- Seasonal trends
- Performance gaps
Click to buy Elder Care Services KPI Dashboard in Power BI
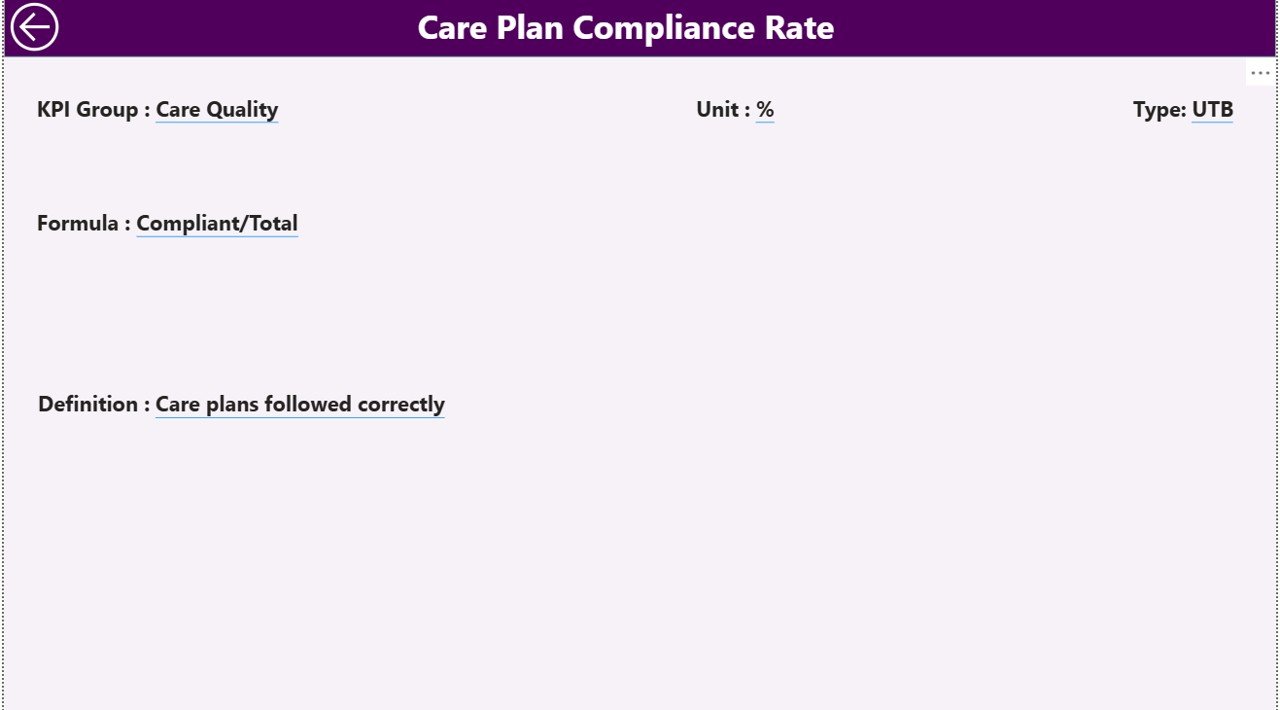
KPI Definition Page: Why Is It Important?
The KPI Definition Page serves as a hidden drill-through page.
What Information Does It Show?
- KPI Formula
- KPI Definition
- KPI Type (LTB or UTB)
- KPI Group and Unit
Users can drill through from the Summary Page to understand what a KPI means and how it is calculated.
Moreover, a Back button on the top-left corner allows easy navigation.
Click to buy Elder Care Services KPI Dashboard in Power BI
Which KPIs Can You Track in Elder Care Services?
An Elder Care Services KPI Dashboard in Power BI supports a wide range of KPIs, including:
Care Quality KPIs
- Care Plan Compliance Rate
- Incident Resolution Time
- Medication Error Rate
- Resident Satisfaction Score
Operational KPIs
- Caregiver Utilization Rate
- Average Response Time
- Staff Absenteeism Rate
- Overtime Hours
Financial KPIs
- Cost per Resident
- Budget Variance
- Revenue per Care Program
Compliance KPIs
- Audit Compliance Rate
- Training Completion Rate
- Documentation Accuracy
Because the dashboard remains flexible, organizations can easily add or modify KPIs.
Advantages of Elder Care Services KPI Dashboard in Power BI
- Centralized Performance Monitoring
The dashboard consolidates all KPIs into a single source of truth.
- Real-Time Insights
As data updates, visuals refresh instantly.
- Better Decision-Making
Leaders act faster with clear insights.
- Reduced Manual Reporting
Teams save hours previously spent on spreadsheets.
- Improved Accountability
Icons and comparisons clearly show responsibility areas.
- Easy Scalability
Organizations can add new KPIs without redesigning the dashboard.
How Does Power BI Improve Elder Care Service Management?
Power BI enhances elder care management by combining:
- Interactive visuals
- Drill-down analysis
- Automated calculations
- Secure data access
As a result, management teams shift from reactive reporting to proactive decision-making.
Best Practices for the Elder Care Services KPI Dashboard in Power BI
- Define KPIs Clearly
Always document formulas and definitions.
- Use LTB and UTB Logic Correctly
Choose KPI types carefully to avoid misleading indicators.
- Update Data Monthly
Maintain consistency by updating data on fixed schedules.
- Validate Data Before Refresh
Ensure accuracy in Excel inputs.
- Keep Visuals Clean
Avoid overcrowding the dashboard.
- Train End Users
Help users understand slicers and drill-through features.
Who Should Use an Elder Care Services KPI Dashboard?
This dashboard benefits:
- Elder care administrators
- Operations managers
- Quality assurance teams
- Finance managers
- Senior leadership
Because of its simplicity, even non-technical users can operate it easily.
Conclusion: Why Should You Use an Elder Care Services KPI Dashboard in Power BI?
An Elder Care Services KPI Dashboard in Power BI transforms how elder care organizations monitor performance. Instead of relying on delayed reports, teams gain real-time, visual, and actionable insights.
Moreover, the dashboard improves transparency, accountability, and service quality. As a result, organizations deliver better care while maintaining operational efficiency and compliance.
Frequently Asked Questions (FAQs)
What is the main purpose of an Elder Care Services KPI Dashboard in Power BI?
The dashboard helps monitor care quality, operational efficiency, financial performance, and compliance in one place.
Do I need advanced Power BI skills to use this dashboard?
No. Users only update Excel data, and Power BI handles the visuals automatically.
Can I customize KPIs in this dashboard?
Yes. You can add, remove, or modify KPIs easily through the Excel definition sheet.
How often should I update the data?
Most organizations update data monthly. However, you can choose weekly or quarterly updates.
Is this dashboard suitable for small elder care facilities?
Yes. The Excel-based data source makes it ideal for both small and large organizations.
Watch the step-by-step video tutorial:
Visit our YouTube channel to learn step-by-step video tutorials
Click to buy Elder Care Services KPI Dashboard in Power BI