Electric vehicle charging infrastructure is expanding rapidly across cities, highways, commercial buildings, and residential complexes. However, as charging networks grow, managing performance using scattered spreadsheets becomes inefficient. As a result, operators lose visibility into utilization, revenue, downtime, and operational efficiency.
That is exactly why an Electric Vehicle Charging KPI Dashboard in Excel becomes an essential management tool.
In this detailed blog post, you will learn what an Electric Vehicle Charging KPI Dashboard in Excel is, why it is important, how it works, and how EV charging operators can use it to improve efficiency, reliability, and profitability. Moreover, this article explains dashboard structure, advantages, best practices, real-world use cases, and frequently asked questions.
Click to Purchases Electric Vehicle Charging KPI Dashboard in Excel
What Is an Electric Vehicle Charging KPI Dashboard in Excel?
An Electric Vehicle Charging KPI Dashboard in Excel is a ready-to-use performance management solution designed to track, analyze, and visualize key metrics related to EV charging operations.
Instead of reviewing raw operational data across multiple Excel files, this dashboard consolidates information into a single, interactive view. As a result, charging station operators, infrastructure managers, and business owners gain instant clarity on performance.
Additionally, because the dashboard runs entirely in Excel, it remains cost-effective, flexible, and easy to customize for different charging networks.
Why Do EV Charging Businesses Need a KPI Dashboard?
EV charging operations involve several critical KPIs such as station utilization, charging sessions, energy delivered, downtime, revenue, and customer satisfaction. However, without a centralized dashboard, tracking these metrics becomes time-consuming.
A KPI dashboard solves this challenge by:
-
Centralizing all EV charging KPIs in one file
-
Highlighting target achievement and shortfalls clearly
-
Comparing current performance with previous year data
-
Supporting faster operational and strategic decisions
-
Reducing manual reporting and analysis time
As a result, EV charging businesses move from reactive monitoring to proactive management.
How Does the Electric Vehicle Charging KPI Dashboard in Excel Work?
The dashboard follows a simple and structured workflow.
First, users enter actual, target, and previous year values into dedicated input sheets. Then, Excel formulas, conditional formatting, and charts calculate KPIs automatically. Finally, the dashboard updates dynamically based on the selected month or KPI.
Because of this design, even users with basic Excel knowledge can manage and maintain the dashboard easily.
Click to Purchases Electric Vehicle Charging KPI Dashboard in Excel
What Worksheets Are Included in the Electric Vehicle Charging KPI Dashboard?
This KPI dashboard consists of seven well-structured worksheets, each designed for a specific purpose.
What Is the Purpose of the Home Sheet?

The Home Sheet acts as the navigation hub of the dashboard.
It contains six navigation buttons that allow users to jump instantly to the required worksheet. As a result, users avoid scrolling through tabs and access insights quickly.
This design improves usability, especially for management presentations.
What Information Does the Dashboard Sheet Display?
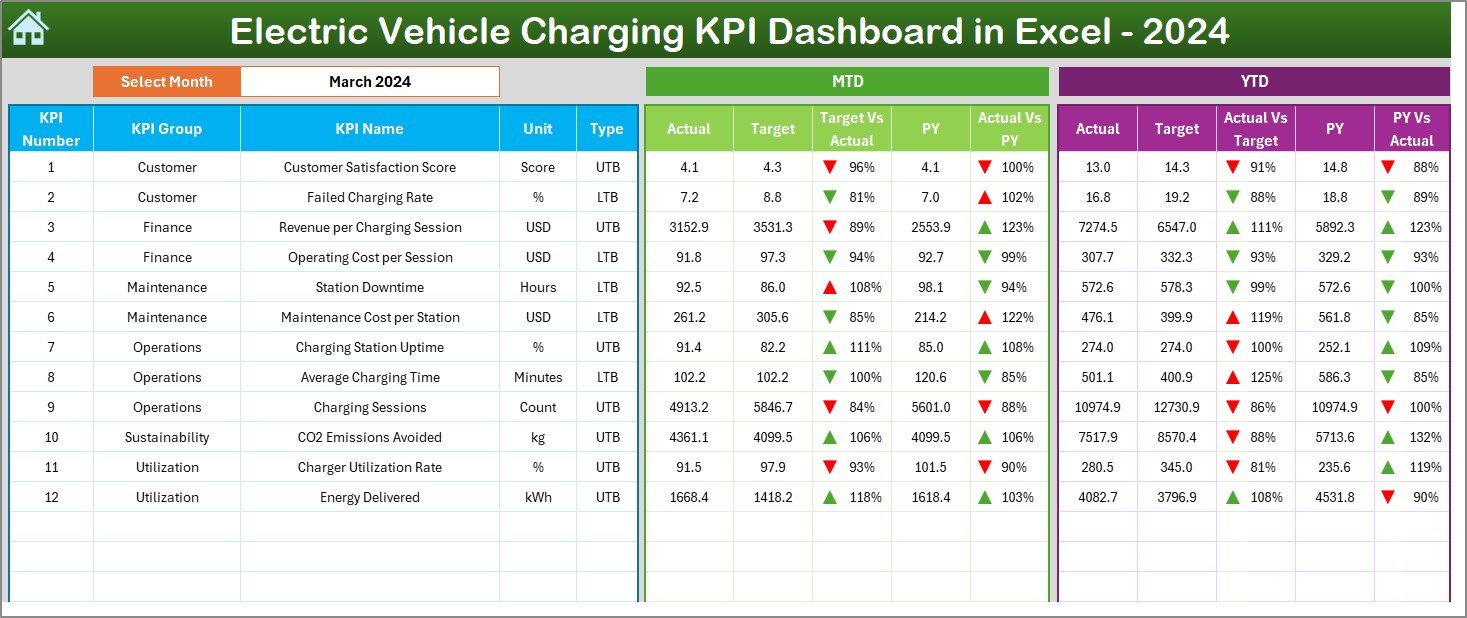
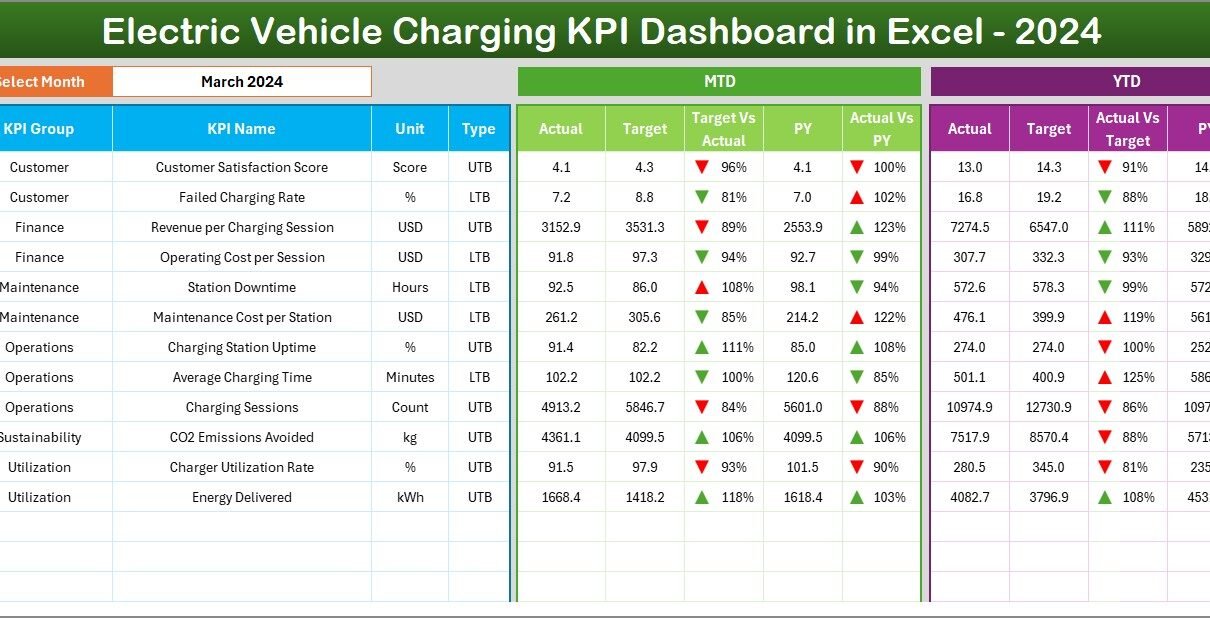
The Dashboard Sheet is the main analytical page of the KPI dashboard.
How Does Month Selection Work?
On cell D3, users select the reporting month from a drop-down list. Once selected, the entire dashboard updates automatically for that month.
This feature allows quick month-wise performance comparison across all KPIs.
What KPIs Are Displayed on the Dashboard?
The dashboard displays both MTD (Month-to-Date) and YTD (Year-to-Date) metrics.
MTD Performance Section
-
MTD Actual
-
MTD Target
-
MTD Previous Year
-
Target vs Actual (%)
-
Previous Year vs Actual (%)
-
Conditional formatting arrows (▲ ▼)
YTD Performance Section
-
YTD Actual
-
YTD Target
-
YTD Previous Year
-
Target vs Actual (%)
-
Previous Year vs Actual (%)
-
Conditional formatting arrows (▲ ▼)
Because of these indicators, users instantly identify underperforming and high-performing KPIs.
How Does Conditional Formatting Improve Decision-Making?
Conditional formatting uses visual cues to highlight KPI performance.
-
Green upward arrows (▲) indicate favorable performance
-
Red downward arrows (▼) highlight performance gaps
As a result, users do not need to analyze numbers manually. The dashboard draws attention to issues immediately.
Click to Purchases Electric Vehicle Charging KPI Dashboard in Excel
What Is the KPI Trend Sheet Used For?

The KPI Trend Sheet enables detailed KPI-level analysis.
How Do Users Select a KPI?
Users select a KPI name from a drop-down list in cell C3. Once selected, all related information and charts update automatically.
What Details Are Shown on the KPI Trend Sheet?
This sheet displays:
-
KPI Group
-
KPI Unit
-
KPI Type (Upper the Better or Lower the Better)
-
KPI Formula
-
KPI Definition
Additionally, it shows two dynamic trend charts:
-
MTD Trend Chart (Actual, Target, Previous Year)
-
YTD Trend Chart (Actual, Target, Previous Year)
These visuals help users analyze long-term and short-term trends effectively.
Click to Purchases Electric Vehicle Charging KPI Dashboard in Excel
Why Is the Actual Numbers Input Sheet Important?
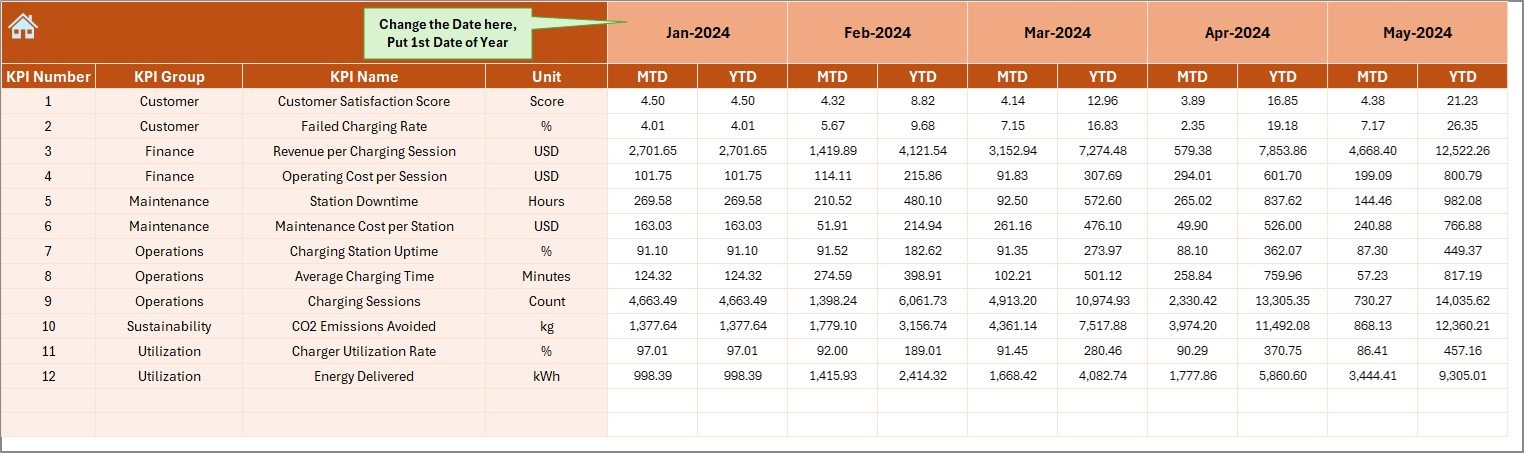
The Actual Numbers Input Sheet stores real operational performance data.
How Is Data Entered?
Users enter:
-
MTD Actual values
-
YTD Actual values
Users can change the reporting year by updating cell E1, where they input the first month of the year.
This structure supports both calendar year and financial year reporting.
What Is the Role of the Target Sheet?
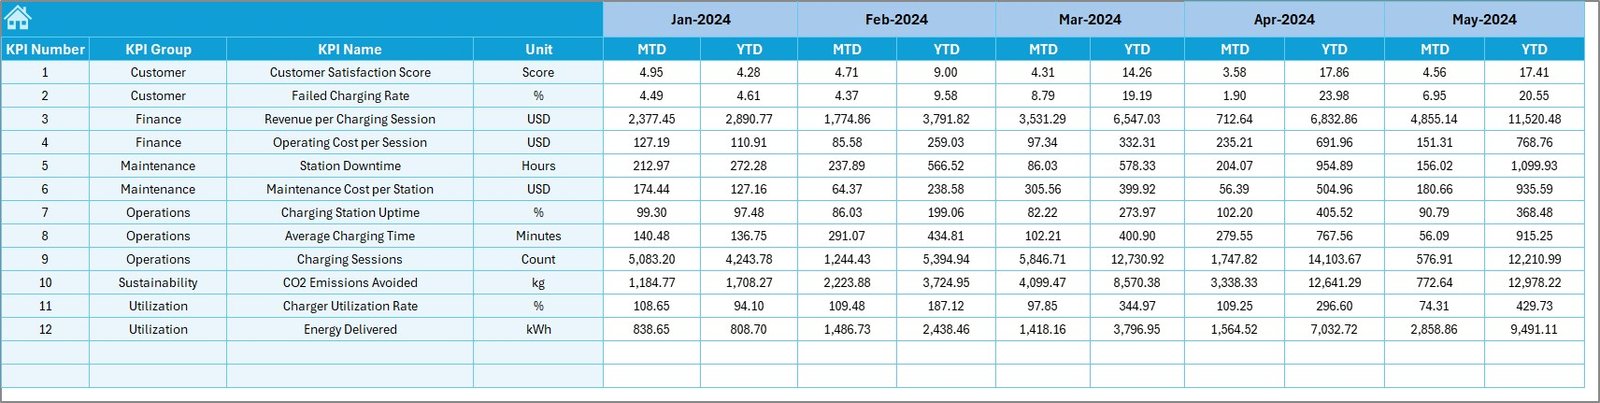
The Target Sheet captures target benchmarks for each KPI.
Users enter:
-
MTD Target values
-
YTD Target values
Because targets drive performance evaluation, maintaining accurate target data ensures reliable insights.
Why Do You Need the Previous Year Number Sheet?

The Previous Year Number Sheet stores historical KPI values.
Users enter previous year MTD and YTD numbers in the same structure as current year data. As a result, the dashboard automatically calculates year-over-year comparisons.
This feature helps answer questions such as:
-
Are charging stations becoming more utilized?
-
Is downtime reducing year over year?
Why Is the KPI Definition Sheet Critical?
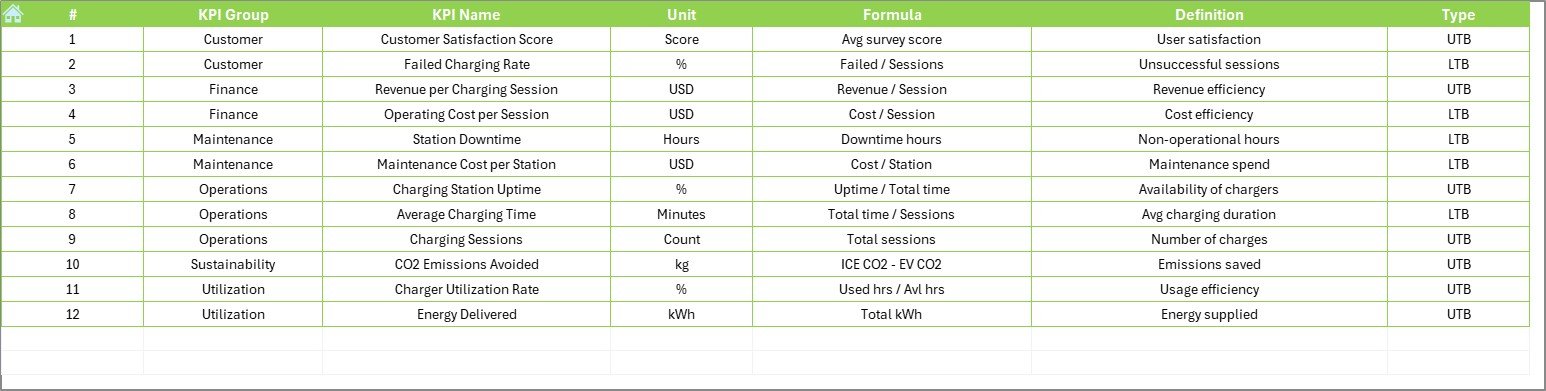
The KPI Definition Sheet forms the backbone of the dashboard.
It includes:
-
KPI Name
-
KPI Group
-
Unit
-
Formula
-
KPI Definition
This sheet ensures consistent KPI interpretation across teams and prevents confusion when multiple stakeholders use the dashboard.
Advantages of Electric Vehicle Charging KPI Dashboard in Excel
Why Should EV Charging Operators Use This Dashboard?
This dashboard delivers several practical advantages.
-
Centralized KPI tracking in one Excel file
-
Easy month-wise and KPI-wise analysis
-
Clear target vs actual comparisons
-
Visual performance indicators
-
Reduced manual reporting effort
-
Improved operational visibility
-
Cost-effective and customizable solution
Because of these benefits, EV charging operators gain clarity and control.
How Does This Dashboard Improve Operational Efficiency?
The dashboard highlights inefficiencies instantly. For example, if station downtime increases or utilization drops, red indicators appear immediately.
As a result, operators can take corrective action before customer experience suffers.
Who Can Benefit from an Electric Vehicle Charging KPI Dashboard?
This dashboard supports a wide range of stakeholders, including:
-
EV charging station operators
-
Infrastructure managers
-
Energy and utility companies
-
Facility management teams
-
Finance and strategy teams
-
Business owners and executives
Each role gains relevant insights without complex tools.
Click to Purchases Electric Vehicle Charging KPI Dashboard in Excel
Best Practices for the Electric Vehicle Charging KPI Dashboard in Excel
How Can You Maximize the Value of This Dashboard?
Follow these proven best practices.
-
Define KPIs clearly before implementation
-
Use consistent units and formulas
-
Update actual data regularly
-
Review MTD and YTD metrics together
-
Set realistic and achievable targets
-
Train teams to interpret arrows and percentages correctly
-
Maintain KPI definitions centrally
When organizations follow these practices, the dashboard delivers long-term value.
How Does This Dashboard Support EV Infrastructure Growth?
By tracking trends and comparing year-over-year performance, the dashboard supports:
-
Better capacity planning
-
Smarter expansion decisions
-
Improved charger uptime
-
Enhanced customer satisfaction
-
Data-driven investment planning
As a result, EV charging networks scale with confidence.
Common Use Cases of Electric Vehicle Charging KPI Dashboard
Where Can This Dashboard Be Applied?
This dashboard works well across multiple EV charging scenarios, such as:
-
Public EV charging networks
-
Highway fast-charging stations
-
Workplace EV charging facilities
-
Residential charging infrastructure
-
Fleet charging operations
-
Smart city EV projects
Each use case benefits from structured KPI visibility.
Conclusion: Why Should You Use an Electric Vehicle Charging KPI Dashboard in Excel?
An Electric Vehicle Charging KPI Dashboard in Excel transforms raw charging data into actionable insights. It simplifies reporting, improves accountability, and strengthens operational control.
Because it runs in Excel, it remains affordable, flexible, and easy to deploy. Moreover, the dashboard empowers operators to monitor performance, reduce downtime, and plan future growth effectively.
In a fast-growing EV ecosystem, relying on manual tracking no longer works. Therefore, adopting a KPI dashboard becomes a strategic necessity.
Frequently Asked Questions (FAQs)
What KPIs can be tracked in an EV Charging KPI Dashboard?
You can track KPIs such as station utilization rate, charging sessions, energy delivered, downtime, revenue per charger, and customer usage trends.
Can beginners use this Excel dashboard?
Yes. The dashboard uses simple input sheets, drop-downs, and automated calculations, making it beginner-friendly.
Does the dashboard support MTD and YTD analysis?
Yes. It supports both Month-to-Date and Year-to-Date performance tracking.
Can I customize KPIs and targets?
Absolutely. You can edit KPI definitions, targets, and formulas directly in Excel.
Is this dashboard suitable for small and large EV charging networks?
Yes. The dashboard works effectively for small installations as well as large, multi-location charging networks.
Click to Purchases Electric Vehicle Charging KPI Dashboard in Excel
Visit our YouTube channel to learn step-by-step video tutorials