Managing electricity contracts without a structured performance system often creates confusion, delays, and missed targets. Many organizations still depend on scattered Excel sheets, emails, and manual reports. As a result, decision-makers struggle to track KPIs, compare performance, and take timely action. That is exactly why an Electricity Contract KPI Dashboard in Excel becomes a powerful and practical solution.
In this detailed article, you will learn everything about the Electricity Contract KPI Dashboard in Excel. Moreover, you will understand its structure, features, advantages, best practices, and real-world use cases. In addition, this guide explains how such a dashboard helps organizations monitor electricity contract KPIs efficiently and make confident, data-driven decisions.
Click to buy Electricity Contract KPI Dashboard in Excel
What Is an Electricity Contract KPI Dashboard in Excel?
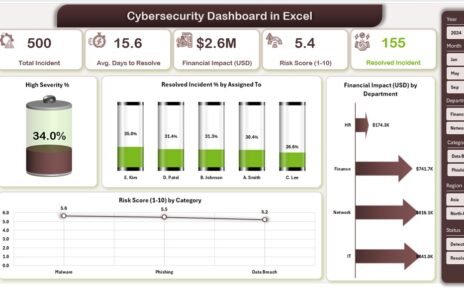
An Electricity Contract KPI Dashboard in Excel is a structured and interactive reporting tool that helps organizations track, analyze, and monitor key performance indicators related to electricity contracts.
Instead of reviewing multiple spreadsheets manually, this dashboard consolidates all KPIs into one centralized Excel file. As a result, users gain instant visibility into performance, trends, targets, and gaps. Furthermore, Excel allows flexibility, ease of use, and wide adoption across organizations.
Because Excel supports formulas, pivot tables, charts, and conditional formatting, this dashboard delivers powerful insights without complex software.
Why Do Organizations Need an Electricity Contract KPI Dashboard?
Electricity contracts involve costs, consumption targets, compliance requirements, and vendor performance. Therefore, organizations must track performance continuously. However, manual tracking creates errors and delays.
An Electricity Contract KPI Dashboard solves these challenges because it:
- Centralizes all electricity contract KPIs
- Improves accuracy and transparency
- Reduces manual reporting effort
- Supports faster and better decisions
- Enables month-to-date and year-to-date analysis
Consequently, organizations gain control over electricity costs and contract performance.
How Does an Electricity Contract KPI Dashboard in Excel Work?
This dashboard works through structured worksheets, linked formulas, and dynamic visuals. Once users enter actual, target, and previous-year data, the dashboard automatically updates all KPIs and charts.
Moreover, slicers and drop-downs allow users to analyze performance by month or KPI. Therefore, teams can review performance instantly without recalculating numbers.
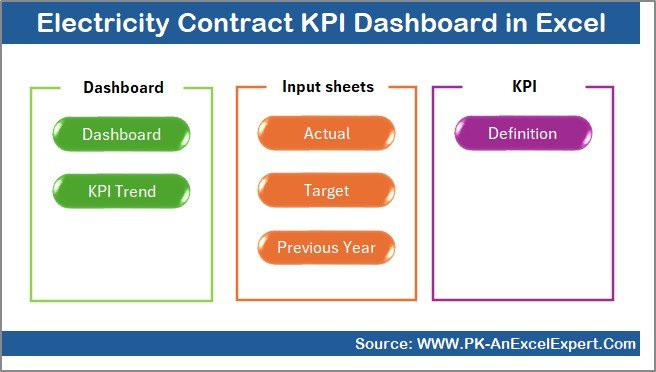
What Is the Structure of the Electricity Contract KPI Dashboard in Excel?
This Electricity Contract KPI Dashboard in Excel includes 7 well-structured worksheets, each designed for a specific purpose.
Summary Page – How Does the Navigation Work?
The Summary Page works as an index sheet. It helps users navigate the entire dashboard easily.
Key Highlights of the Summary Page:
- Acts as a central landing page
- Includes 6 navigation buttons
- Allows one-click access to all major sheets
- Improves user experience and usability
Because of this structure, even non-technical users can use the dashboard comfortably.
Click to buy Electricity Contract KPI Dashboard in Excel
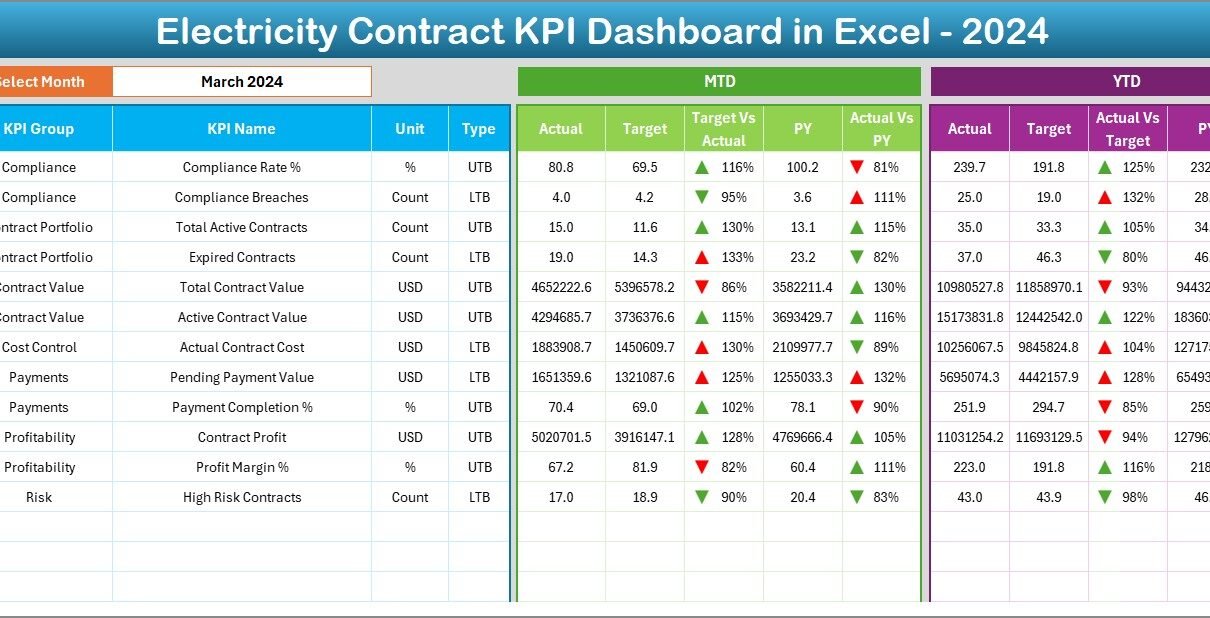
Dashboard Sheet – How Do You Track KPIs Monthly and Yearly?
The Dashboard Sheet is the core of the Electricity Contract KPI Dashboard in Excel. It displays all KPI performance metrics in one view.
Key Features of the Dashboard Sheet:
- Month selection drop-down at cell D3
- Dynamic update of all KPIs based on selected month
- Displays MTD (Month-to-Date) values:
Actual
Target
Previous Year
Shows Target vs Actual and Previous Year vs Actual
Uses conditional formatting arrows for quick performance status
- Displays YTD (Year-to-Date) performance with the same comparison logic
As a result, users can instantly identify underperforming or overperforming KPIs.

Click to buy Electricity Contract KPI Dashboard in Excel
Trend Sheet – How Can You Analyze KPI Trends?
The Trend Sheet helps users understand how KPIs behave over time.
What Does the Trend Sheet Include?
- KPI selection drop-down at cell C3
Displays:
KPI Group
Unit of KPI
KPI Type (Lower the Better / Upper the Better)
KPI Formula
KPI Definition
Shows MTD and YTD trend charts:
Actual
Target
Previous Year
Because of trend analysis, organizations can identify patterns, risks, and improvement opportunities early.

Click to buy Electricity Contract KPI Dashboard in Excel
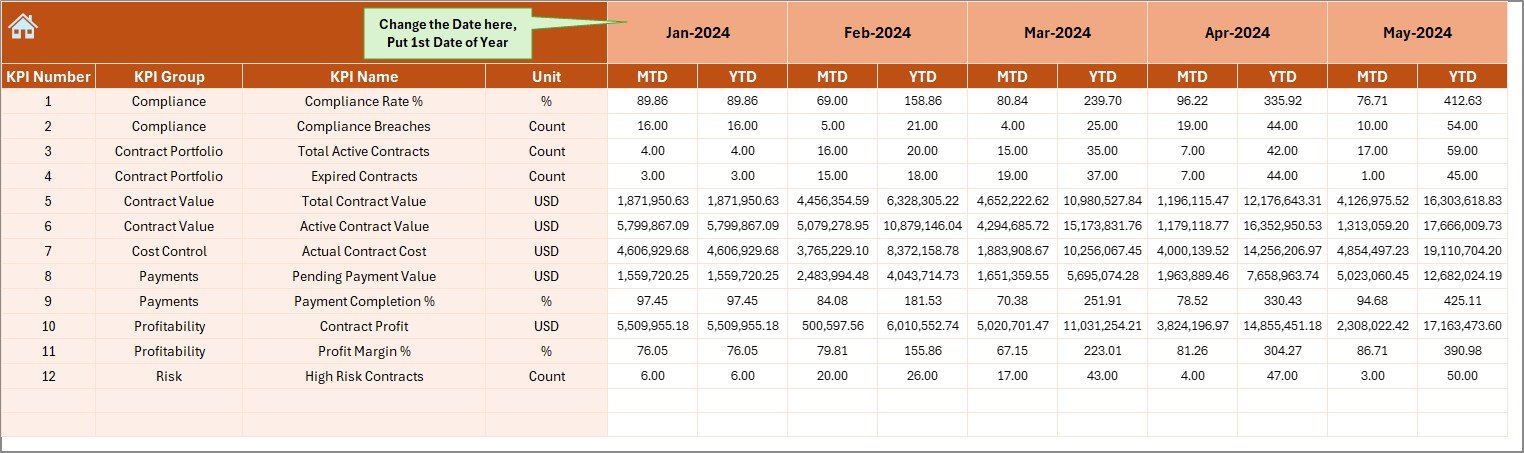
Actual Numbers Input Sheet – Where Do You Enter Actual Data?
The Actual Numbers Input Sheet allows users to enter real performance data.
How Does This Sheet Work?
- Users input MTD and YTD actual numbers
- Month selection available at cell E1
- Users set the first month of the year in E1
- All linked calculations update automatically
This structure reduces errors and ensures consistency across the dashboard.
Click to buy Electricity Contract KPI Dashboard in Excel
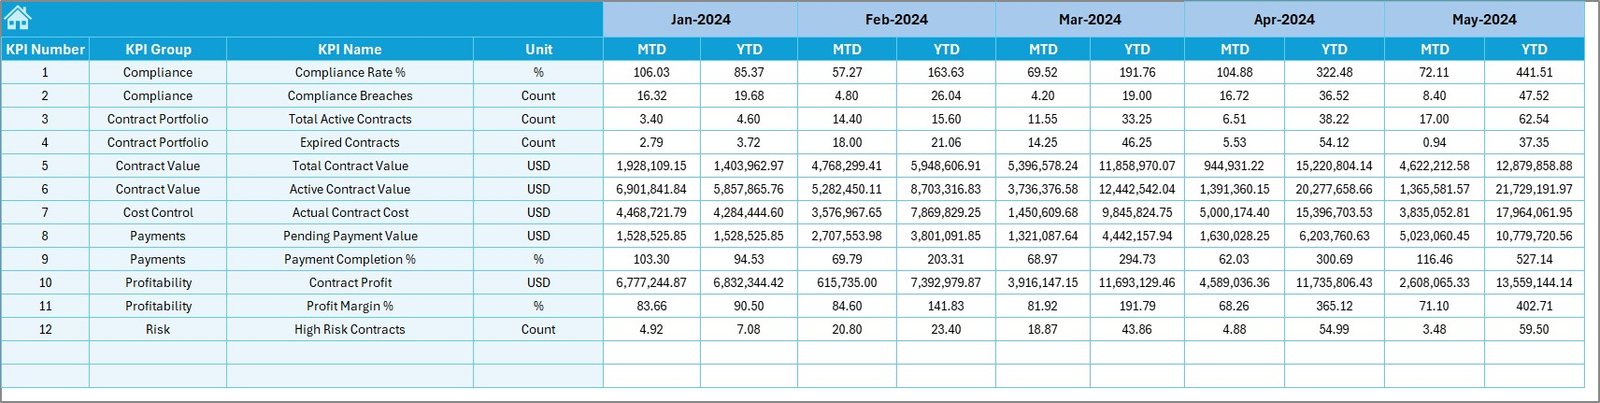
Target Sheet – How Are Targets Managed?
The Target Sheet captures planned performance goals for each KPI.
Key Points of the Target Sheet:
- Enter MTD and YTD target values
- Targets defined for each KPI
- Used for Target vs Actual analysis
Because targets remain structured, performance comparisons stay accurate and meaningful.
Click to buy Electricity Contract KPI Dashboard in Excel
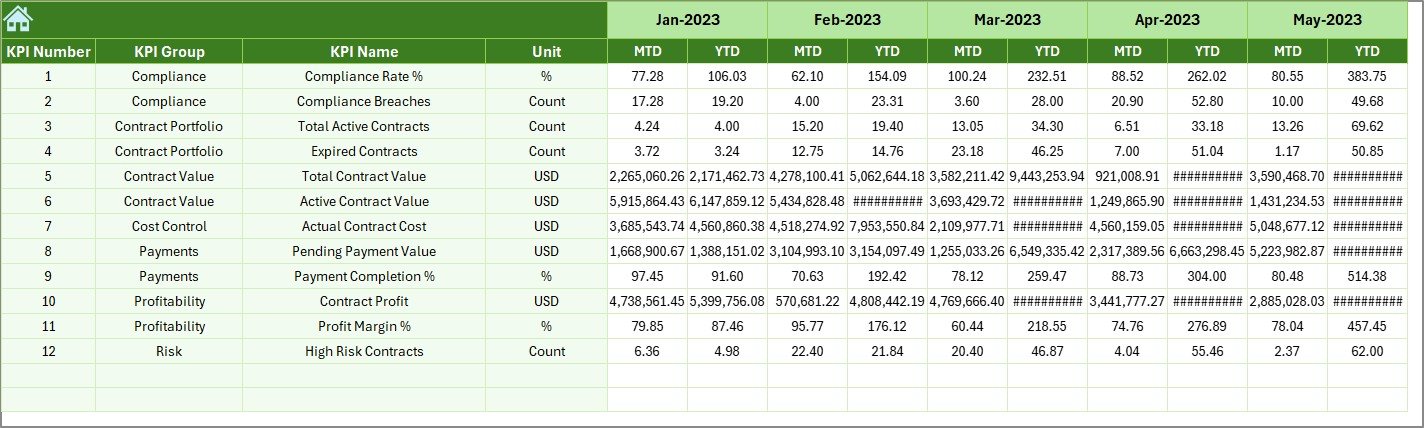
Previous Year Number Sheet – Why Is Historical Comparison Important?
The Previous Year Number Sheet stores historical KPI data.
Benefits of This Sheet:
- Enables year-over-year comparison
- Helps identify growth or decline
- Supports trend evaluation and forecasting
As a result, organizations can measure improvement effectively.
Click to buy Electricity Contract KPI Dashboard in Excel
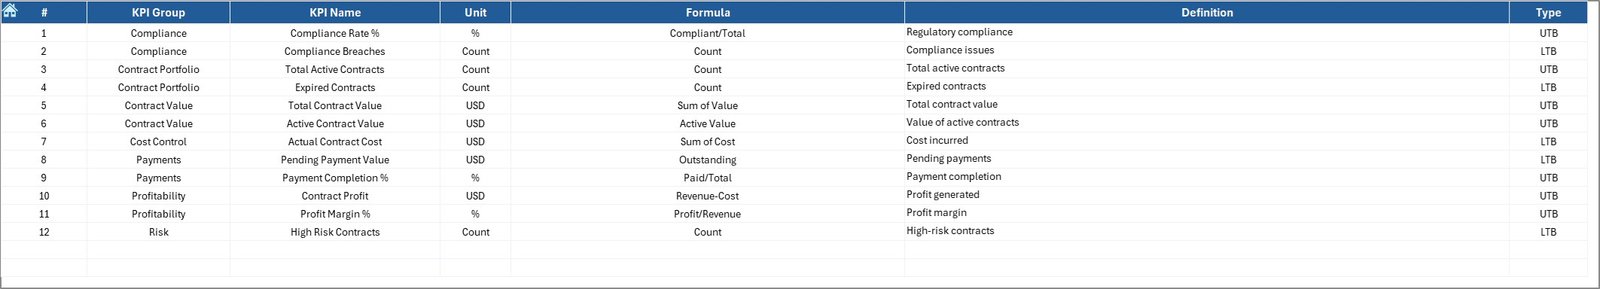
KPI Definition Sheet – Why Is KPI Clarity Critical?
The KPI Definition Sheet ensures everyone understands the KPIs correctly.
Information Captured in This Sheet:
- KPI Name
- KPI Group
- Unit of Measurement
- KPI Formula
- KPI Definition
Because of clear definitions, confusion reduces and reporting stays consistent across teams.
Click to buy Electricity Contract KPI Dashboard in Excel
Advantages of Electricity Contract KPI Dashboard in Excel
Using an Electricity Contract KPI Dashboard in Excel delivers several practical advantages.
Key Advantages:
- Centralized KPI monitoring
- Saves reporting time
- Clear target tracking
- Early identification of issues
- Transparent performance visibility
- Trend-based decision-making
- No advanced technical skills required
Therefore, this dashboard fits organizations of all sizes.
Who Can Use an Electricity Contract KPI Dashboard in Excel?
This dashboard suits multiple stakeholders.
Ideal Users Include:
- Energy and utility managers
- Procurement teams
- Finance and cost-control teams
- Contract management professionals
- Operations managers
- Senior leadership and decision-makers
Because Excel remains widely used, adoption remains easy.
How Does This Dashboard Improve Decision-Making?
The dashboard improves decision-making by:
- Providing real-time performance insights
- Highlighting gaps through visual indicators
- Supporting data-driven discussions
- Reducing reliance on manual calculations
As a result, teams focus on actions instead of data preparation.
Best Practices for the Electricity Contract KPI Dashboard in Excel
To get maximum value, organizations should follow best practices.
- Define KPIs Clearly
Always document KPIs properly in the KPI Definition Sheet. Clear definitions prevent confusion.
- Update Data Regularly
Ensure timely updates of actual, target, and previous-year data. Consistency improves accuracy.
- Validate Input Data
Use data validation rules to avoid incorrect entries.
- Review Trends Monthly
Do not rely only on current numbers. Always analyze trends to predict future performance.
- Use Conditional Formatting Wisely
Visual indicators help faster interpretation. However, keep them simple and consistent.
- Limit Manual Changes
Avoid changing formulas or structure. Controlled updates protect dashboard integrity.
How Is This Dashboard Better Than Traditional Reports?
Traditional reports require manual effort and lack interactivity. However, this dashboard:
- Updates automatically
- Supports dynamic filtering
- Provides visual insights
- Reduces reporting cycles
Therefore, it offers better efficiency and clarity.
Can This Dashboard Be Customized?
Yes, Excel allows easy customization.
You can:
- Add or remove KPIs
- Modify charts
- Change formats
- Extend analysis
Because of Excel’s flexibility, customization remains simple.
Conclusion
An Electricity Contract KPI Dashboard in Excel is an essential tool for organizations that manage electricity contracts and want better control over performance. It centralizes data, improves transparency, and supports informed decision-making.
With structured worksheets, dynamic dashboards, trend analysis, and clear KPI definitions, this dashboard transforms raw electricity contract data into actionable insights. Moreover, Excel’s familiarity ensures easy adoption without additional software costs.
If your organization aims to reduce risks, improve efficiency, and enhance performance visibility, this dashboard becomes a practical and powerful solution.
Frequently Asked Questions (FAQs)
- What is the main purpose of an Electricity Contract KPI Dashboard in Excel?
The main purpose is to track, analyze, and monitor electricity contract KPIs in a centralized and automated Excel system.
- Can non-technical users use this dashboard?
Yes, the dashboard uses simple Excel features, so non-technical users can use it easily.
- How often should KPI data be updated?
You should update KPI data monthly to maintain accuracy and relevance.
- Does the dashboard support year-over-year comparison?
Yes, the Previous Year Number Sheet enables year-over-year analysis.
- Can I add new KPIs to the dashboard?
Yes, you can add new KPIs by updating the KPI Definition, Target, and Actual sheets.
- Is this dashboard suitable for large organizations?
Yes, it works well for both small and large organizations due to its scalable structure.
- Why should I use Excel instead of other tools?
Excel offers flexibility, low cost, ease of use, and wide availability across organizations.
Visit our YouTube channel to learn step-by-step video tutorials
Watch the step-by-step video tutorial: