Managing electricity procurement without clear performance tracking creates cost overruns, supplier risks, and missed savings opportunities. Because electricity procurement involves high-value contracts, volatile prices, regulatory pressure, and strict timelines, organizations must track performance continuously and accurately.
Therefore, an Electricity Procurement KPI Dashboard in Power BI becomes a powerful analytical solution for procurement teams, finance managers, and energy professionals.
In this in-depth guide, you will learn what an Electricity Procurement KPI Dashboard in Power BI is, why it matters, how it works, its detailed page structure, Excel data design, key KPIs, advantages, best practices, and frequently asked questions. By the end, you will clearly understand how this dashboard improves transparency, control, and decision-making in electricity procurement.
Click to buy Electricity Procurement KPI Dashboard in Power BI
What Is an Electricity Procurement KPI Dashboard in Power BI?
An Electricity Procurement KPI Dashboard in Power BI is a centralized, interactive reporting solution designed to track, analyze, and monitor key performance indicators related to electricity purchasing activities.
Instead of managing multiple Excel files and manual reports, this dashboard consolidates all procurement KPIs into a single Power BI report. As a result, procurement teams gain real-time visibility into performance, cost efficiency, and target achievement.
Moreover, because the dashboard uses Excel as a data source and Power BI for analytics, it remains easy to maintain, scalable, and user-friendly for both technical and non-technical users.
Why Do Organizations Need an Electricity Procurement KPI Dashboard?
Electricity procurement directly impacts operational costs and profitability. However, many organizations still rely on fragmented spreadsheets and delayed reports. Consequently, they struggle to identify performance gaps on time.
An Electricity Procurement KPI Dashboard solves these challenges because it:
- Provides a single source of truth
- Highlights target vs actual performance
- Enables MTD and YTD tracking
- Supports year-over-year comparisons
- Improves supplier accountability
Therefore, organizations gain better control over procurement performance while reducing financial and operational risks.
How Does an Electricity Procurement KPI Dashboard in Power BI Work?
This dashboard follows a structured and logical design. First, users capture procurement data in Excel. Then, Power BI processes, models, and visualizes the data automatically.
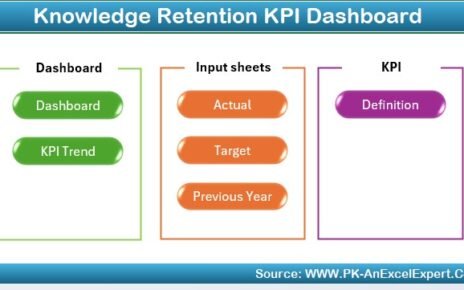
The dashboard includes three well-defined pages, each serving a specific analytical purpose:
- Summary Page
- KPI Trend Page
- KPI Definition Page
Because of this structure, users can analyze high-level performance while also drilling down into KPI details when required.
What Are the Key Pages in the Electricity Procurement KPI Dashboard?
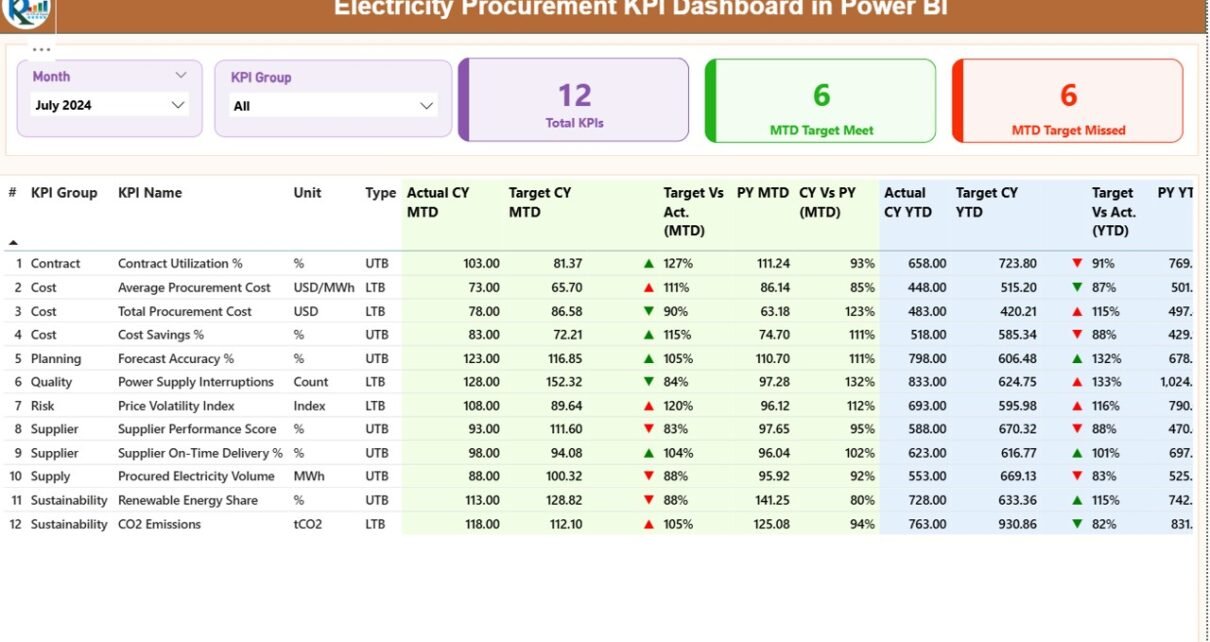
Summary Page
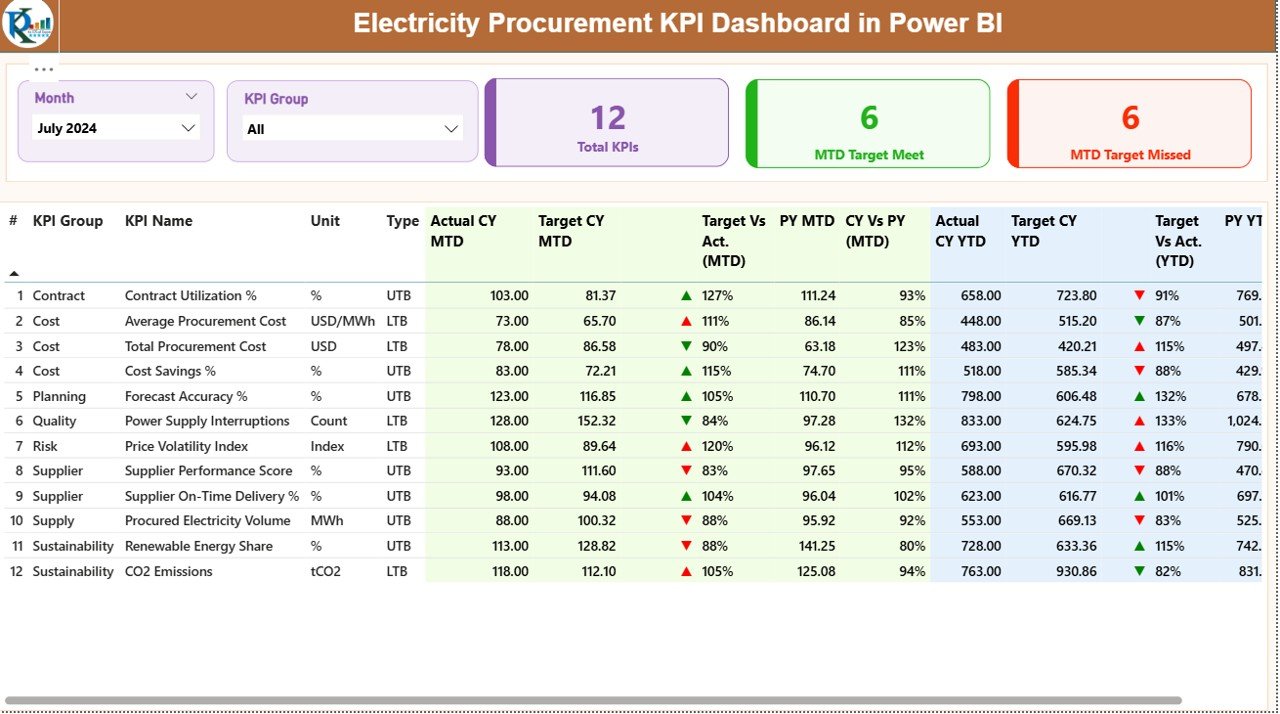
The Summary Page acts as the main landing page of the dashboard. It provides a complete snapshot of procurement performance at a glance.
At the top of the page, users see:
- Month slicer
- KPI Group slicer
These slicers allow quick filtering and focused analysis. As a result, users can instantly switch between months or KPI categories.
Key Cards on the Summary Page
The dashboard displays three KPI cards:
- Total KPIs Count
- MTD Target Met Count
- MTD Target Missed Count
Because these cards update dynamically, users immediately understand overall performance health.
What Information Appears in the Summary Table?
Below the KPI cards, a detailed table displays all procurement KPIs with rich performance metrics.
The table includes:
- KPI Number – Sequential identifier for each KPI
- KPI Group – Category or functional group of the KPI
- KPI Name – Name of the procurement KPI
- Unit – Unit of measurement (%, INR, kWh, etc.)
- Type – LTB (Lower the Better) or UTB (Upper the Better)
Current Year Month-to-Date (MTD) Metrics
- Actual CY MTD – Actual MTD value for the current year
- Target CY MTD – Target MTD value for the current year
- MTD Icon – Green ▲ or Red ▼ icon indicating target status
- Target vs Actual (MTD) – Percentage calculation using:
Actual MTD ÷ Target MTD
Year-over-Year MTD Comparison
- PY MTD – Previous year MTD value
- CY vs PY (MTD) – Percentage comparison using:
Current Year MTD ÷ Previous Year MTD
Current Year Year-to-Date (YTD) Metrics
- Actual CY YTD – Actual YTD value
- Target CY YTD – Target YTD value
- YTD Icon – Performance indicator using green and red arrows
- Target vs Actual (YTD) – Percentage calculation:
Actual YTD ÷ Target YTD
Year-over-Year YTD Comparison
- PY YTD – Previous year YTD value
- CY vs PY (YTD) – Comparison using:
Current Year YTD ÷ Previous Year YTD
Because of this detailed structure, users can quickly identify procurement inefficiencies and trends.
Click to buy Electricity Procurement KPI Dashboard in Power BI
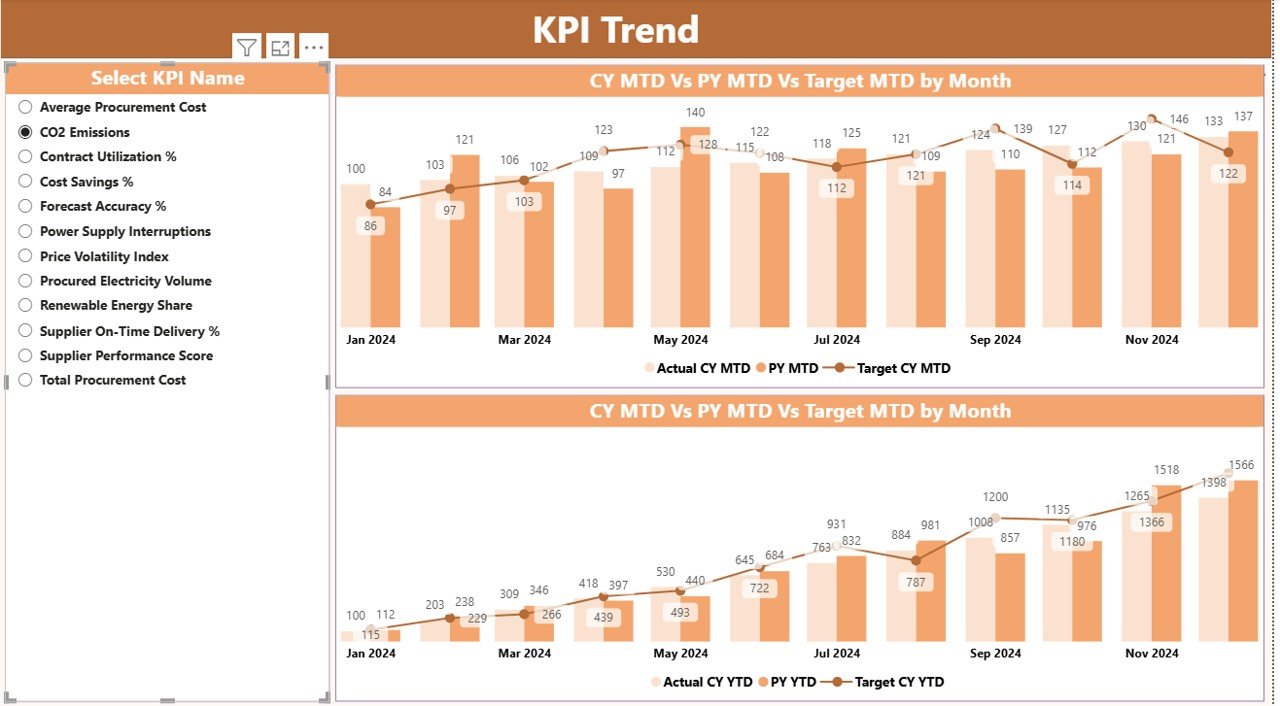
KPI Trend Page
The KPI Trend Page focuses on performance trends over time.
On this page, the dashboard displays two combo charts:
- MTD performance trend
- YTD performance trend
Each chart shows:
- Current Year Actual
- Previous Year Actual
- Target Values
A KPI Name slicer on the left allows users to select a specific KPI. As a result, users can analyze trends KPI by KPI without distractions.
This page supports strategic decisions because it reveals:
- Seasonal patterns
- Target consistency
- Long-term procurement efficiency
Click to buy Electricity Procurement KPI Dashboard in Power BI
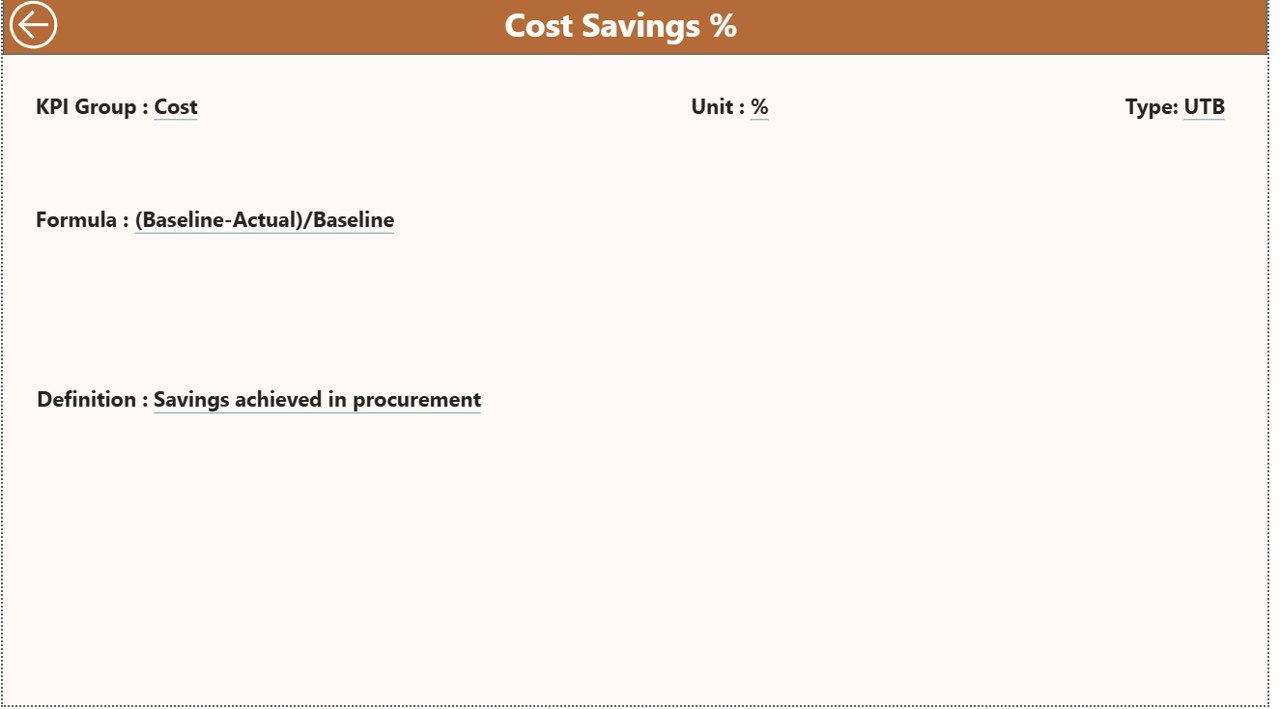
the KPI Definition Page
The KPI Definition Page serves as a drill-through reference page. Although it remains hidden by default, users can access it from the Summary Page.
This page displays:
- KPI Formula
- KPI Definition
- Measurement logic
Because of this feature, stakeholders always understand what each KPI means and how calculations work. Transparency improves trust and adoption across teams.
A Back button on the top-left corner allows easy navigation to the Summary Page.
Click to buy Electricity Procurement KPI Dashboard in Power BI
How Is Excel Data Structured for the Dashboard?
The Electricity Procurement KPI Dashboard uses Excel as its data source. This approach ensures simplicity and flexibility.
The Excel file contains three mandatory worksheets.
Input_Actual Sheet
In this sheet, users enter actual procurement performance values.
Required columns include:
- KPI Name
- Month (use the first date of the month)
- MTD Value
- YTD Value
Because Power BI automatically refreshes data, users only need to update this sheet regularly.
Input_Target Sheet
This sheet captures procurement targets.
Required columns include:
- KPI Name
- Month (first date of the month)
- Target MTD Value
- Target YTD Value
Separating targets from actuals improves clarity and avoids calculation errors.
KPI Definition Sheet
This sheet defines each KPI clearly.
Required fields include:
- KPI Number
- KPI Group
- KPI Name
- Unit
- Formula
- Definition
- Type (LTB or UTB)
Because this structure remains standardized, the dashboard stays scalable for future KPIs.
Advantages of Electricity Procurement KPI Dashboard in Power BI
Why Does This Dashboard Add Real Business Value?
An Electricity Procurement KPI Dashboard delivers measurable advantages across procurement functions.
Key Advantages
- Centralized KPI Monitoring
Track all procurement KPIs from one dashboard instead of multiple reports. - Clear Target Accountability
Instantly identify which KPIs meet or miss targets. - Time Savings
Eliminate manual reporting and repetitive calculations. - Trend Visibility
Analyze MTD, YTD, and year-over-year trends easily. - Improved Decision-Making
Make data-driven procurement decisions with confidence. - Scalable Design
Add new KPIs without redesigning the dashboard.
Best Practices for the Electricity Procurement KPI Dashboard in Power BI
How Can You Maximize Dashboard Effectiveness?
Following best practices ensures long-term success.
Recommended Best Practices
- Define KPIs clearly before implementation
- Use consistent units and KPI naming
- Update Excel data regularly
- Review LTB and UTB classifications carefully
- Monitor trends, not just single-month results
- Train stakeholders on KPI definitions
- Avoid unnecessary visuals to maintain clarity
Because of these practices, the dashboard remains accurate, reliable, and impactful.
Who Can Use an Electricity Procurement KPI Dashboard?
This dashboard benefits multiple roles, including:
- Procurement Managers
- Energy Buyers
- Finance Teams
- Utility Companies
- Manufacturing Firms
- EPC Contractors
- Government Electricity Boards
Therefore, any organization involved in electricity purchasing can gain value from this solution.
Conclusion: Why Is an Electricity Procurement KPI Dashboard Essential?
Electricity procurement demands precision, transparency, and accountability. Without structured performance tracking, organizations risk inefficiencies and financial losses.
An Electricity Procurement KPI Dashboard in Power BI transforms raw procurement data into actionable insights. Because it combines Excel simplicity with Power BI analytics, it remains easy to adopt and powerful in execution.
Ultimately, this dashboard empowers organizations to control costs, improve supplier performance, and make confident procurement decisions.
Frequently Asked Questions (FAQs)
What is an Electricity Procurement KPI Dashboard in Power BI?
It is a centralized Power BI report that tracks and analyzes electricity procurement KPIs using Excel data.
Can non-technical users maintain this dashboard?
Yes. Users only update Excel sheets. Power BI handles all calculations and visuals.
How often should data be updated?
You should update data monthly or as frequently as procurement cycles demand.
Can I add more KPIs later?
Yes. The dashboard supports easy KPI expansion through the KPI Definition sheet.
What is the difference between MTD and YTD analysis?
MTD tracks current month performance, while YTD shows cumulative performance from the start of the year.
Does the dashboard support year-over-year comparisons?
Yes. It compares current year performance against previous year MTD and YTD values.
Is this dashboard suitable for large organizations?
Yes. The scalable design supports both small teams and large enterprises.
Click to buy Electricity Procurement KPI Dashboard in Power BI
Visit our YouTube channel to learn step-by-step video tutorials
Watch the step-by-step video tutorial: