The electronics retail industry moves fast. Prices shift daily, customer preferences change quickly, and sales trends vary across stores, categories, and regions. Because of this constant change, business owners need a simple and reliable way to track their performance. An Electronics Retail Dashboard in Excel solves this challenge in the most practical way. It brings all essential data into one place and turns it into visual insights.
Click to Purchases Electronics Retail Dashboard in Excel
In this article, you will discover everything about this dashboard, how each sheet works, and why this Excel-based solution supports better store management. You will also explore its advantages, best practices, and clear answers to FAQs. Let’s begin.
What Is an Electronics Retail Dashboard in Excel?
An Electronics Retail Dashboard in Excel is a ready-to-use reporting template designed for electronics retailers who want quick insights without learning complex tools. It helps retail teams track:
-
Sales
-
Profit and cost
-
Category performance
-
Store comparison
-
Region-level results
-
Customer ratings
-
Return orders
Because the dashboard uses Excel formulas, structured tables, slicers, and charts, users can update the entire report in minutes. You only enter or paste the latest data in the Data Sheet, and the dashboard refreshes automatically.
Why Do Electronics Retailers Need This Dashboard?
Electronics retailers handle thousands of SKUs, multiple stores, and different channels. Many teams still use manual reports, which slows down decision-making. This dashboard solves that problem because:
-
It shows performance instantly.
-
It displays trends clearly.
-
It compares stores, categories, and regions.
-
It highlights problems early.
-
It helps owners understand what works and what doesn’t.
Because of these benefits, the dashboard becomes a central reporting tool for small shops, multi-branch retailers, e-commerce sellers, distributors, and chain stores.
Key Features of the Electronics Retail Dashboard in Excel
This dashboard comes with five powerful analysis pages and a clean layout supported by a page navigator placed on the left side. This page navigator helps users move between sheets quickly and saves time.
Below is a full explanation of each page.
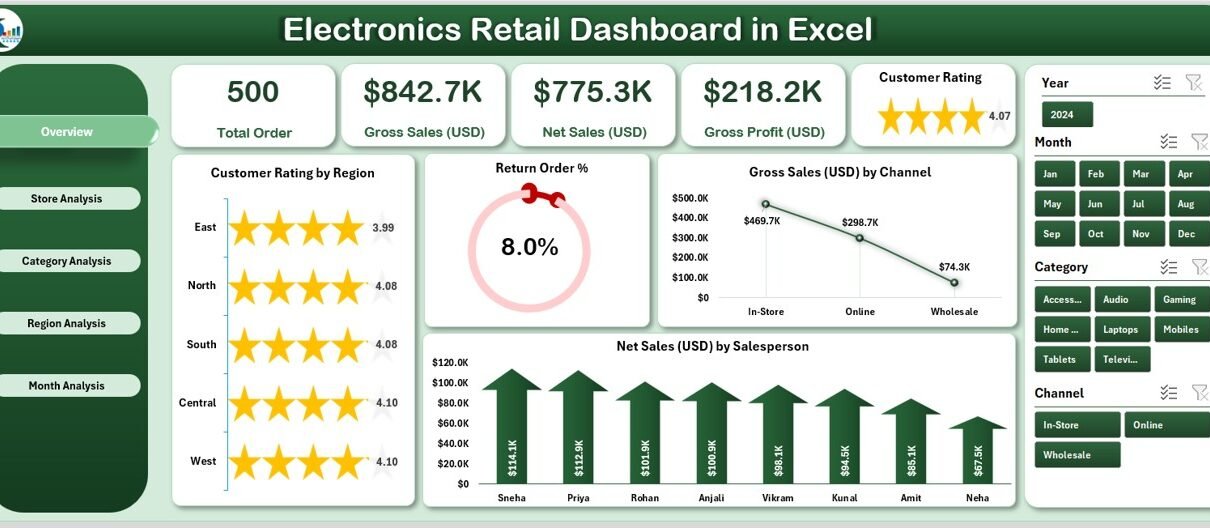
1. Overview Page – What Insights Do You See Here?
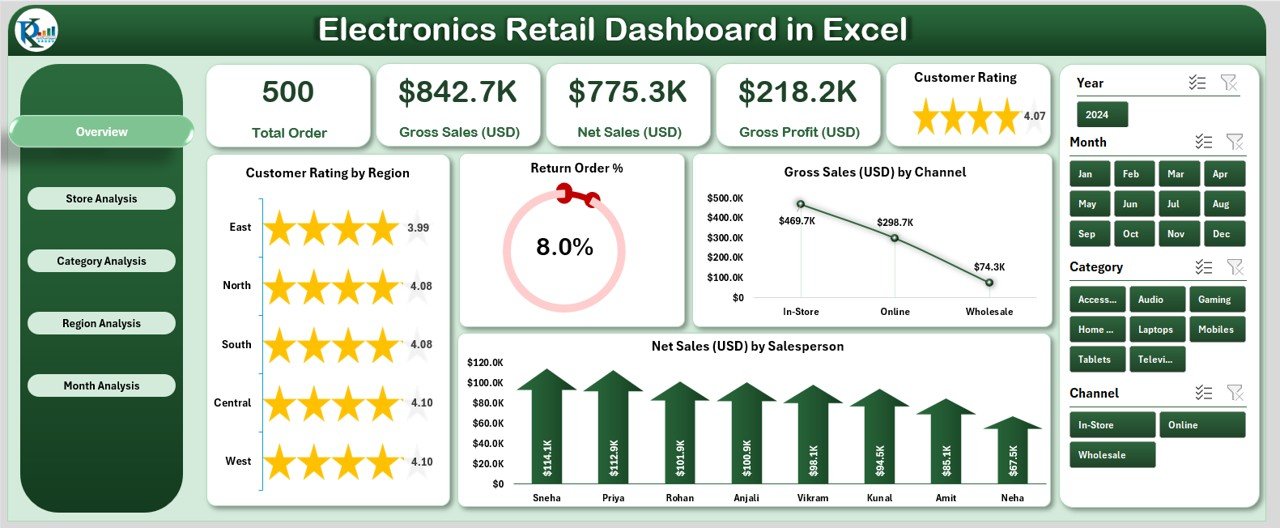
The Overview Page is the main screen of the dashboard. It shows the most important KPIs and high-level visuals that help teams understand overall performance.
It includes:
✔ Five KPI Cards
These cards highlight top business metrics like:
-
Gross Sales
-
Net Sales
-
Customer Ratings
-
Return Order %
-
Profit Insights
These cards help teams check performance within seconds.
✔ Key Charts on the Overview Page
The page also displays four powerful charts:
-
Customer Rating by Region – Helps you compare customer satisfaction across locations.
-
Return Order % – Shows the rate of product returns.
-
Gross Sales (USD) by Channel – Compares online, offline, wholesale, marketplace, and other channels.
-
Net Sales (USD) by Salespersons – Helps understand sales team contributions.
These insights help retailers plan better promotions, improve customer experience, and understand product performance.
2. Store Analysis – How Do Stores Perform Against Each Other?
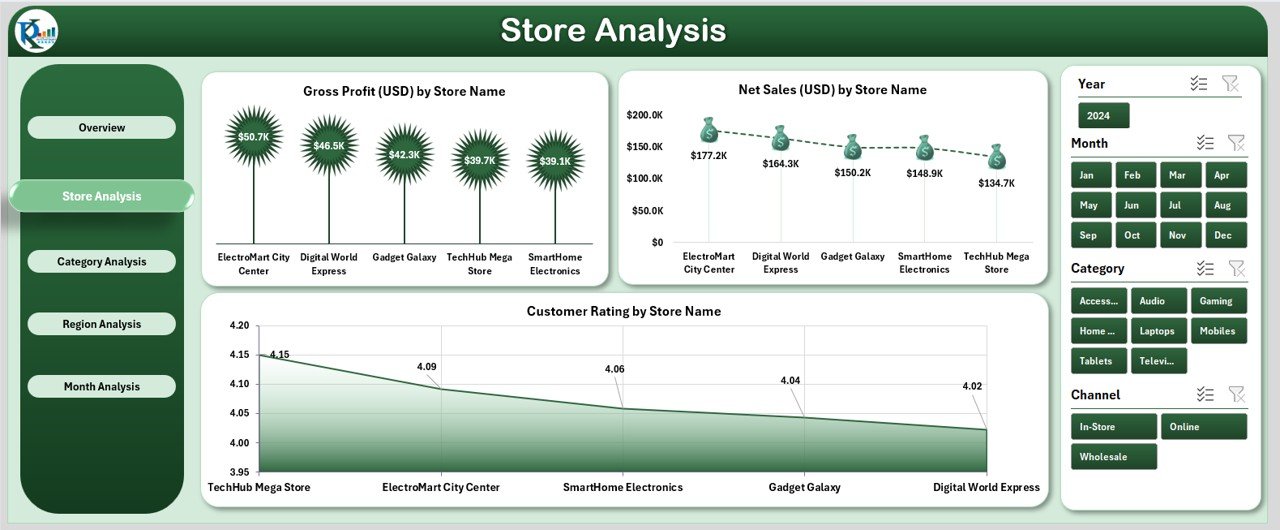
The Store Analysis Page helps you compare the performance of every store. You can see:
✔ Profit by Store Name
This chart highlights which stores earn the most and which require improvement.
✔ Return Order % by Store
A higher return rate may indicate:
-
Faulty products
-
Poor store handling
-
Incorrect sales practices
-
Customer dissatisfaction
This chart helps managers take immediate action.
✔ Customer Rating by Store Name
This useful chart helps you understand:
-
Store service quality
-
Customer satisfaction
-
Staff performance
✔ Revenue vs Total Cost by Store
This comparison provides a deeper understanding of store-level profitability. It helps retailers see which stores generate strong returns and which stores operate with high costs.
3. Category Analysis – Which Product Categories Perform Best?
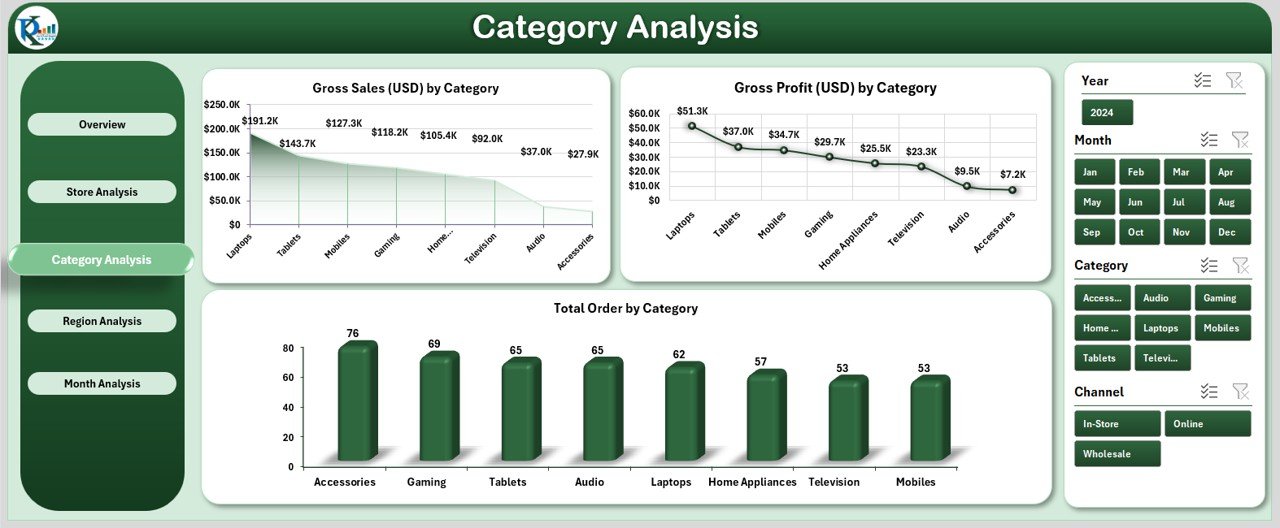
Electronics retailing includes mobile phones, computers, appliances, accessories, smart devices, and many more categories. The Category Analysis Page gives clear insights into which categories perform well.
The page includes three strong visuals:
-
Gross Profit (USD) by Category
-
Gross Profit (USD) by Category (duplicate for comparison with different slicer selection)
-
Total Orders by Category
These insights help users:
-
Identify high-demand categories
-
Understand profit drivers
-
Plan promotions
-
Focus on growth areas
Because the dashboard uses slicers, you can filter by month, region, or store to refine the category analysis.
Click to Purchases Electronics Retail Dashboard in Excel
4. Region Analysis – How Do Different Regions Perform?
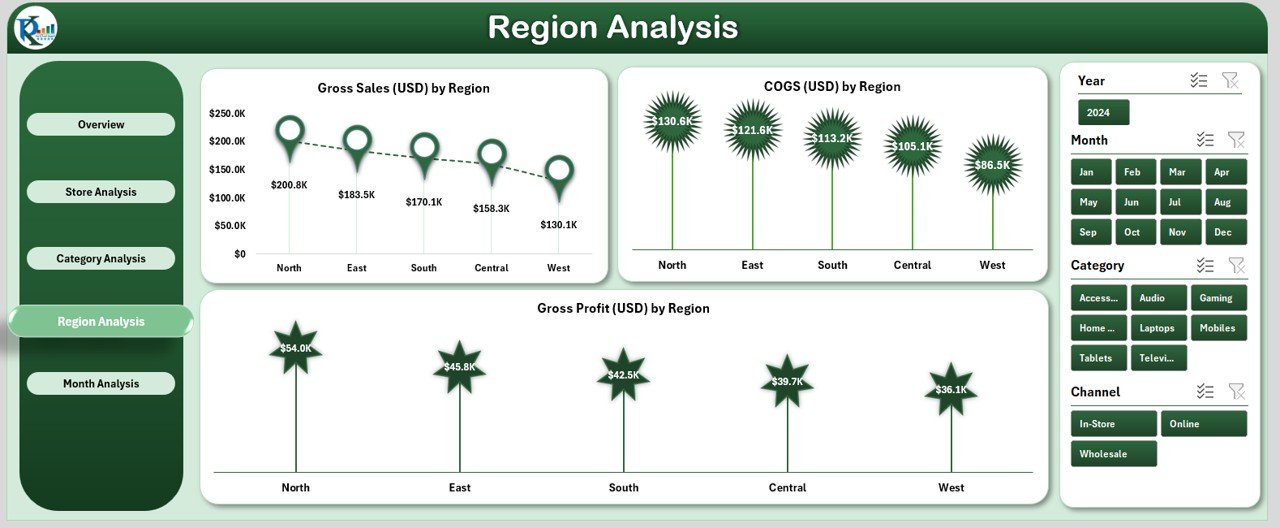
Performance often changes across regions due to pricing, competition, and customer behavior. The Region Analysis Page explains this in detail with three charts:
-
Gross Profit (USD) by Region
-
Gross Profit (USD) by Region (second version to compare filtered data)
-
COGS (USD) by Region
These charts help users:
-
Track market performance
-
Understand cost differences
-
Identify profitable regions
-
Take action in low-performing areas
Because the dashboard updates automatically, regional managers can use it for monthly review meetings.
5. Month Analysis – What Are the Monthly Trends?
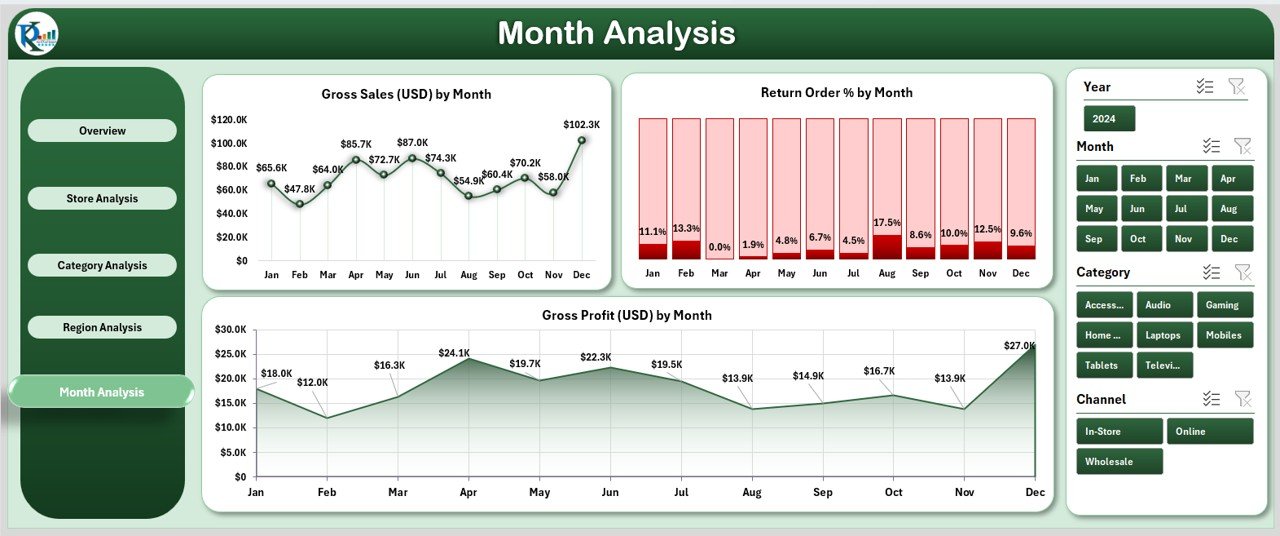
The Month Analysis Page provides a clean month-over-month trend analysis. It includes:
-
Gross Profit (USD) by Month
-
Gross Profit (USD) by Month (comparative version)
-
Return Order % by Month
These visuals help users:
-
Track seasonal trends
-
Understand festival or promotional impacts
-
Compare growth over months
-
Create forecast plans
Because electronics sales often rise during certain events, this page becomes essential for planning inventory and marketing campaigns.
Support Sheet – What Role Does It Play?
The Support Sheet acts as the backend of the dashboard. It stores calculations, tables, and lookup values that power the visuals. You do not need to edit this sheet unless you add new dimensions, categories, or store names.
Data Sheet – Where Do You Enter the Information?
The Data Sheet is the entry point for users. You can paste monthly sales, cost, customer rating, and return order data here.
The dashboard processes:
-
Transaction data
-
Profit values
-
Channel information
-
Store and region data
-
Customer feedback
-
Order counts
-
Monthly numbers
This sheet updates the entire dashboard automatically.
Advantages of the Electronics Retail Dashboard in Excel
Using this dashboard provides several strong advantages:
✔ Faster Decision-Making
Retailers can view data instantly and make quick decisions.
✔ Reduced Manual Work
All calculations and charts update automatically when new data is added.
✔ Improved Accuracy
Because the dashboard uses structured formulas and tables, it reduces reporting errors.
✔ Better Customer Understanding
Customer ratings show what customers love and what needs improvement.
✔ Clear Store and Region Comparison
Managers can compare performance and improve where needed.
✔ Easy Trend Tracking
Monthly charts help track peaks and dips in sales and profit.
✔ Simple for Non-Technical Users
Anyone who knows basic Excel can use this dashboard without training.
✔ Great for Presentations
The visual charts and KPIs help teams present data confidently during meetings.
Why Should You Use Excel for Retail Reporting?
Excel continues to be the most flexible reporting tool because:
-
Teams understand it easily
-
It does not require complex software
-
It works offline
-
It provides endless customization options
-
It supports formulas, pivot tables, and charts
Retailers can start reporting within minutes without expensive subscriptions or technical dependencies.
How Does This Dashboard Support Daily Operations?
This dashboard supports daily retail management in many ways:
-
Store managers track daily sales quickly.
-
Regional managers compare store performance.
-
Finance teams monitor cost and profit trends.
-
Sales teams review salesperson contributions.
-
Business owners understand returns and customer ratings.
Because of these capabilities, the dashboard becomes a daily decision-support tool.
Best Practices for Using the Electronics Retail Dashboard in Excel
To get maximum value from this dashboard, follow these best practices:
1. Update the Data Sheet Regularly
Add fresh data daily or weekly so the dashboard shows accurate insights.
2. Use Clean and Consistent Data
Keep store names, categories, channels, and regions consistent to avoid errors.
3. Track Trends Instead of Single Numbers
Monthly and regional trends reveal deeper patterns.
4. Monitor Return Order % Closely
A high return rate often signals product quality issues or sales miscommunication.
5. Use Slicers for Interactive Analysis
Slicers help you analyze specific stores, months, or regions quickly.
6. Review Customer Ratings Often
Customer feedback helps improve service quality.
7. Compare Profit vs Cost for Each Store
This helps identify stores with potential cost leakages.
8. Use the Dashboard During Monthly Reviews
Use visuals to explain performance easily during meetings.
9. Back Up Data Sheets Regularly
Create monthly backups to avoid data loss.
10. Expand the Dashboard When Needed
You can add more KPIs, categories, or charts as your business grows.
What Problems Does This Dashboard Solve?
This dashboard solves many retail problems:
-
Slow reporting
-
Inaccurate manual calculations
-
Lack of visibility across regions
-
Poor understanding of monthly trends
-
High return rates
-
Difficulty comparing stores
-
Low customer satisfaction tracking
Because of this, the dashboard becomes a powerful business tool.
Conclusion
The Electronics Retail Dashboard in Excel helps retailers track performance with clarity, speed, and confidence. It offers a structured view of sales, profit, returns, customer ratings, and store-level performance. Its five pages—Overview, Store, Category, Region, and Month—provide a complete 360-degree view of business performance.
Because the dashboard runs entirely in Excel, it stays simple, flexible, and easy to update. Any retailer who wants clearer insights, stronger decisions, and faster reporting can use this template to improve business results.
Frequently Asked Questions (FAQs)
1. Who should use the Electronics Retail Dashboard in Excel?
Retail store owners, supply chain teams, category managers, finance teams, and retail executives can use this dashboard.
2. Can beginners use this dashboard easily?
Yes. Users only enter data in the Data Sheet, and the dashboard updates automatically.
3. Can I customize the dashboard for my business?
Yes, you can add new charts, KPIs, stores, or categories without changing the core structure.
4. Does the dashboard support multiple stores?
Yes, it compares performance across all stores and regions.
5. Do I need advanced Excel skills?
No. Basic Excel knowledge is enough.
6. Can I track monthly and yearly trends?
Yes, the Month Analysis page shows complete month-over-month trends.
7. How can I reduce return orders using this dashboard?
Monitor Return Order % regularly and compare it across stores to identify problems.
8. Is this dashboard suitable for online retailers?
Yes. Online and offline channels can be analyzed using the slicers.
9. Can I view salesperson performance?
Yes. Net Sales by Salespersons is available on the Overview Page.
10. Is the dashboard fully automated?
Yes. After you update the Data Sheet, all visuals refresh automatically.
Visit our YouTube channel to learn step-by-step video tutorials