In today’s competitive retail market, electronics retailers face constant challenges — fluctuating demand, changing technology trends, seasonal sales cycles, and complex inventory dynamics. To stay ahead, retailers must make informed decisions based on accurate, timely, and actionable data.
That’s exactly where the Electronics Retail KPI Dashboard in Excel comes in.
This powerful, ready-to-use tool helps retailers monitor their performance through interactive dashboards, data visualizations, and automated KPI tracking — all built within the simplicity of Microsoft Excel.
Click to Purchases Electronics Retail KPI Dashboard in Excel
💡 What Is an Electronics Retail KPI Dashboard in Excel?
An Electronics Retail KPI Dashboard in Excel is a dynamic performance management system that consolidates sales, customer, and inventory data into one unified interface.
It helps you monitor the key performance indicators (KPIs) that drive profitability and operational efficiency — such as sales growth, revenue per product category, inventory turnover, and customer satisfaction.
The dashboard uses Excel formulas, charts, and conditional formatting to visualize both Month-to-Date (MTD) and Year-to-Date (YTD) results, giving retailers a comprehensive view of business performance in real time.
Click to Purchases Electronics Retail KPI Dashboard in Excel
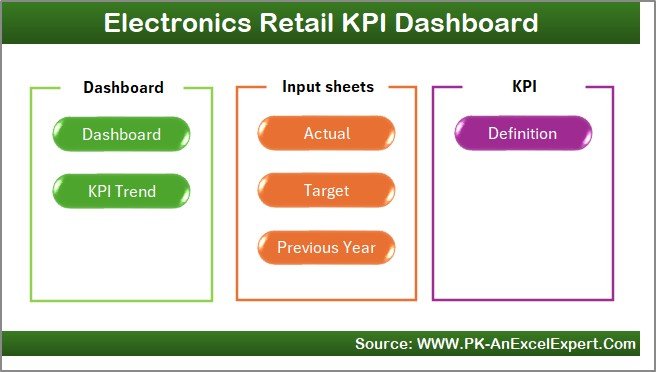
🧩 Structure of the Electronics Retail KPI Dashboard Template
The dashboard is organized into seven key worksheet tabs, each designed for specific analytical purposes.
1. 🏠 Home Sheet – Navigation Hub
The Home Sheet acts as the control center for the entire workbook.
-
It includes six clickable buttons that link to each worksheet.
-
Serves as a clean, user-friendly index page to access the main dashboard, trend charts, and data input areas easily.
-
Helps new users quickly understand the dashboard’s structure and workflow.
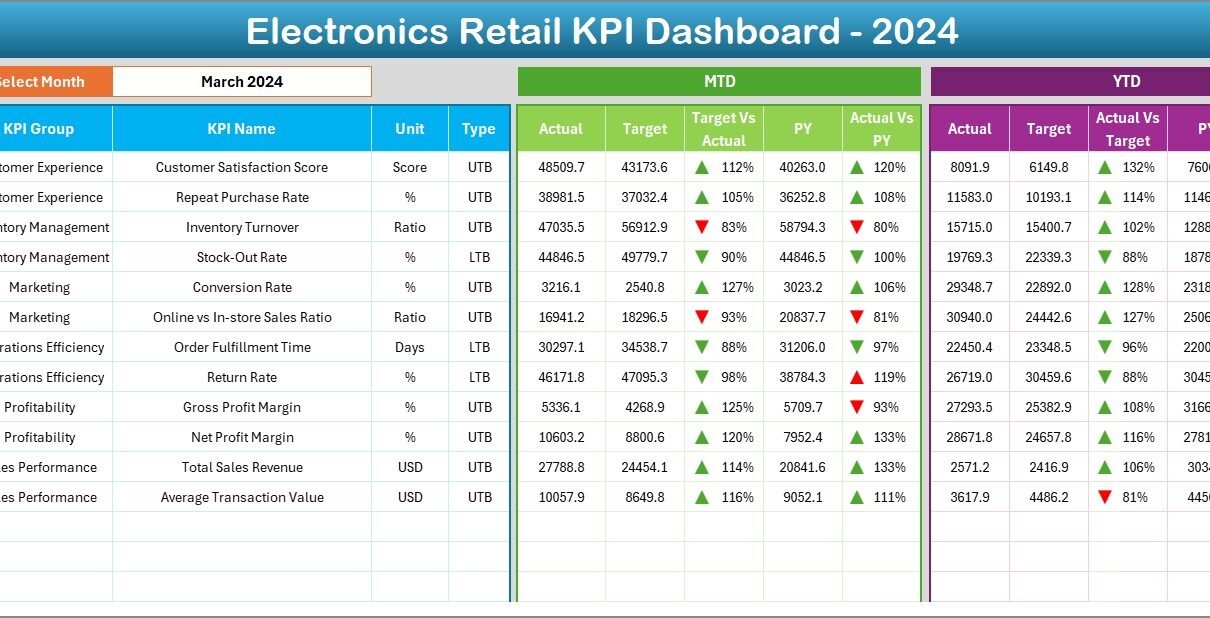
2. 📊 Dashboard Sheet – The Main Performance View
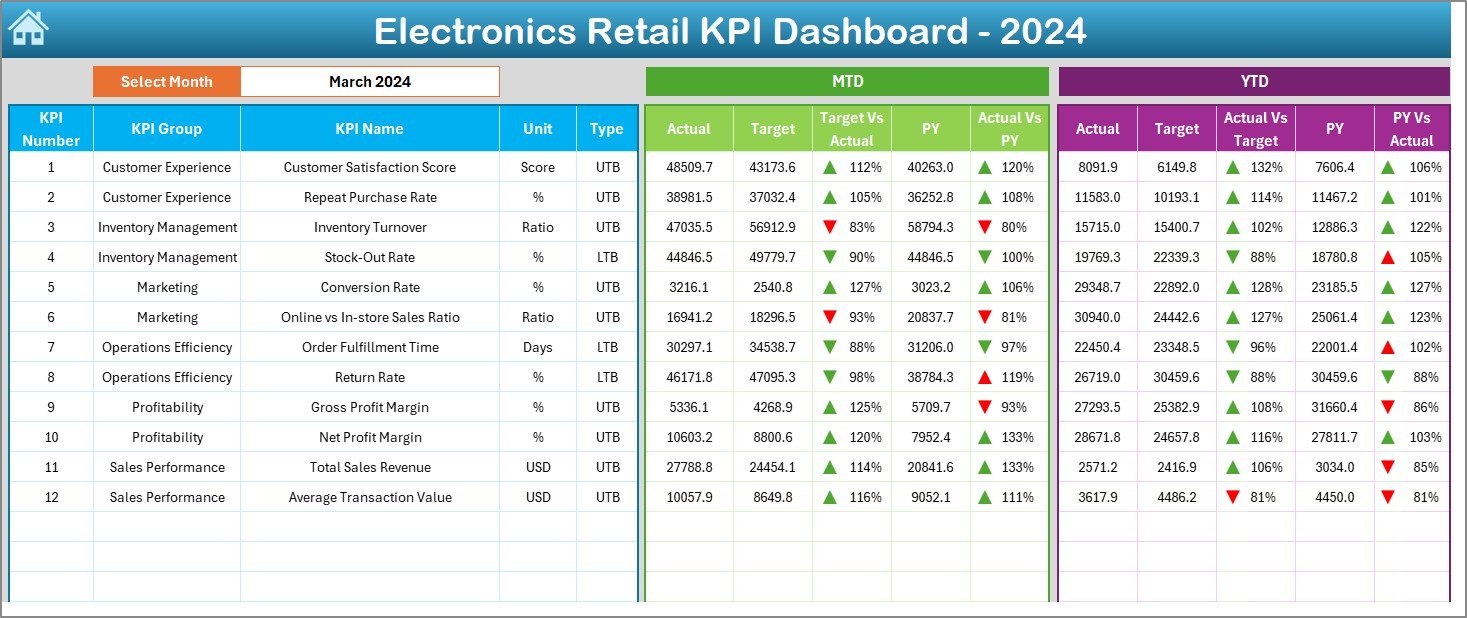
The Dashboard Sheet is the heart of the tool. It displays the overall retail performance metrics in one interactive view.
Key Features:
-
Month Selector (Cell D3): Choose any month from a dropdown list to view results.
-
Dynamic MTD and YTD Analysis: All values update automatically based on the selected month.
-
Actual vs Target Comparisons: Quickly see where performance meets or misses expectations.
-
Conditional Formatting Arrows: Highlight increases or decreases in KPIs compared to targets and previous year (PY).
-
Comprehensive Layout: Displays both MTD and YTD numbers side by side for better context.
This tab serves as the executive summary, ideal for quick reviews and management presentations.
3. 📈 KPI Trend Sheet – Tracking Performance Over Time
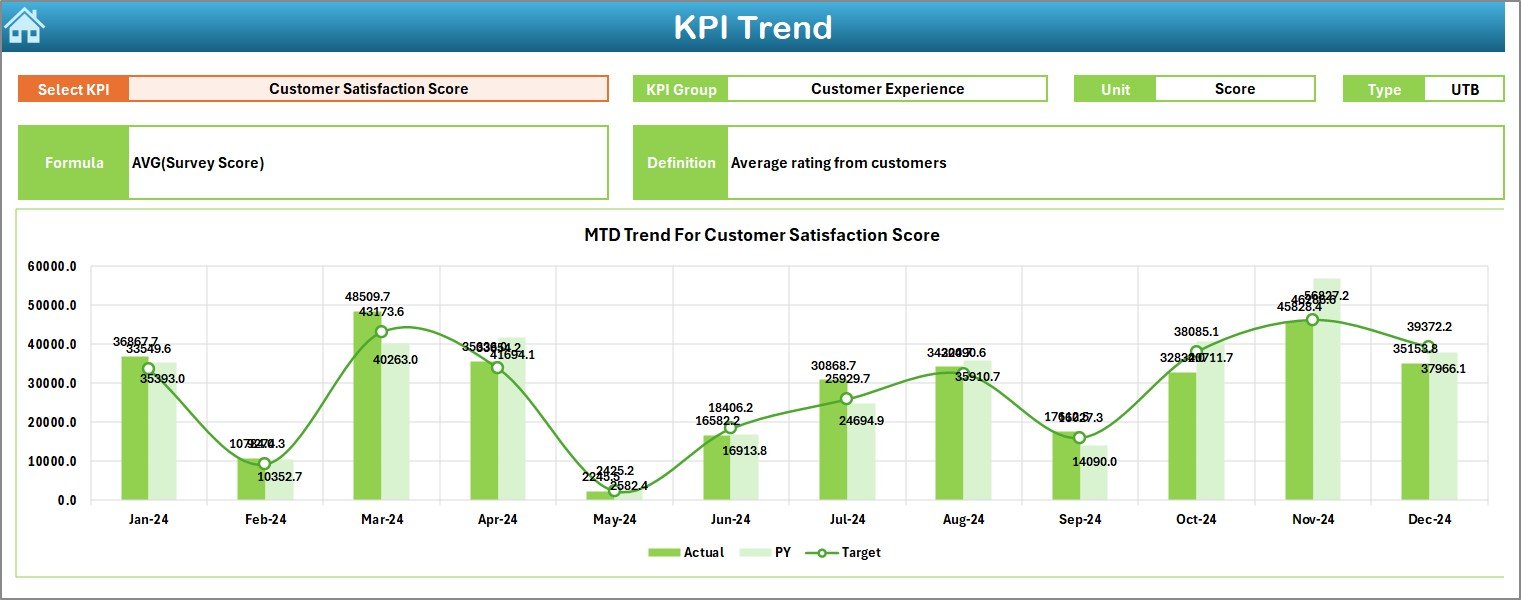
The KPI Trend Sheet enables deeper analysis of individual KPIs.
Functions:
-
KPI Selector (Cell C3): Choose any KPI from the dropdown menu.
-
Displays KPI Group, Unit, Type (UTB/LTB), Formula, and Definition.
-
Provides MTD and YTD trend charts for Actual, Target, and PY data.
-
Helps identify seasonal patterns, growth trends, or performance anomalies.
This sheet is valuable for data analysts, marketing heads, and retail managers who want to see how specific metrics evolve over time.
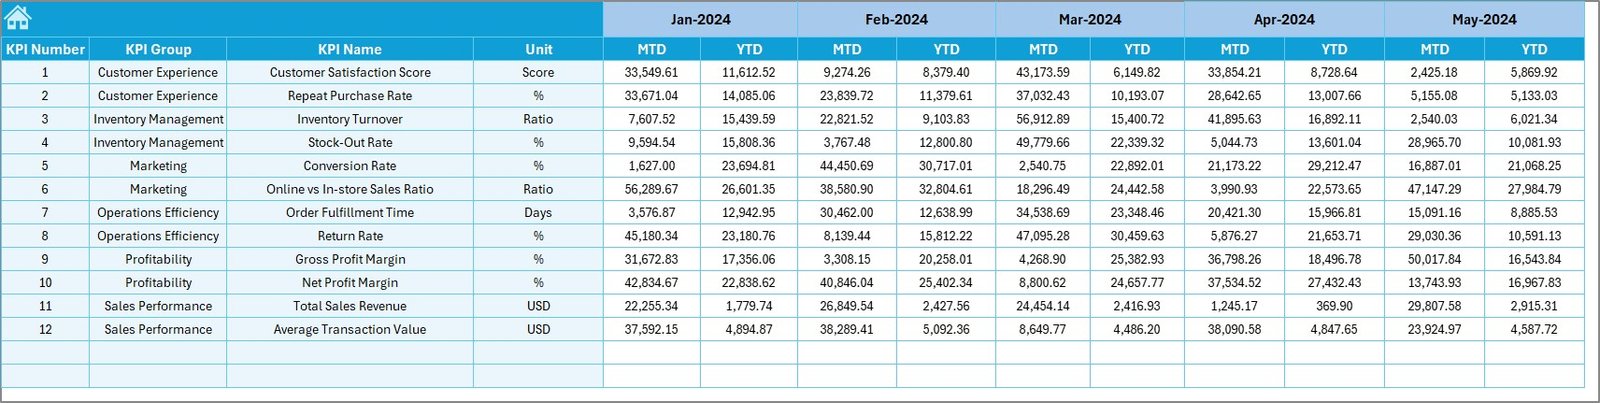
4. 🧾 Actual Numbers Input Sheet – Enter Current Data
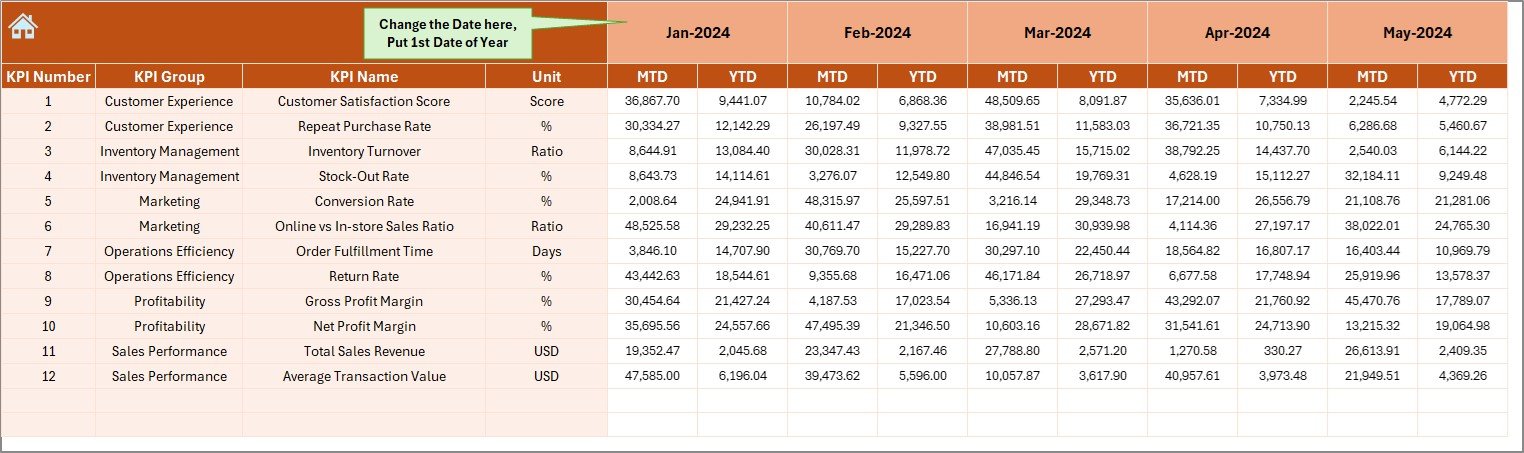
This worksheet is where you record your actual monthly performance figures.
-
Input MTD and YTD data for each KPI.
-
The month range starts from the first month of the year (specified in Cell E1).
-
Data automatically populates charts and summary tables across the workbook.
It’s simple, flexible, and supports continuous monthly updates.
5. 🎯 Target Sheet – Define Performance Goals
In this sheet, users can set MTD and YTD targets for each KPI.
Purpose:
-
Establishes realistic benchmarks for every key performance metric.
-
Facilitates comparison between actual vs target data on the main dashboard.
-
Helps managers align operational goals with sales and profit objectives.
6. 📆 Previous Year Number Sheet – Historical Benchmarking
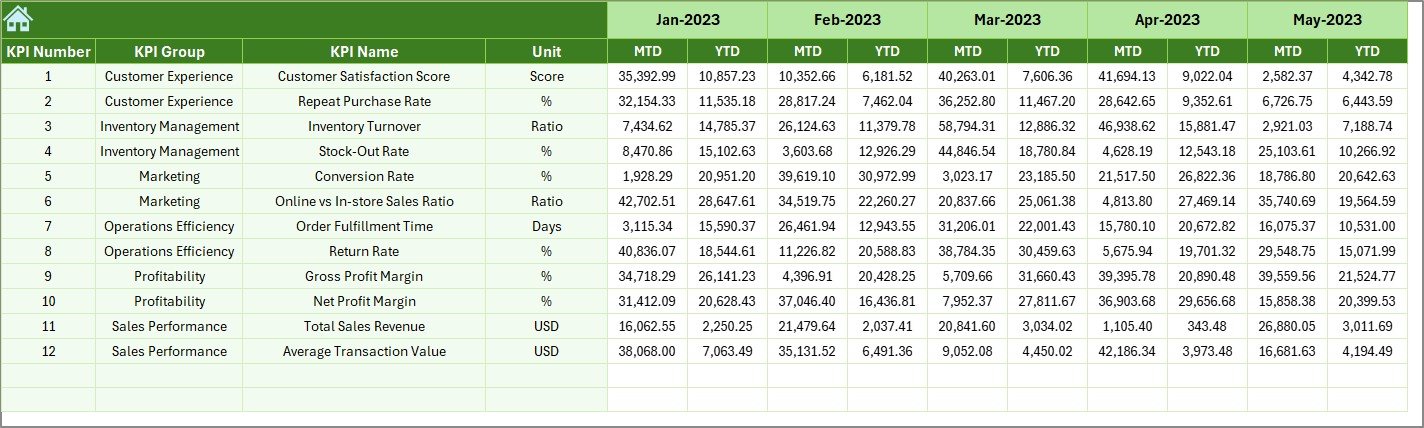
This sheet stores performance data from the previous year.
Benefits:
-
Enables PY vs Actual comparisons.
-
Tracks growth trends and long-term improvements.
-
Helps analyze seasonal and year-on-year sales patterns.
Historical data is essential for forecasting and strategy refinement.
7. 📘 KPI Definition Sheet – Standardized Metric Library
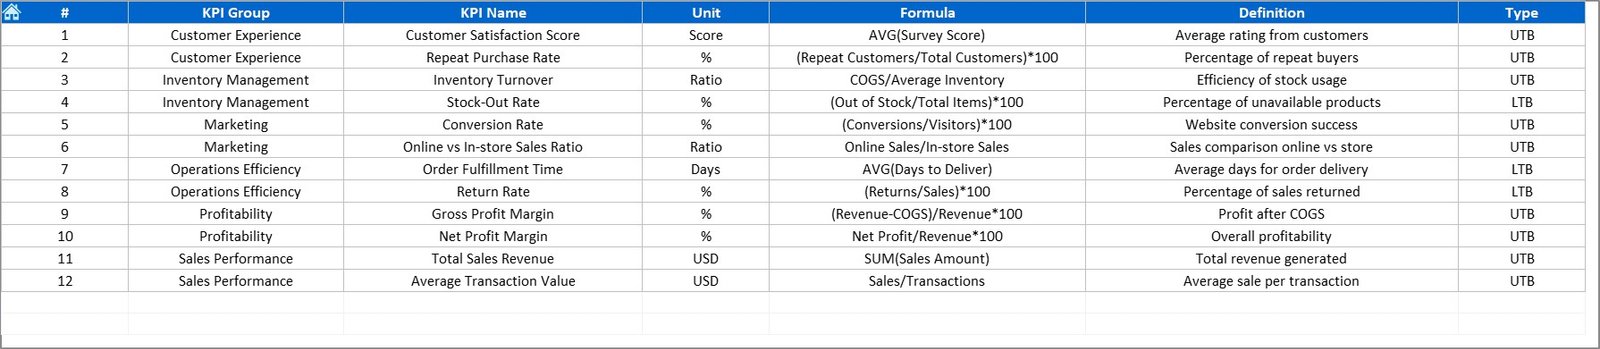
This sheet ensures clarity and uniformity across all KPIs.
Includes Columns For:
-
KPI Name and Group
-
Unit of Measurement (%, $, Units, etc.)
-
Calculation Formula
-
Detailed Definition
Having a structured KPI definition library eliminates confusion and helps all departments stay aligned.
Click to Purchases Electronics Retail KPI Dashboard in Excel
💼 Why Electronics Retailers Need KPI Dashboards
The electronics retail market is dynamic and highly competitive. Without proper visibility into data, decision-making becomes reactive rather than strategic.
A KPI dashboard helps by:
-
Tracking real-time business performance.
-
Identifying profitable products and underperforming segments.
-
Improving inventory control and supply chain management.
-
Boosting customer satisfaction through service metrics.
-
Guiding data-driven strategic decisions across departments.
This single Excel file can replace multiple disconnected reports, giving leadership teams a centralized performance view.
📊 Advantages of Using the Electronics Retail KPI Dashboard in Excel
✅ 1. Unified Performance View
Consolidate data from all retail outlets, product lines, and time periods in one place.
✅ 2. Accurate Decision-Making
Access instant insights through real-time calculations and comparisons.
✅ 3. Time Savings
Automated formulas and visualizations reduce reporting time by up to 80%.
✅ 4. Customizable Layout
Easily modify KPIs, visuals, and targets according to your retail goals.
✅ 5. Clear Visual Feedback
Conditional formatting arrows and color codes simplify interpretation.
✅ 6. Budget-Friendly Solution
Get the benefits of business intelligence without expensive software.
✅ 7. Department-Level Insights
Helps sales, operations, and finance teams align efforts using a shared data source.
🧠 Best Practices for Using the KPI Dashboard
Follow these best practices to ensure smooth and reliable performance tracking:
-
Update Data Regularly: Enter new figures each month without skipping periods.
-
Validate Accuracy: Double-check source data before input.
-
Set SMART Targets: Make goals Specific, Measurable, Achievable, Relevant, and Time-bound.
-
Compare Across Periods: Use MTD, YTD, and PY data for balanced insights.
-
Encourage Team Collaboration: Share insights during performance review meetings.
-
Visualize Effectively: Keep charts clean and uncluttered.
-
Protect Core Sheets: Lock formulas and definitions to prevent accidental changes.
-
Review Trends Quarterly: Spot seasonal shifts or declining product lines early.
-
Keep a Backup: Save copies before making updates.
-
Integrate with Power BI: For advanced visualization and interactive dashboards.
⚠️ Common Mistakes to Avoid
Avoid these pitfalls for consistent dashboard performance:
-
Inputting inconsistent data formats (%, $, text).
-
Ignoring updates to target and PY sheets.
-
Overloading with unnecessary KPIs.
-
Changing formulas without backups.
-
Forgetting to review definitions periodically.
Clean, structured data always ensures better insights.
📘 Example: How a Retail Chain Improved Sales Using This Dashboard
A mid-sized electronics retailer implemented this Excel KPI Dashboard to track store performance across multiple regions.
After just four months:
-
Revenue increased by 12% due to better product-wise insights.
-
Inventory wastage dropped by 18% through optimized stock management.
-
Customer satisfaction improved by 10%, supported by faster issue resolution.
-
Monthly reporting time reduced by 70%.
The dashboard became a vital strategic tool for tracking real performance and planning future goals.
🔍 Why Excel Is Ideal for Retail KPI Tracking
-
Universal Accessibility: No need for specialized software.
-
Full Customization: Add or remove KPIs as your business grows.
-
Data Connectivity: Integrate with POS systems, CSV files, or Power BI.
-
Automation: Use built-in formulas to eliminate manual calculations.
-
Visualization: Create real-time charts and dynamic conditional indicators.
Excel’s flexibility makes it the perfect bridge between data analysis and business intelligence for retail operations.
Click to Purchases Electronics Retail KPI Dashboard in Excel
🧾 Review and Reporting Frequency
-
Weekly: Monitor fast-moving KPIs like sales and orders.
-
Monthly: Review MTD performance and progress toward monthly goals.
-
Quarterly: Evaluate YTD and previous year comparisons for trends.
-
Annually: Use insights for forecasting and budget planning.
Frequent updates ensure that decisions are based on the latest available data.
🧮 Customization Opportunities
You can easily tailor this dashboard to match your organization’s needs:
-
Add KPIs for regional stores or product categories.
-
Include profit contribution graphs by brand or model.
-
Insert slicers for category or region filters.
-
Modify color schemes and themes.
-
Expand data capacity for multi-year tracking.
Every aspect is editable without VBA coding — just Excel logic.
🏁 Conclusion
The Electronics Retail KPI Dashboard in Excel empowers businesses to analyze, compare, and act on performance insights.
With its seven intuitive sheets, dynamic charts, and automatic calculations, it provides complete visibility into the key factors that drive sales, profitability, and efficiency.
From inventory turnover to customer satisfaction, every KPI becomes measurable and actionable.
If you’re looking to take control of your retail performance, this Excel dashboard is your smartest, simplest, and most affordable solution.
Click to Purchases Electronics Retail KPI Dashboard in Excel
❓ Frequently Asked Questions (FAQs)
1. What is the main purpose of the Electronics Retail KPI Dashboard?
It helps track sales, profitability, and operational performance in one Excel-based dashboard.
2. How many KPIs can I include?
You can start with 12–15 KPIs and expand based on your business model.
3. Can I customize the KPI formulas?
Yes, all formulas are editable and adaptable to your own calculations.
4. What does UTB and LTB mean?
UTB (Upper the Better) and LTB (Lower the Better) define whether higher or lower values indicate better performance.
5. Can small retailers use this template?
Absolutely — it’s scalable for both single-store and multi-store operations.
6. How do I update data monthly?
Enter actual, target, and PY data in their respective sheets; the dashboard updates automatically.
7. Does it require Excel macros?
No, it works entirely with formulas and dropdowns — no VBA needed.
8. Can I integrate this dashboard with Power BI?
Yes, you can link Excel tables directly to Power BI for interactive visualizations.
9. Is this suitable for product category analysis?
Yes, you can categorize KPIs by brand, model, or region for granular insights.
10. How does it help in decision-making?
It offers real-time performance visibility, enabling faster, data-backed decisions.
Click to Purchases Electronics Retail KPI Dashboard in Excel
Visit our YouTube channel to learn step-by-step video tutorials