The electronics retail industry changes every day. Prices shift quickly, customers move between brands fast, and sales trends vary across stores, categories, and regions. Because the market moves so rapidly, retailers must monitor performance constantly. However, manual reporting takes time and usually leads to slow decisions.
A Electronics Retail KPI Dashboard in Power BI solves this problem instantly. It transforms raw data into meaningful insights, highlights performance trends, and gives retail teams a complete view of business health. Whether you track sales, returns, customer ratings, or store performance, this dashboard brings everything into one visual and interactive platform.
In this article, you will explore how this dashboard works, what each page shows, how Excel data flows into Power BI, and why this single tool improves decision-making dramatically. You will also discover advantages, best practices, and a complete FAQ section to help you use the dashboard effectively.
Click to Purchases Electronics Retail KPI Dashboard in Power BI
What Is an Electronics Retail KPI Dashboard in Power BI?
An Electronics Retail KPI Dashboard in Power BI is a ready-to-use business intelligence template designed for electronics retailers. It helps users track:
-
Monthly sales performance
-
Target vs actual results
-
Customer experience indicators
-
Store efficiency
-
MTD (Month to Date) and YTD (Year to Date) numbers
-
Year-over-year comparisons
-
Trends and KPI patterns
Since the dashboard runs completely in Power BI, users get the benefit of:
-
Interactive slicers
-
Automated calculations
-
Visual charts and icons
-
Clear comparisons
-
Drill-through insights
-
Fast refresh with Excel updates
This dashboard becomes a powerful performance tracking system for any electronics retailer.
Click to Purchases Electronics Retail KPI Dashboard in Power BI
Why Do Electronics Retailers Need a KPI Dashboard?
Electronics retail comes with challenges that change month by month. Stores manage:
-
Large SKU volumes
-
Seasonal buying behavior
-
Competitive pricing
-
Frequent product launches
-
High return rates
-
Complex sales funnels
Because of these challenges, retailers need a system that:
-
Shows real-time sales insights
-
Tracks performance across categories
-
Highlights underperforming areas
-
Identifies trends early
-
Supports fast decision-making
The Power BI dashboard helps retailers understand what works, what does not, and where improvements are needed.
Click to Purchases Electronics Retail KPI Dashboard in Power BI
Key Features of the Electronics Retail KPI Dashboard in Power BI
The dashboard includes three powerful pages, each designed with a specific purpose: performance monitoring, trend analysis, and KPI understanding.
Let’s explore each one in detail.
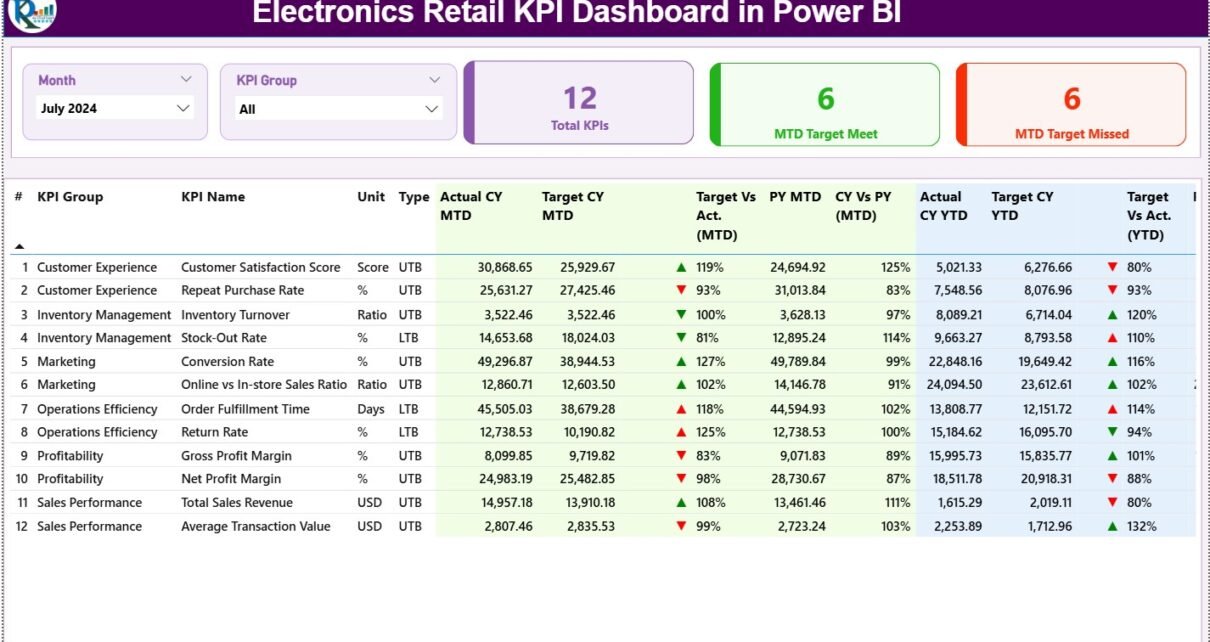
1. Summary Page – The Main Dashboard View

The Summary Page is the centerpiece of the dashboard. It gives a comprehensive view of all KPIs and shows real-time performance.
Top-Level Slicers
At the top, two slicers help filter the dashboard instantly:
-
Month Slicer
-
KPI Group Slicer
These slicers allow users to view performance for:
-
Customer KPIs
-
Sales KPIs
-
Store KPIs
-
Service KPIs
-
Operations KPIs
With one click, the entire dashboard updates.
KPI Cards
Below the slicers, three performance cards display:
-
Total KPIs Count
-
MTD Target Met Count
-
MTD Target Missed Count
These cards give retailers a quick summary of how the business performs for the selected month.
Detailed KPI Table
The highlight of the summary page is a detailed KPI performance table. It includes the following columns:
-
KPI Number
-
KPI Group
-
KPI Name
-
Unit of Measurement
-
Type (UTB or LTB)
-
Actual CY MTD – Month-to-date actual value
-
Target CY MTD – Month-to-date target value
-
MTD Icon (▲ / ▼) – Performance indicator
-
Target vs Actual (MTD) – MTD achievement percentage
-
PY MTD – Previous year MTD
-
CY vs PY (MTD) – Current vs previous year trend
-
Actual CY YTD – Year-to-date actual value
-
Target CY YTD – Target YTD value
-
YTD Icon (▲ / ▼) – YTD performance indicator
-
Target vs Actual (YTD) – YTD achievement percentage
-
PY YTD – Previous year YTD
-
CY vs PY (YTD) – YoY comparison
Because the table provides complete performance visibility, it helps users identify:
-
Declining KPIs
-
Missed targets
-
High-performing KPIs
-
Year-over-year improvements
-
Gaps in performance
-
Target deviations
This page serves as the main performance hub for the entire dashboard.
Click to Purchases Electronics Retail KPI Dashboard in Power BI
2. KPI Trend Page

The KPI Trend Page helps retailers understand performance patterns across the year.
KPI Selection Slicer
On the left side, the slicer allows users to select any KPI. Once a KPI is selected, the entire page updates.
Two Combo Charts
The page contains two powerful combo charts:
MTD Trend Chart
This chart compares:
-
Current Year MTD
-
Target MTD
-
Previous Year MTD
It shows how the KPI performs each month, helping users identify improvements or drops.
YTD Trend Chart
This chart compares:
-
Current Year YTD
-
Target YTD
-
Previous Year YTD
Users can instantly see if YTD performance matches expectations or requires attention.
These charts help in:
-
Sales forecasting
-
Category planning
-
Performance improvement
-
Seasonal analysis
-
Business goal tracking
3. KPI Definition Page

The KPI Definition Page is a hidden drill-through page. It only opens when a user right-clicks a KPI in the summary page and selects Drill Through.
This page displays:
-
KPI Number
-
KPI Group
-
KPI Name
-
Unit
-
Formula
-
KPI Definition
-
KPI Type (UTB or LTB)
This page helps teams understand:
-
Calculation rules
-
KPI meaning
-
Expected performance type
-
How to interpret results
Users simply click the Back button at the top-left corner to return to the Summary Page.
Excel Data Structure for the Dashboard
The dashboard reads its data from one Excel file, which contains three structured worksheets.
Let’s understand each one.
1. Input_Actual Sheet
This sheet stores all actual performance numbers. Columns include:
-
KPI Name
-
Month (first date of the month)
-
MTD Actual
-
YTD Actual
Retail teams update these values every month.
2. Input_Target Sheet
This sheet stores KPI targets. Columns include:
-
KPI Name
-
Month
-
MTD Target
-
YTD Target
The dashboard uses this data to compare target vs actual values.
3. KPI Definition Sheet
This sheet documents each KPI. Columns include:
-
KPI Number
-
KPI Group
-
KPI Name
-
Unit
-
Formula
-
Definition
-
Type (UTB or LTB)
This sheet ensures that every KPI is well-defined and easy to understand.
Click to Purchases Electronics Retail KPI Dashboard in Power BI
Advantages of Electronics Retail KPI Dashboard in Power BI
This dashboard offers many powerful advantages.
1. Clear Performance Visibility
Users get immediate insights into all KPIs without opening multiple reports.
2. Accurate Target vs Actual Tracking
The dashboard highlights exactly where performance meets or misses targets.
3. Trend Analysis Made Easy
Combo charts help users understand long-term performance behavior.
4. Faster Decision-Making
Retail teams can make data-backed decisions quickly.
5. Zero Manual Reporting
Once the Excel file updates, Power BI refreshes the entire dashboard automatically.
6. Drill-Through Understanding
Users can see KPI formulas and definitions instantly.
7. Better Retail Management
Because the dashboard covers all KPIs, leaders identify gaps early and act fast.
Best Practices for Using the Electronics Retail Power BI Dashboard
Follow these best practices for the best results:
1. Update the Excel File Every Month
Always use the first date of the month for consistency.
2. Keep KPI Names Consistent
Actual, Target, and Definition worksheets must follow the same KPI name.
3. Validate Previous Year Data
Accurate PY numbers are essential for reliable comparisons.
4. Refresh Power BI After Each Update
Use the Refresh button to load new numbers.
5. Use Drill-Through Frequently
Check KPI definitions to understand formulas clearly.
6. Analyze Trends Regularly
Trend charts help you identify seasonal and yearly patterns.
7. Track Icons Carefully
Green ▲ means improvement.
Red ▼ means immediate attention required.
How This Dashboard Supports Smarter Retail Decisions
Because the dashboard provides accurate, real-time insights, leaders can:
-
Identify profitable categories
-
Reduce return rates
-
Improve store performance
-
Track sales targets
-
Improve customer service
-
Plan better inventory
-
Strengthen pricing strategy
This dashboard becomes an essential command center for every electronics retail business.
Conclusion
A Electronics Retail KPI Dashboard in Power BI gives retailers complete visibility into performance. It tracks KPIs, compares targets, shows trends, and highlights performance gaps instantly. With interactive slicers, drill-through pages, and automated visuals, this dashboard helps retail teams make faster and smarter decisions.
Whether you want to improve profitability, strengthen customer satisfaction, or enhance store performance, this dashboard provides everything in one place.
Frequently Asked Questions (FAQs)
1. What does the Electronics Retail KPI Dashboard track?
It tracks sales KPIs, customer KPIs, service KPIs, operational KPIs, and category-level performance.
2. How does the data update?
You update the Excel source file, and Power BI refreshes the dashboard instantly.
3. Does the dashboard compare with previous year data?
Yes, it compares both MTD and YTD with previous year values.
4. Can I add new KPIs?
Yes, you can add new KPIs by updating the KPI Definition sheet and Actual/Target sheets.
5. What skills do I need to use this dashboard?
Basic Power BI and Excel knowledge is enough.
6. Is the KPI Definition page visible?
No, it is a hidden drill-through page accessible from the summary page.
7. Can the visuals be customized?
Yes, you can modify charts, icons, and colors inside Power BI.
Click to Purchases Electronics Retail KPI Dashboard in Power BI
Visit our YouTube channel to learn step-by-step video tutorials