In today’s rapidly evolving technological landscape, the electronics and semiconductor industry plays a vital role in powering innovation. From smartphones and consumer gadgets to AI hardware and electric vehicles, semiconductors form the foundation of every digital product. Managing the performance, production, and profitability of this complex industry requires a powerful data-driven tool — and that’s where the Electronics & Semiconductors Dashboard in Excel comes in.
This ready-to-use Excel dashboard helps businesses visualize key performance indicators (KPIs), track costs, monitor revenues, and optimize efficiency across departments, products, and processes. Whether you are an operations manager, finance analyst, or production planner, this dashboard turns raw data into clear, actionable insights — all within the familiar interface of Microsoft Excel.
Click to Purchases Electronics & Semiconductors Dashboard in Excel
What Is an Electronics & Semiconductors Dashboard in Excel?
An Electronics & Semiconductors Dashboard in Excel is a visual analytical tool designed to consolidate and monitor all key performance metrics related to electronics manufacturing and semiconductor production. It provides an at-a-glance view of company performance across various dimensions such as:
-
Departmental efficiency
-
Production and material costs
-
Revenue vs. cost analysis
-
Energy consumption
-
Product and process performance
-
Monthly trends and investments
This dashboard combines automation, formulas, and dynamic charts to help decision-makers identify bottlenecks, measure profitability, and manage complex data without the need for specialized software.
Why Does the Electronics Industry Need a Dashboard?
The electronics and semiconductor sectors involve multiple layers — design, fabrication, assembly, testing, packaging, and distribution. Each of these stages generates large volumes of data. Managing all of it manually often leads to errors, inefficiencies, and lost opportunities.
Here’s why using a dedicated Excel-based dashboard is essential:
📈 Centralized Analytics: Consolidates all performance data into one interactive dashboard.
⚙️ Real-Time Insights: Provides quick visualizations of KPIs like energy cost, profit, and production efficiency.
💡 Data-Driven Decisions: Helps managers evaluate production processes, detect inefficiencies, and improve cost allocation.
⏱️ Time Efficiency: Eliminates manual report creation through automated charts and pivot tables.
💰 Cost-Effective Solution: No need for complex BI tools — Excel provides everything in one place.
Key Features of the Electronics & Semiconductors Dashboard in Excel
This Excel template includes multiple interconnected sheets and dynamic visual components designed for easy use and high analytical value.
Below are the core components and features of this dashboard:
1. Page Navigator
Located on the left side, the Page Navigator allows users to jump between analytical sections instantly. With a single click, you can explore department, product, process, and month-wise analyses — making navigation smooth and efficient.
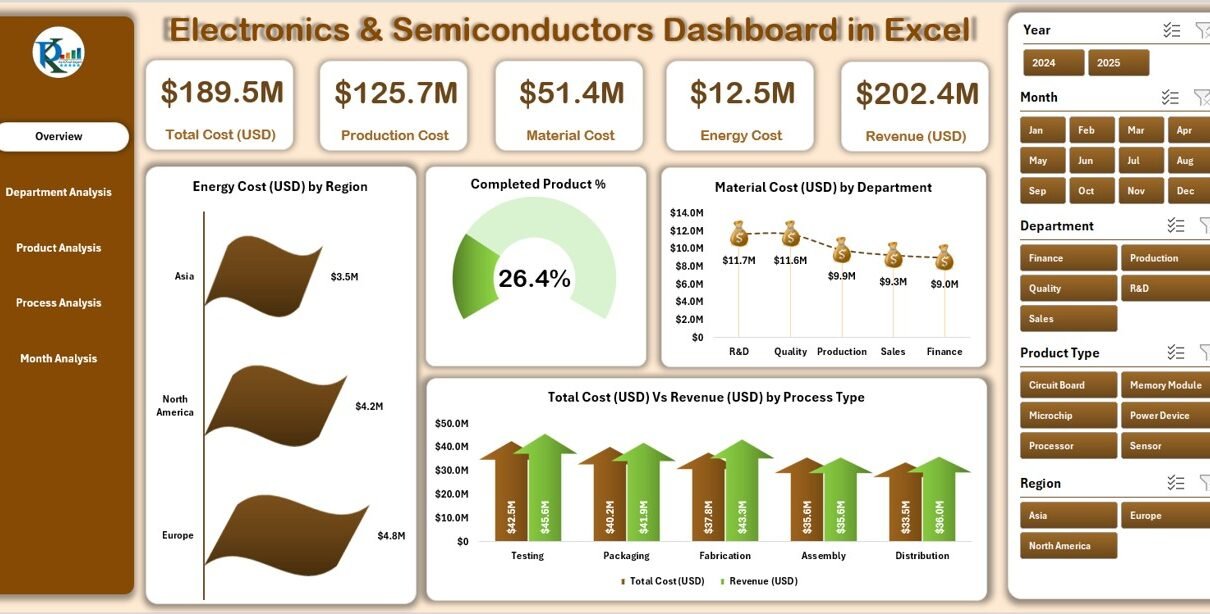
2. Overview Page
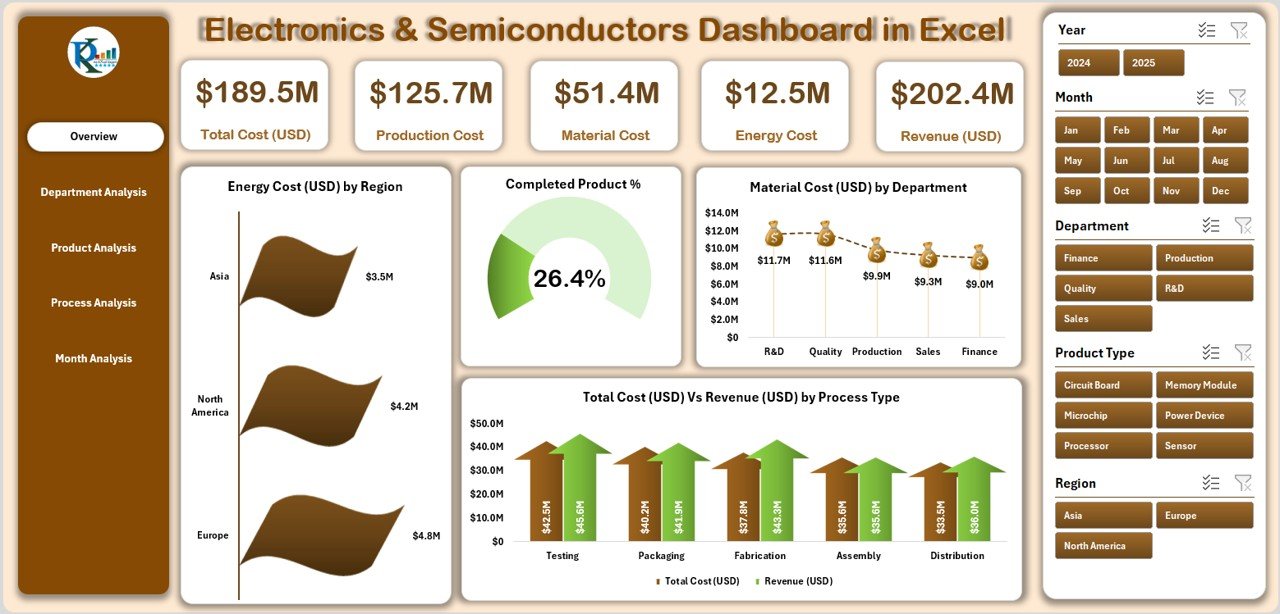
The Overview Page acts as the central hub for organizational insights. It contains five KPI cards that summarize overall company performance.
You can instantly view charts such as:
-
Energy Cost (USD) by Region
-
Completed Product %
-
Material Cost (USD) by Department
-
Total Cost (USD) vs. Revenue (USD) by Process Type
This page gives a holistic picture of financial health, production efficiency, and cost-to-revenue balance — empowering executives to make quick strategic decisions.
3. Department Analysis Page
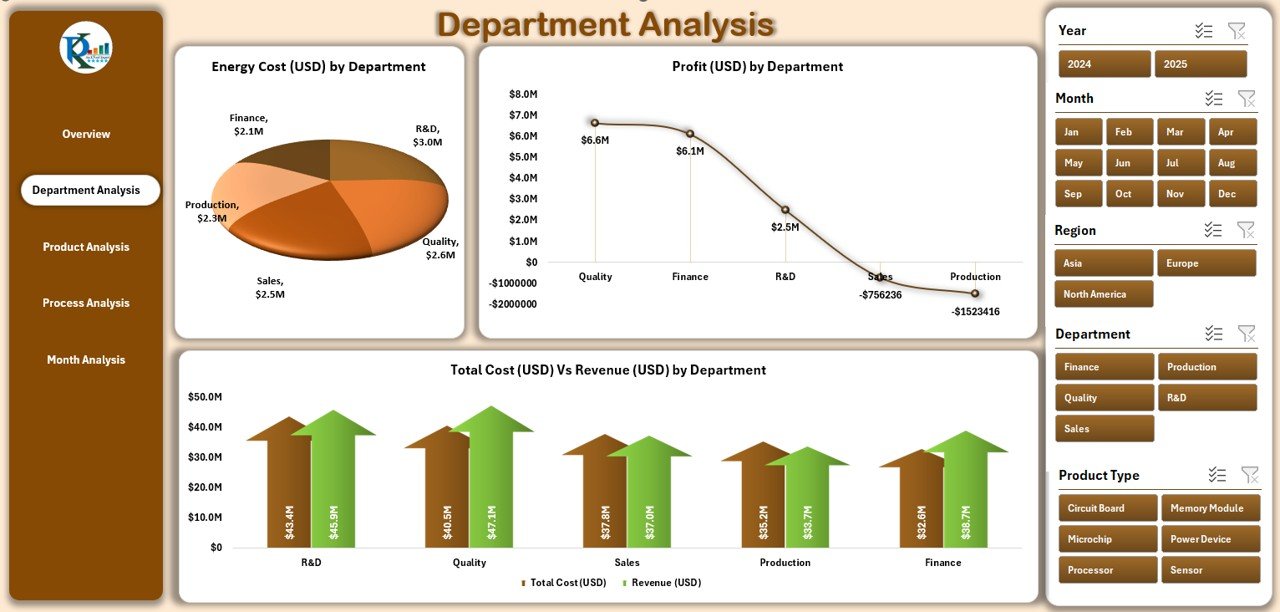
The Department Analysis Page breaks down costs and profits across different departments.
It includes:
-
Energy Cost (USD) by Department
-
Profit (USD) by Department
-
Total Cost (USD) vs. Revenue (USD) by Department
This helps managers evaluate which departments are performing efficiently and which need resource optimization.
Click to Purchases Electronics & Semiconductors Dashboard in Excel
4. Product Analysis Page
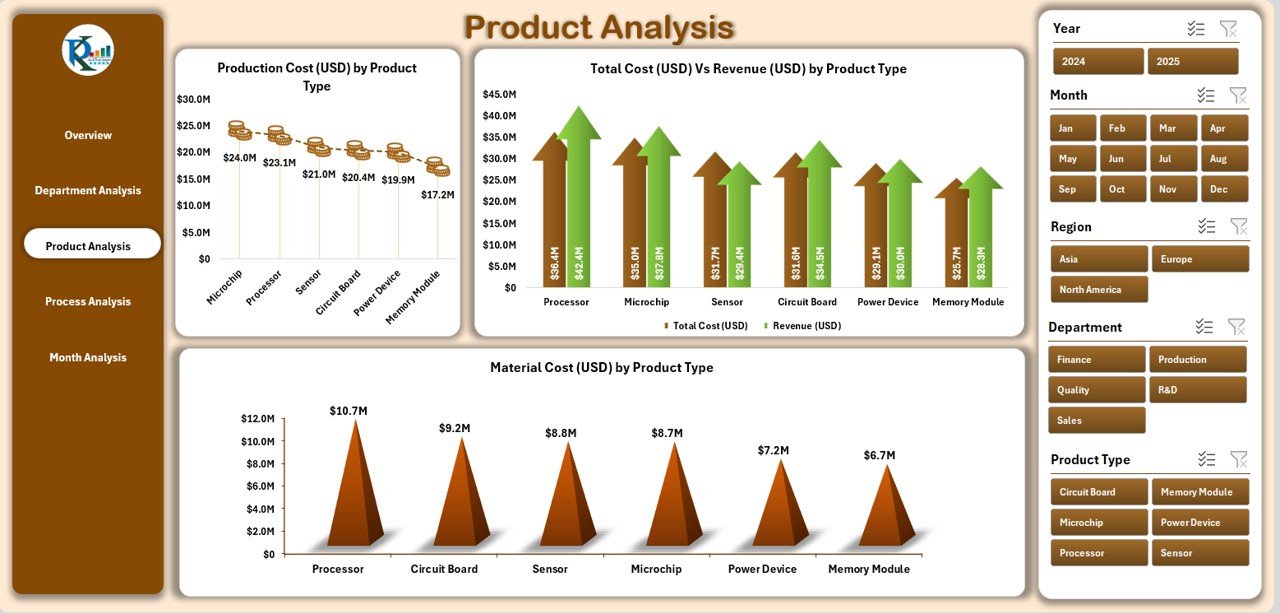
On the Product Analysis Page, users can assess product-wise performance and profitability.
Key charts include:
-
Total Cost (USD) vs. Revenue (USD) by Product Type
-
Production Cost (USD) by Product Type
-
Material Cost (USD) by Product Type
This section allows decision-makers to identify top-performing products, reduce material wastage, and plan better for future manufacturing cycles.
5. Process Analysis Page
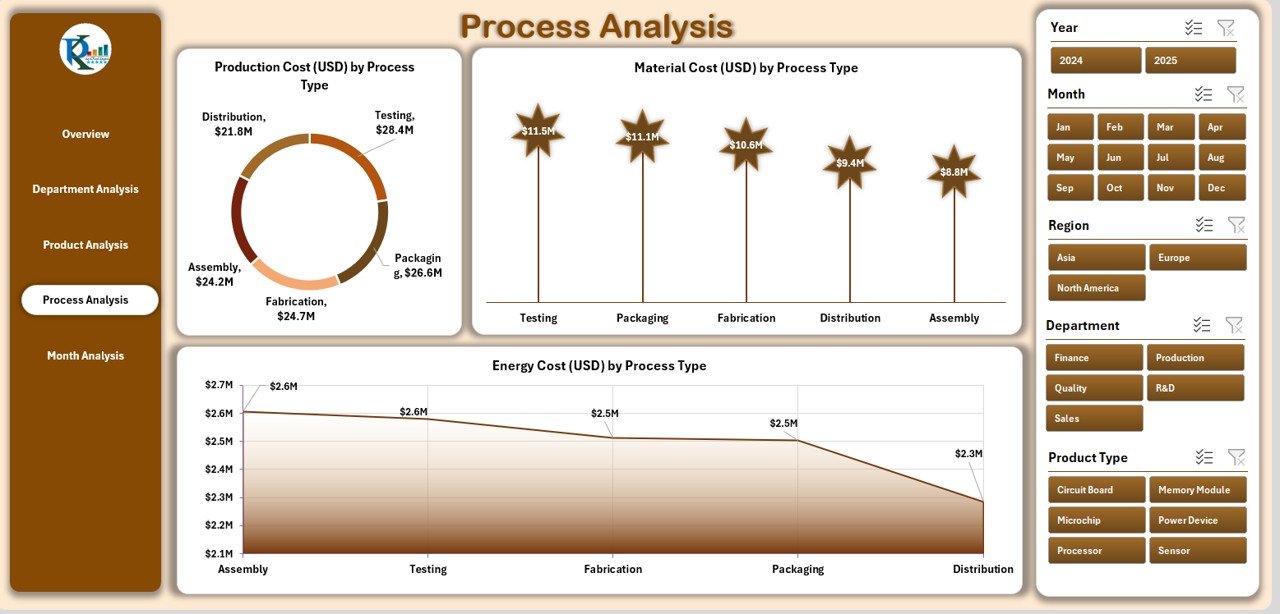
This page focuses on process-level insights — essential for semiconductor fabrication and assembly units.
You’ll find charts like:
-
Production Cost (USD) by Process Type
-
Material Cost (USD) by Process Type
-
Energy Cost (USD) by Process Type
These analytics reveal which processes consume the most resources and how they impact total output and profit margins.
6. Month Analysis Page
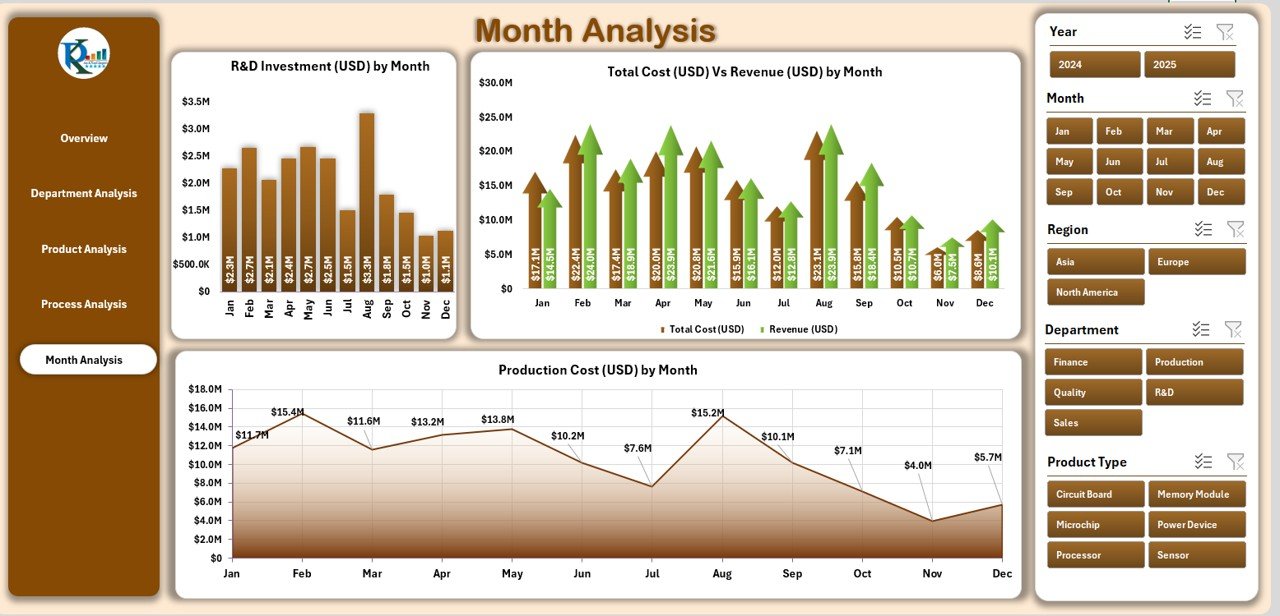
The Month Analysis Page provides a time-based perspective of operational performance.
It includes:
-
Production Cost (USD) by Month
-
R&D Investment (USD) by Month
-
Production Output (USD) by Month
This page helps leadership teams identify seasonal patterns, investment returns, and monthly cost fluctuations — enabling better budgeting and forecasting.
7. Support Sheet
The Support Sheet stores backend formulas, named ranges, and reference data used throughout the dashboard. It ensures smooth functioning of slicers, dropdown menus, and pivot calculations.
8. Data Sheet
The Data Sheet is the engine room of this dashboard. It contains all the raw transactional data related to production, cost, revenue, and other metrics. The information entered here automatically reflects on all analytical pages — making the dashboard fully dynamic.
How Does the Dashboard Work?
The Electronics & Semiconductors Dashboard in Excel uses a combination of formulas, pivot tables, and dynamic charts.
Here’s the step-by-step functionality:
-
Input Raw Data:
Users enter monthly or weekly data such as production cost, material cost, revenue, and energy cost into the Data Sheet. -
Automated Calculations:
Excel formulas calculate KPIs such as total cost, profit, revenue difference, and completed product percentage. -
Visualization:
Charts and pivot tables automatically refresh based on slicer selections such as region, month, or department. -
Interactive Filtering:
The left-side slicer allows filtering across different analytical dimensions — for instance, viewing results for a specific region or month. -
Real-Time Updates:
Whenever data changes, all dependent visuals update automatically — ensuring continuous accuracy.
Advantages of the Electronics & Semiconductors Dashboard in Excel
The benefits of using this dashboard go far beyond visualization. It transforms complex operational data into actionable business insights.
1. Enhanced Decision-Making
Executives gain a clear, concise view of performance metrics. This helps in quick decision-making, improving productivity, and maximizing profits.
2. Cost Control
By comparing total costs against revenues at department or process level, businesses can pinpoint inefficiencies and cut down unnecessary expenses.
3. Improved Transparency
Data visibility across the organization improves accountability and performance monitoring. Managers can identify problem areas early and take corrective measures.
4. Data Accuracy and Consistency
Automation minimizes manual errors, ensuring reliable insights for budgeting, planning, and resource allocation.
5. Performance Optimization
From R&D to manufacturing, each segment can analyze its contribution to the company’s overall success.
6. Time Savings
Instead of creating separate reports manually, this dashboard centralizes everything — reducing report preparation time by more than 70%.
7. Scalable and Customizable
Since it’s Excel-based, users can easily modify formulas, add KPIs, or integrate new data sources without technical skills.
How to Use the Electronics & Semiconductors Dashboard Effectively
To maximize the potential of this dashboard, follow these simple steps:
- Input Historical Data: Add production, cost, and revenue figures for at least the last 12 months.
- Set Targets: Define monthly or quarterly targets for key metrics.
- Analyze Variance: Compare actual results vs. targets using built-in charts.
- Use Filters: Adjust slicers to explore department-wise or region-wise results.
- Export Insights: Capture charts or KPIs for presentations or reports.
Who Can Use This Dashboard?
This Excel dashboard caters to a wide range of professionals within the electronics and semiconductor ecosystem, including:
-
Production managers
-
Process engineers
-
Financial controllers
-
Operations analysts
-
Quality assurance teams
-
Senior executives
It’s ideal for both small manufacturers and large-scale semiconductor fabrication units seeking to gain more control and visibility over their performance.
Best Practices for the Electronics & Semiconductors Dashboard in Excel
To keep your dashboard efficient, accurate, and insightful, follow these best practices:
✅ 1. Keep Data Clean
Always validate your input data. Remove duplicates, fix missing values, and maintain consistent units of measurement.
✅ 2. Use Consistent Date Formats
Ensure that all date columns use the same format (e.g., DD-MMM-YYYY). This allows time-based visuals to function properly.
✅ 3. Update Regularly
Feed new data each month or week to maintain accuracy in KPIs and charts.
✅ 4. Protect Formula Cells
Lock critical formula areas in the support sheet to prevent accidental overwrites.
✅ 5. Use Conditional Formatting
Apply color codes to highlight top-performing products or cost-intensive processes for easy identification.
✅ 6. Document Changes
Maintain a log of edits made to formulas, KPIs, or charts to ensure version control.
✅ 7. Backup Your File
Always keep a backup copy of your dashboard before making major updates or modifications.
Real-World Use Cases
Here’s how different professionals benefit from this dashboard:
-
Production Managers use it to track daily or monthly output efficiency.
-
Finance Teams compare cost vs. revenue for every department and region.
-
R&D Teams measure investment returns over time.
-
Executives use the Overview page to get a one-page summary of company health before quarterly reviews.
Tips for Customization
You can easily customize this dashboard to fit your organization’s unique requirements.
Here are some quick ideas:
-
Add KPIs such as Yield Rate %, Downtime %, Scrap Cost, or On-Time Delivery %.
-
Integrate Forecasting Models using Excel formulas like TREND or FORECAST.
-
Create region-wise breakdowns for multinational operations.
-
Link it with Power BI for more advanced visualizations and interactivity.
-
Add VBA automation for report generation or email sharing.
Common Challenges in the Semiconductor Industry
Before dashboards like this existed, most semiconductor companies faced these recurring challenges:
-
Difficulty in consolidating production and financial data
-
Limited visibility across departments
-
Manual errors in cost tracking
-
Time-consuming reporting cycles
-
Delays in identifying inefficiencies
The Electronics & Semiconductors Dashboard solves all these problems by offering an integrated, automated, and user-friendly solution.
Conclusion
The Electronics & Semiconductors Dashboard in Excel is more than just a reporting tool — it’s a complete business performance solution. With intuitive navigation, interactive visuals, and accurate KPI monitoring, it helps organizations gain control over costs, improve decision-making, and enhance efficiency.
Whether you manage a small manufacturing unit or a large semiconductor plant, this dashboard delivers clarity, transparency, and measurable improvement — all in the simplicity of Excel.
Frequently Asked Questions (FAQs)
1. What is the purpose of the Electronics & Semiconductors Dashboard in Excel?
It helps businesses track production performance, costs, and revenue efficiently using automated Excel visuals and KPIs.
2. Can I customize the dashboard for my company?
Yes, you can easily edit formulas, add KPIs, or modify visuals according to your organizational needs.
3. Do I need advanced Excel skills to use it?
No. The dashboard is user-friendly and designed for anyone with basic Excel knowledge.
4. How often should I update the data?
You should update it monthly or weekly depending on your reporting frequency to maintain accuracy.
5. Can this dashboard handle large datasets?
Yes. Excel’s Power Pivot and formula optimization ensure smooth performance even with thousands of records.
6. What if I want to add new analysis pages?
You can duplicate existing sheets and adjust pivot sources to add new dimensions or KPIs.
7. Is this dashboard suitable for small businesses?
Absolutely. It’s affordable, scalable, and perfect for small manufacturers or startups in the electronics sector.
8. How can I visualize profitability trends?
Use the “Total Cost vs. Revenue” charts available on Overview, Department, and Product pages for quick profit comparisons.
9. Can I share this dashboard with others?
Yes, you can share it like any Excel file or convert it to PDF for presentations.
Visit our YouTube channel to learn step-by-step video tutorials
Click to Purchases Electronics & Semiconductors Dashboard in Excel