The electronics and semiconductor industry is one of the fastest-evolving sectors in the world. With constant innovations, global supply chain challenges, and ever-increasing demand for high-performance components, businesses in this field must monitor performance carefully.
That’s where the Electronics & Semiconductors KPI Dashboard in Power BI comes in — a dynamic, interactive solution that helps organizations measure, analyze, and optimize their key performance indicators (KPIs) in real time.
In this comprehensive article, you’ll learn what this dashboard is, how it works, its structure, features, advantages, and best practices — along with answers to common questions about using it effectively.
Click to Purchases Electronics & Semiconductors KPI Dashboard in Power BI
What Is an Electronics & Semiconductors KPI Dashboard in Power BI?
An Electronics & Semiconductors KPI Dashboard in Power BI is a data visualization and analytics tool built using Microsoft Power BI. It consolidates critical performance metrics from manufacturing, design, testing, logistics, and supply chain functions into one interactive view.
This dashboard empowers decision-makers to monitor progress toward goals, compare performance over time, and identify trends instantly. Whether you’re analyzing production efficiency, yield rate, downtime, or shipment performance, this Power BI dashboard helps convert raw data into actionable insights.
Click to Purchases Electronics & Semiconductors KPI Dashboard in Power BI
Why Power BI for the Electronics and Semiconductor Industry?
Power BI provides robust visualization and automation capabilities, making it ideal for a fast-paced, data-intensive industry like semiconductors. It enables leaders to:
-
Integrate data from multiple sources like ERP systems, MES (Manufacturing Execution Systems), and Excel.
-
Track KPIs dynamically through interactive charts and cards.
-
Automate data refreshes for up-to-date insights.
-
Drill down to specific production lines or device categories.
-
Compare Month-to-Date (MTD) and Year-to-Date (YTD) metrics in one dashboard.
With Power BI, businesses can reduce manual reporting time and gain a clear overview of performance across departments and regions.
Dashboard Structure Overview
The Electronics & Semiconductors KPI Dashboard in Power BI contains three interactive pages:
1️⃣ Summary Page
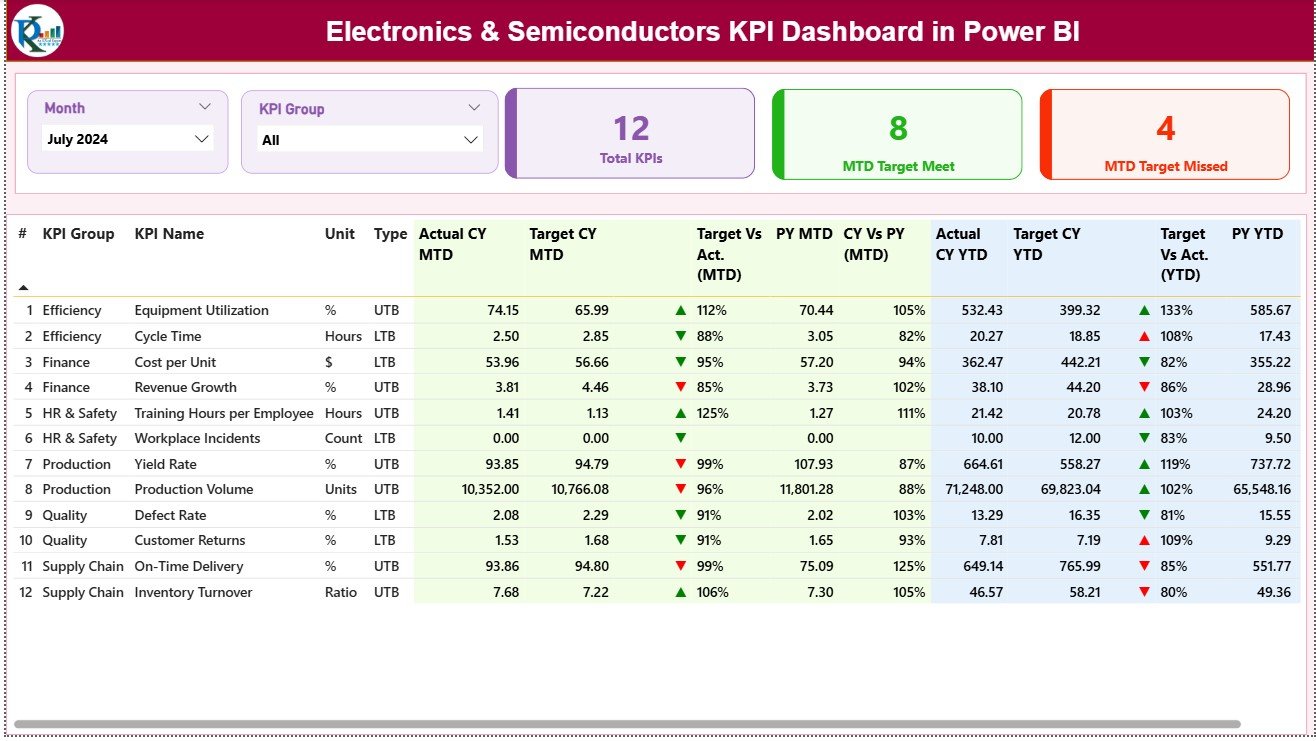
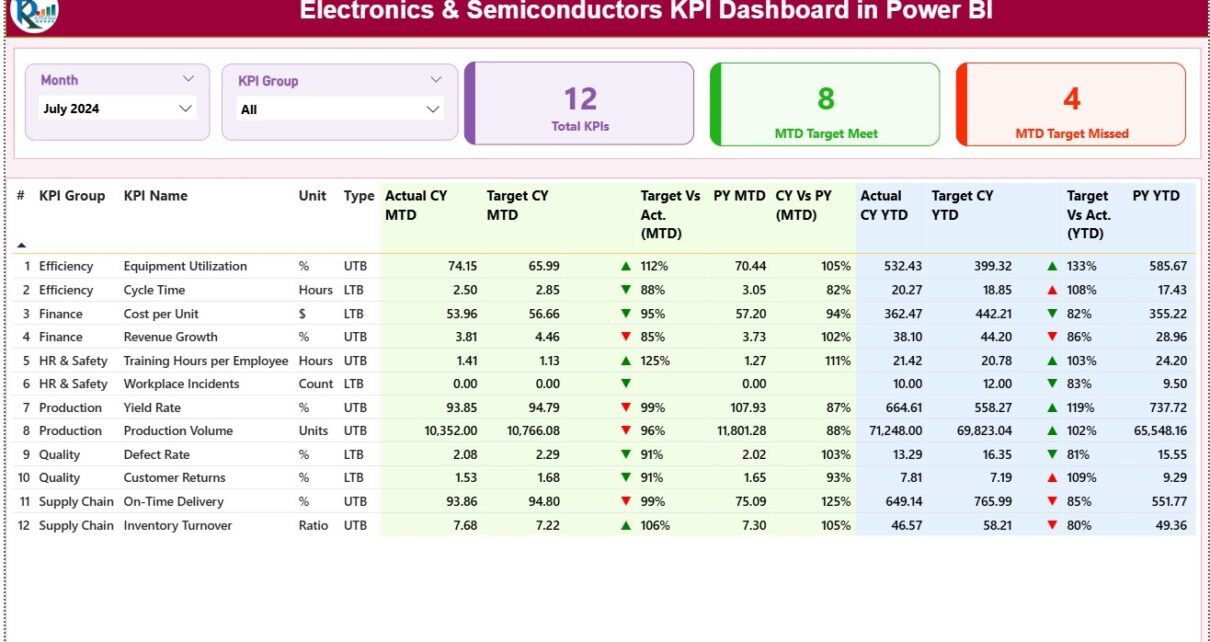
The Summary Page is the heart of the dashboard. It gives a holistic overview of all active KPIs. Users can filter the view using two slicers — Month and KPI Group — located at the top of the page.
Key Visual Components
-
Cards Section:
-
Total KPIs Count: Displays the number of KPIs being tracked.
-
MTD Target Met Count: Shows how many KPIs have achieved or exceeded their Month-to-Date targets.
-
MTD Target Missed Count: Displays the number of KPIs falling short of MTD goals.
-
-
Detailed KPI Table:
Below the summary cards, a structured table presents detailed KPI data with columns like:-
KPI Number: Sequential identifier.
-
KPI Group: Category of performance (e.g., Production, Quality, Supply Chain).
-
KPI Name: Metric being tracked.
-
Unit: Measurement unit (%, pcs, hrs, etc.).
-
Type: Indicator type — LTB (Lower The Better) or UTB (Upper The Better).
-
Actual CY MTD: Current Year Month-to-Date actual value.
-
Target CY MTD: Target value for the same period.
-
MTD Icon: Conditional arrow (▲ for improvement, ▼ for decline) in green or red, based on KPI performance.
-
Target vs Actual (MTD): Percentage ratio between actual and target values.
-
PY MTD: Previous Year Month-to-Date actual.
-
CY vs PY (MTD): Performance comparison between current and previous MTD.
-
Actual CY YTD: Year-to-Date actual value.
-
Target CY YTD: Year-to-Date target value.
-
YTD Icon: Visual indicator for YTD trend.
-
Target vs Actual (YTD): Comparison of actual vs target performance for the full year.
-
PY YTD: Previous year YTD actuals.
-
CY vs PY (YTD): Comparative growth or decline percentage between current and previous year.
-
Each section is fully dynamic, allowing users to filter by department, time period, or KPI type. The summary page acts as the command center for performance monitoring.
2️⃣ KPI Trend Page
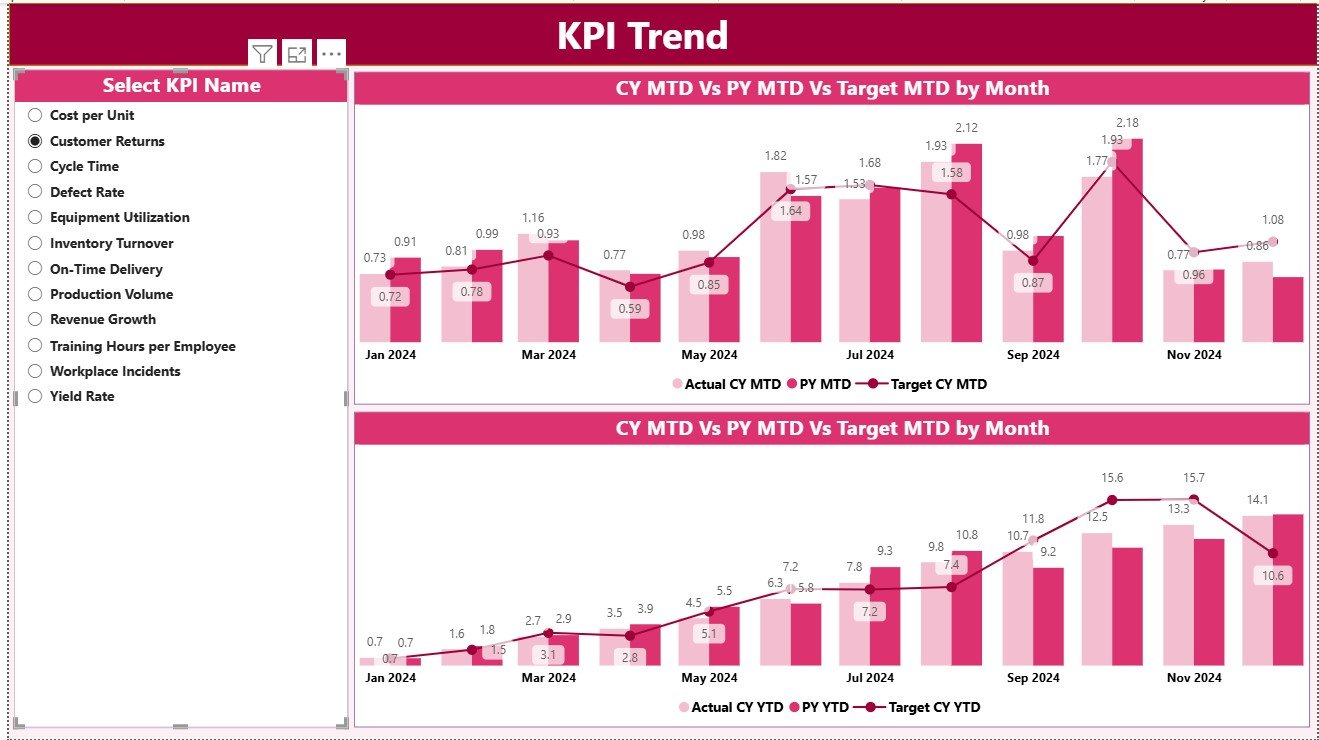
The KPI Trend Page helps analyze the behavior of specific KPIs over time.
Users can select a KPI name from the slicer on the left. The dashboard then updates to show two combination charts:
-
MTD Comparison Chart: Displays MTD actuals, previous year data, and targets side by side for each month.
-
YTD Comparison Chart: Highlights how the KPI has progressed year-to-date against the target and prior year.
These charts allow managers to identify whether performance is improving, stabilizing, or declining, and take proactive measures accordingly.
3️⃣ KPI Definition Page
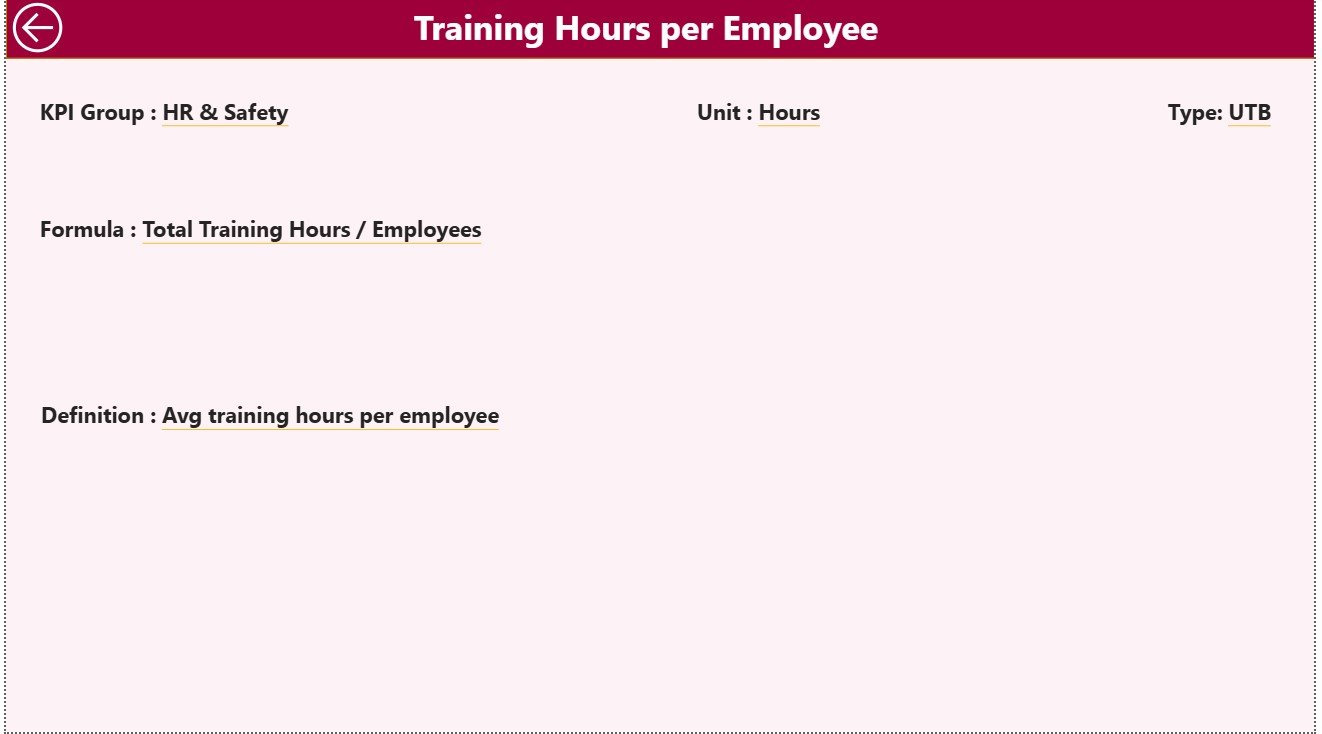
The KPI Definition Page is a drill-through view hidden from the main navigation. By right-clicking a KPI in the Summary Page and choosing “Drill Through,” users can view details like:
-
KPI Formula
-
KPI Definition
-
Measurement Type (UTB/LTB)
-
Related Metadata
This ensures complete transparency and helps new users understand how each KPI is calculated.
A Back Button in the top-left corner allows users to return easily to the main Summary Page.
Excel Data Integration
This dashboard is powered by an Excel data source structured into three worksheets. Each worksheet plays a vital role in maintaining clean and consistent data flow.
Click to Purchases Electronics & Semiconductors KPI Dashboard in Power BI
1️⃣ Input_Actual Sheet
This sheet contains:
-
KPI Name
-
Month (use the first date of the month, e.g., 1-Jan-2024)
-
MTD Actual Values
-
YTD Actual Values
It captures actual performance data directly from the operations or production reports.
2️⃣ Input_Target Sheet
This worksheet holds:
-
KPI Name
-
Month
-
MTD Target Values
-
YTD Target Values
This allows users to compare actual versus expected performance efficiently.
3️⃣ KPI Definition Sheet
This sheet defines the metadata for each KPI:
-
KPI Number
-
KPI Group
-
KPI Name
-
Unit
-
Formula
-
Definition
-
Type (LTB or UTB)
Having all definitions centralized ensures consistent calculation logic across the dashboard.
Key KPIs to Track in the Electronics & Semiconductor Industry
Some of the most common KPIs included in this dashboard are:
-
Production Yield Rate (%) – Measures output efficiency.
-
Defect Rate (%) – Tracks quality performance.
-
Cycle Time (hrs) – Assesses manufacturing speed.
-
Equipment Utilization (%) – Evaluates machinery usage.
-
On-Time Delivery (%) – Monitors logistics efficiency.
-
Material Scrap Rate (%) – Identifies waste in production.
-
Inventory Turnover Ratio – Reflects supply chain performance.
-
Customer Return Rate (%) – Measures after-sales quality.
-
Downtime Hours – Monitors equipment reliability.
-
Cost per Unit (USD) – Evaluates manufacturing cost efficiency.
Tracking these KPIs through Power BI helps leaders gain full visibility into operational, quality, and financial performance.
Click to Purchases Electronics & Semiconductors KPI Dashboard in Power BI
Advantages of Electronics & Semiconductors KPI Dashboard in Power BI
Implementing a Power BI dashboard offers numerous benefits across the organization:
1️⃣ Real-Time Decision-Making
Power BI connects directly to live data sources, enabling instant access to updated performance metrics. Managers can make data-driven decisions without waiting for manual reports.
2️⃣ End-to-End Visibility
The dashboard provides a unified view of performance from production to delivery. This transparency helps align cross-functional teams and detect issues early.
3️⃣ Data Accuracy and Standardization
Using predefined KPI definitions ensures uniform calculations across all departments, minimizing data discrepancies.
4️⃣ Improved Efficiency
Automated data refresh and visualization eliminate manual consolidation, saving hours of work for analysts and engineers.
5️⃣ Predictive Insights
By visualizing trends across time, businesses can forecast outcomes and plan maintenance or process adjustments proactively.
6️⃣ Customizable and Scalable
The dashboard can easily adapt to new KPIs, departments, or plants, making it a scalable solution as the company grows.
How to Use the Dashboard Effectively
To make the most of this tool, follow these steps:
-
Update Excel Data Regularly – Keep actual and target data fresh to ensure accuracy.
-
Use Filters Strategically – Slice data by KPI group, time, or location to find root causes.
-
Drill Down for Detail – Use the drill-through feature for deeper insight into underperforming KPIs.
-
Review Trends Monthly – Compare MTD and YTD data to detect consistent patterns.
-
Collaborate Across Teams – Share Power BI reports for cross-functional analysis and action planning.
Best Practices for the Electronics & Semiconductors KPI Dashboard
To maximize dashboard performance and ensure accurate insights, follow these best practices:
1️⃣ Maintain Data Quality
Always verify that Excel data is complete and error-free before refreshing Power BI. A single incorrect entry can distort your KPIs.
2️⃣ Use Consistent KPI Naming
Follow a standardized naming convention (e.g., “Yield Rate (%)” instead of “Yield %”) to keep reports uniform.
3️⃣ Keep Visuals Simple
Avoid cluttered visuals. Use a balance of tables, cards, and charts that clearly tell the story.
4️⃣ Refresh Data Automatically
Schedule automatic refreshes to keep reports updated without manual intervention.
5️⃣ Implement Security Roles
Restrict access based on user roles so that sensitive production or cost data remains protected.
6️⃣ Review KPI Definitions Quarterly
Ensure KPI formulas and definitions align with business goals, especially when introducing new product lines or technologies.
7️⃣ Focus on Actionable KPIs
Track only metrics that influence decision-making. Too many KPIs can distract from core performance drivers.
Conclusion
The Electronics & Semiconductors KPI Dashboard in Power BI is a game-changing tool for companies looking to strengthen performance management. By integrating operational, financial, and quality data into a single visual interface, it empowers leaders to act faster, detect inefficiencies, and enhance profitability.
From real-time monitoring to advanced analytics, this dashboard turns data into decisions. Whether you’re managing wafer production, assembly lines, or global logistics, Power BI offers the flexibility, transparency, and precision needed to stay ahead in a competitive industry.
Click to Purchases Electronics & Semiconductors KPI Dashboard in Power BI
Frequently Asked Questions (FAQs)
1️⃣ What is the main purpose of this KPI Dashboard?
It helps semiconductor and electronics companies monitor and analyze key performance indicators like production yield, equipment utilization, and defect rate to drive operational excellence.
2️⃣ Can I connect other data sources besides Excel?
Yes. Power BI supports multiple data sources including SQL databases, ERP systems, SharePoint, and cloud platforms like Azure or Google BigQuery.
3️⃣ How often should I update the data?
Ideally, update the Excel file or data source weekly or monthly, depending on how frequently you need performance insights.
4️⃣ What kind of visualizations are included?
The dashboard includes KPI cards, tables, combo charts, slicers, and conditional icons that visually represent performance status.
5️⃣ Can the dashboard handle multiple departments or plants?
Absolutely. The slicer and filter functionality allows you to analyze data by department, plant, or production line.
6️⃣ Is the dashboard customizable?
Yes. You can add, modify, or remove KPIs as per your business requirements without altering the overall structure.
7️⃣ Why use Power BI instead of Excel dashboards?
Power BI provides automation, interactivity, and real-time visuals that Excel alone cannot match. It also integrates multiple data sources for centralized reporting.
Click to Purchases Electronics & Semiconductors KPI Dashboard in Power BI
Visit our YouTube channel to learn step-by-step video tutorials