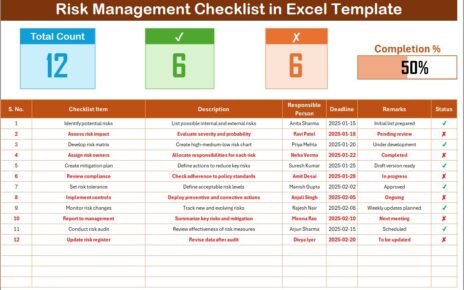
Managing employee benefits is one of the most essential yet complex responsibilities in any organization. From tracking health insurance and retirement plans to recording bonuses, paid leave, and wellness perks—every detail matters. An Employee Benefits Report in Excel offers an efficient, cost-effective, and customizable way to analyze, visualize, and manage all benefit-related data in one place.
This article provides a complete overview of what an Employee Benefits Report in Excel is, why it’s important, how to build one, and how it can help organizations make smarter HR and financial decisions.
Click to Purchases Employee Benefits Report in Excel
What Is an Employee Benefits Report in Excel?
An Employee Benefits Report in Excel is a structured document that summarizes all the benefits offered to employees by an organization. It helps HR teams and management track the value, usage, and cost of each benefit program and compare them against budgets and policies.
The report typically includes categories such as:
-
Health insurance and medical reimbursements
-
Paid time off (PTO) and leave utilization
-
Retirement contributions (e.g., provident fund, pension, 401k)
-
Performance bonuses and incentives
-
Training and wellness benefits
-
Stock options and employee rewards
By using Excel as the reporting platform, businesses can take advantage of powerful formulas, pivot tables, conditional formatting, and data visualization tools to create a dynamic and interactive employee benefits dashboard.
Why Use Excel for Employee Benefits Reporting?
Many organizations use HR management software for payroll and attendance, but Excel remains one of the most flexible tools for analysis and reporting. Here’s why:
✅ Flexibility — You can easily customize formulas, categories, and charts to match your company’s policies.
✅ Cost Efficiency — Excel doesn’t require expensive software licenses.
✅ Data Visualization — Pivot charts and conditional formatting make complex data easier to interpret.
✅ Quick Analysis — Excel formulas like SUMIFS, AVERAGEIFS, and VLOOKUP simplify aggregation and comparison.
✅ Automation with VBA — HR analysts can automate recurring reports and calculations using Excel macros.
Whether you’re a small business or a large enterprise, Excel offers the perfect balance between simplicity and analytical power.
Key Components of an Employee Benefits Report
A well-designed Employee Benefits Report in Excel generally includes multiple sections or worksheet tabs. Below is a breakdown of what each sheet might contain:
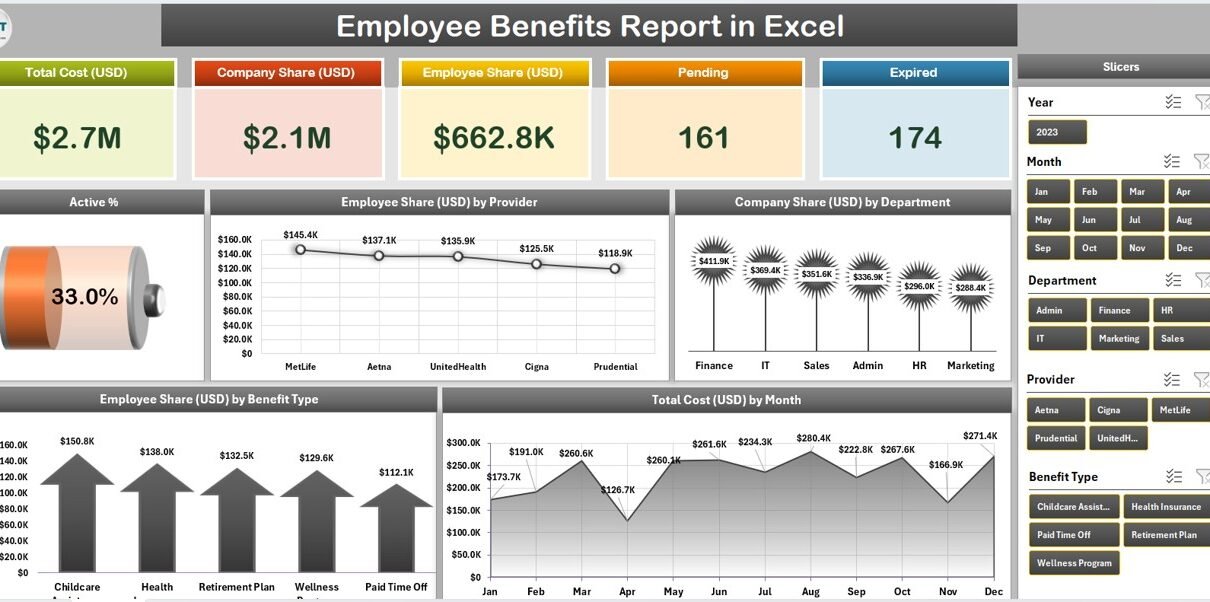
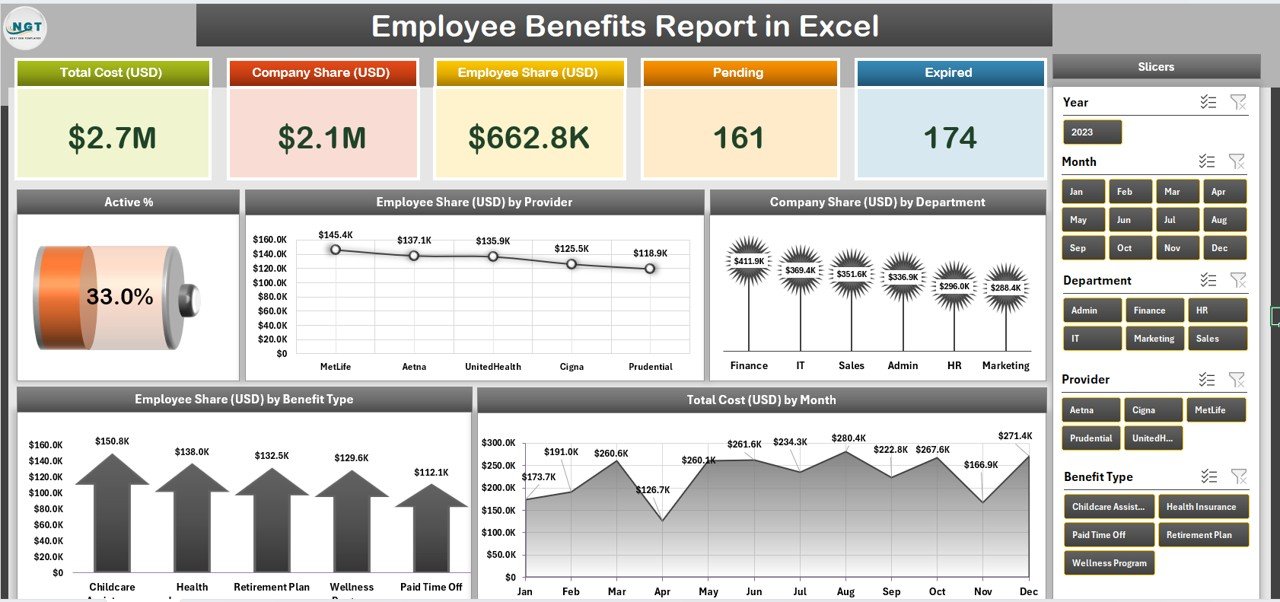
1️⃣ Home or Dashboard Page
-
Displays key summary metrics such as total benefits cost, average benefit per employee, and benefit utilization percentage.
-
Includes visual charts showing cost distribution by benefit type.
-
May contain slicers for filtering by department, location, or employment type.
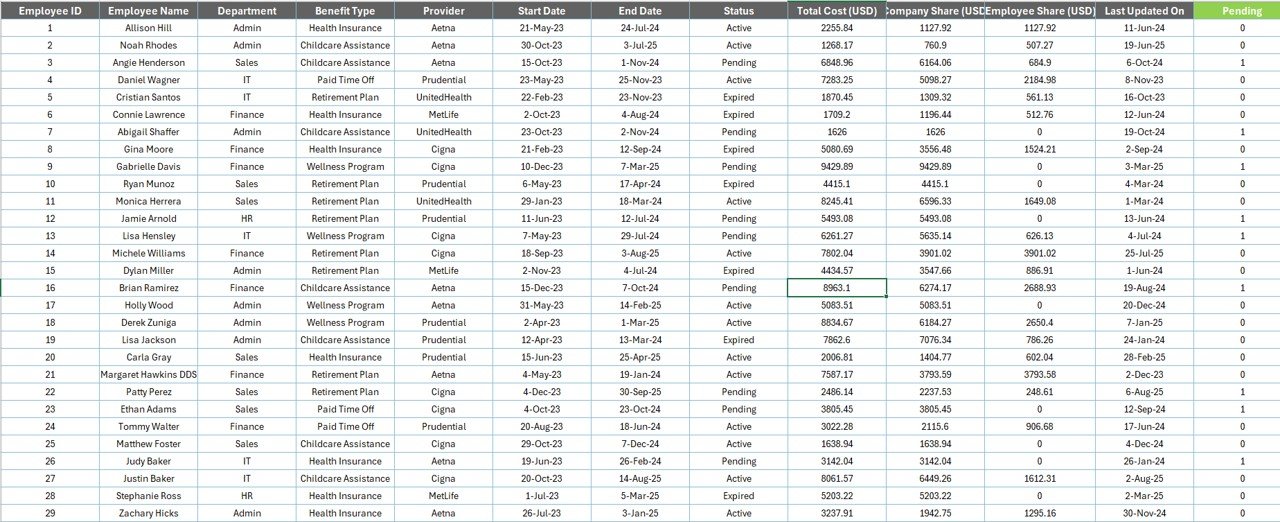
2️⃣ Employee Data Sheet
-
Contains employee details like Employee ID, Name, Department, Designation, Joining Date, and Employment Status.
-
Acts as a reference for lookup formulas.
3️⃣ Benefit Details Sheet
-
Lists all benefit categories (e.g., Medical Insurance, Bonus, Pension) with cost per employee and company contribution.
-
May include formula-based columns for YTD (Year-to-Date) totals and utilization ratios.
4️⃣ Benefit Utilization Sheet
-
Tracks how many employees availed specific benefits and the associated costs.
-
Useful for identifying underused or highly valued benefits.
5️⃣ Departmental Summary
-
Shows aggregated data for each department, including total cost and average benefits per employee.
-
Ideal for cross-departmental comparisons.
6️⃣ Charts and KPI Summary
Contains visual insights such as:
- Benefits cost trend over months
- Utilization rate by benefit category
- Total cost per department
- Employee satisfaction vs. benefit cost
This structure ensures data consistency and provides multiple analytical perspectives for HR and management.
What Type of Analysis Can Be Done Using the Report?
Excel makes it easy to analyze employee benefits data across multiple dimensions. Here are a few examples:
🔹 Cost Analysis
-
Compare total and average benefit costs per employee, department, or benefit type.
-
Identify cost-saving opportunities by tracking unused benefits.
🔹 Utilization Analysis
-
Measure how often employees use specific benefits.
-
Highlight underutilized programs that could be redesigned for better engagement.
🔹 Trend Analysis
-
Track benefit spending trends month-over-month or year-over-year.
-
Detect seasonal or policy-driven variations.
🔹 Benchmarking
-
Compare benefit offerings against industry averages or internal targets.
-
Use performance charts to visualize areas that need improvement.
🔹 Predictive Analysis
-
Estimate future costs using trendlines and regression formulas.
-
Forecast employee satisfaction improvements based on benefit adjustments.
With dynamic pivot tables and charts, you can turn raw data into actionable insights for decision-making.
How to Create an Employee Benefits Report in Excel
You can build this report using the following step-by-step method:
Step 1: Prepare the Employee Data
Create a base table with employee information such as ID, Name, Department, and Designation.
Step 2: Define Benefit Categories
Add another table listing all benefits—medical, insurance, pension, bonus, training, etc.
Step 3: Enter Benefit Data
Record monthly or quarterly data for each employee. Include columns for:
Click to Purchases Employee Benefits Report in Excel
-
Benefit Type
-
Benefit Amount
-
Employee Contribution
-
Employer Contribution
-
Month or Period
Step 4: Use Excel Formulas
Use formulas like:
-
SUMIFS()to total costs by employee or department -
VLOOKUP()orXLOOKUP()to reference employee details -
IF()to check eligibility conditions -
AVERAGEIFS()for benefit averages
Step 5: Create Pivot Tables
Generate pivot tables for cost and utilization by department, benefit type, and time period.
Step 6: Add Conditional Formatting
Use color scales and data bars to visually represent costs, utilization, or satisfaction levels.
Step 7: Insert Charts and KPIs
Add bar charts, pie charts, and line charts to display key trends and ratios.
Step 8: Automate with Slicers and Filters
Use slicers for department or benefit selection to make the dashboard interactive.
This method allows you to design a clean and functional benefits report that’s ready for presentation.
Advantages of Employee Benefits Report in Excel
An Employee Benefits Report in Excel provides several advantages for HR teams, managers, and business owners:
🎯 1. Better Decision-Making
Visual insights help identify which benefits are most effective and where budget adjustments are needed.
💰 2. Cost Optimization
By tracking underutilized benefits, companies can redistribute funds to high-value programs.
🧠 3. Improved Employee Satisfaction
Transparency builds trust. Employees appreciate knowing the true value of their benefits.
📅 4. Enhanced Planning and Forecasting
Yearly and monthly reports help predict future expenses and benefit participation rates.
🧾 5. Audit and Compliance Readiness
Accurate reports ensure companies stay compliant with labor laws and corporate governance policies.
🔍 6. Easy Customization and Scalability
Excel templates can be easily modified for growing organizations and changing HR policies.
Best Practices for the Employee Benefits Report in Excel
To ensure maximum value and accuracy, follow these best practices:
✅ 1. Maintain Data Consistency
Use standardized codes for benefit types, departments, and employee IDs to avoid duplicate entries.
✅ 2. Update Regularly
Keep your report updated monthly or quarterly to ensure decisions are based on fresh data.
✅ 3. Protect Sensitive Data
Use password protection, restricted sheets, and limited access to safeguard employee information.
✅ 4. Automate Calculations
Leverage Excel’s automation tools like macros and data validation to reduce manual errors.
✅ 5. Use Visual Dashboards
Include pivot charts, KPIs, and trend lines to make your report easy to interpret.
✅ 6. Integrate with Other HR Systems
If possible, link your Excel report with HR databases or payroll tools using Power Query for seamless updates.
✅ 7. Document Assumptions
Maintain a separate notes sheet listing formulas, data sources, and assumptions for transparency.
These practices make your Excel-based Employee Benefits Report reliable, secure, and easy to present.
💼 Use Cases of an Employee Benefits Report in Excel
Here are practical scenarios where organizations can apply this report:
-
Annual Benefits Review: Evaluate total benefit spending and usage trends before budget revisions.
-
Employee Appraisals: Provide detailed summaries of benefit utilization per employee.
-
Departmental Reporting: Compare benefit distribution across business units.
-
Cost Analysis for CFOs: Identify savings opportunities in benefit programs.
-
Wellness Program Monitoring: Track participation and effectiveness of fitness or mental health programs.
These applications demonstrate how Excel reports can serve both HR and finance departments effectively.
Example Layout of the Excel Report
Your Excel file can include:
-
Home Dashboard – Displays KPIs and charts.
-
Employee Master Data – Employee list and demographics.
-
Benefits Transactions – Raw data on benefit amounts and usage.
-
Department Summary – Cost and usage by department.
-
Trend View – Month-over-month or year-over-year analysis.
-
KPI Definitions – Explains calculation logic for clarity.
This structured layout helps you maintain consistency and ease of navigation.
Conclusion
An Employee Benefits Report in Excel is more than just a spreadsheet—it’s a strategic tool for improving employee engagement, optimizing costs, and maintaining transparency. By combining data management, analysis, and visualization, this report empowers HR leaders and executives to make smarter, faster, and more informed decisions.
Whether you manage 50 employees or 5,000, a well-designed Excel report can help your organization monitor benefits, improve satisfaction, and plan for long-term success.
Frequently Asked Questions (FAQs)
1️⃣ What is the purpose of an Employee Benefits Report?
It helps organizations track and analyze all employee benefits—insurance, bonuses, leave, and more—to improve transparency and efficiency.
2️⃣ Can small businesses use Excel for benefits tracking?
Yes! Excel is ideal for small and mid-sized businesses due to its flexibility, low cost, and ease of customization.
3️⃣ What types of charts can I use in the report?
You can use bar charts for cost comparisons, pie charts for distribution analysis, and line charts for trends.
4️⃣ How often should I update the report?
Monthly or quarterly updates are best to ensure data accuracy and timely decision-making.
5️⃣ Can I automate the Employee Benefits Report in Excel?
Yes, you can automate data entry and calculations using formulas, Power Query, or VBA macros.
6️⃣ What are the most important KPIs in an Employee Benefits Report?
Total cost, average cost per employee, utilization rate, and satisfaction score are among the top KPIs.
7️⃣ How can this report improve employee engagement?
By showing employees the real value of their benefits and aligning programs with their needs, engagement increases naturally.
Visit our YouTube channel to learn step-by-step video tutorials