In today’s competitive business environment, workforce diversity is no longer optional. Instead, it has become a strategic priority for organizations that want innovation, inclusion, productivity, and long-term growth. However, many HR teams still struggle to track diversity metrics clearly because scattered data, manual reports, and static spreadsheets slow them down.
That is exactly why an Employee Diversity Dashboard in Excel plays a vital role.
An Employee Diversity Dashboard in Excel gives HR leaders, managers, and executives a centralized, visual, and data-driven way to monitor employee diversity and workforce composition. Moreover, it converts raw employee data into easy-to-understand KPIs, charts, and trends inside Excel—without requiring Power BI or complex tools.
In this detailed article, you will learn what an Employee Diversity Dashboard in Excel is, how it works, what sheets it includes, why it matters, and how organizations can use it to improve diversity decisions. Additionally, you will explore its advantages, best practices, and frequently asked questions.
Click to buy Employee Diversity Dashboard in Excel
What Is an Employee Diversity Dashboard in Excel?
An Employee Diversity Dashboard in Excel is a ready-to-use analytical tool designed to monitor and analyze workforce diversity metrics in a structured and visual format. It captures employee-related data such as gender, department, region, job level, education, nationality, performance rating, salary, and bonuses. Then, it presents that data through dashboards, charts, KPIs, and monthly trends.
Because the dashboard runs in Excel, HR teams can easily update data, apply filters, and analyze results without learning new software. Furthermore, decision-makers can track diversity in real time and identify gaps faster.
Why Do Organizations Need an Employee Diversity Dashboard?
Organizations manage hundreds or thousands of employees across departments, regions, and job levels. As a result, diversity insights often remain hidden in static HR reports. However, when leaders lack visibility, they cannot take meaningful action.
An Employee Diversity Dashboard in Excel solves this problem because it:
- Centralizes all workforce diversity data
- Highlights key HR KPIs visually
- Tracks inclusion and representation trends
- Supports compliance and reporting needs
- Enables data-driven diversity initiatives
Therefore, companies no longer rely on assumptions. Instead, they use facts and trends to guide decisions.
What Are the Key Sheets in an Employee Diversity Dashboard in Excel?
This ready-to-use Employee Diversity Dashboard in Excel contains multiple sheet tabs. Each sheet focuses on a specific level of analysis and provides valuable insights. Let us explore each sheet in detail.
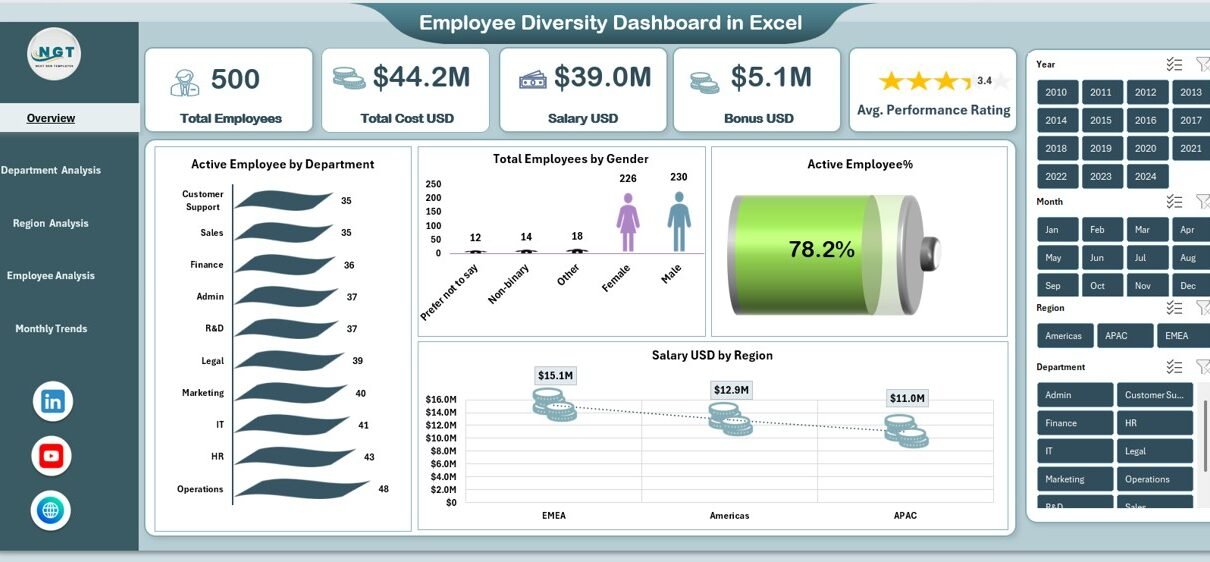
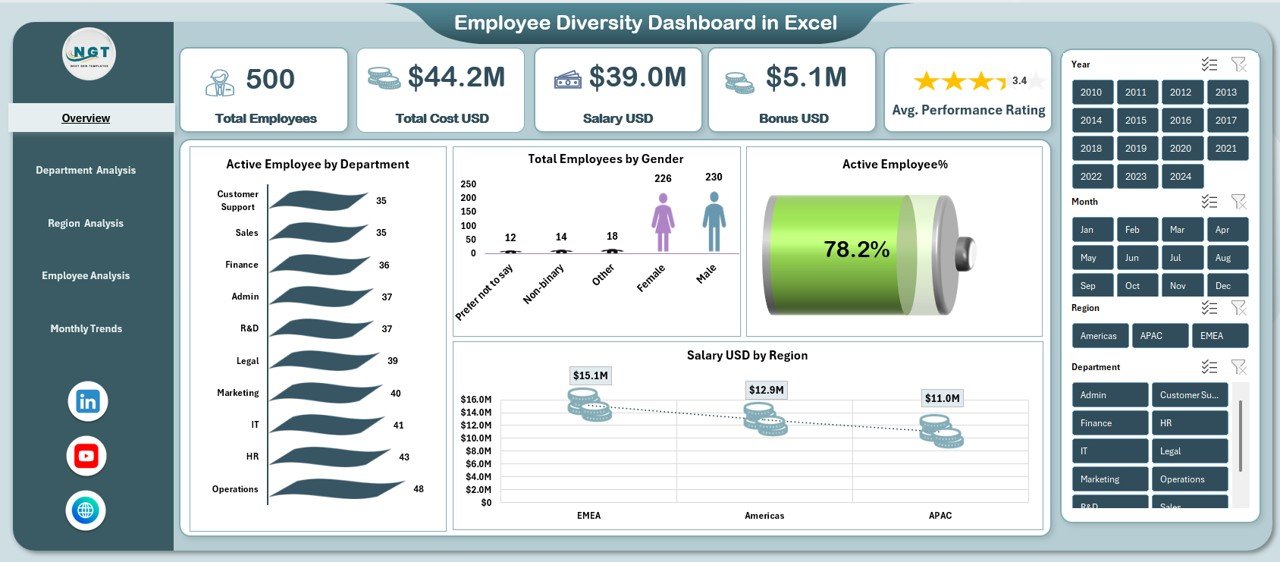
Overview Sheet
The Overview Sheet Tab serves as the main control panel of the Employee Diversity Dashboard in Excel. It summarizes workforce data and highlights the most critical diversity KPIs at a glance.
Key Metrics on the Overview Sheet
- Total Employees
Shows the total number of employees in the organization. This metric establishes the workforce base for diversity analysis. - Total Cost USD
Displays the complete employee-related cost, including salary and bonuses. - Salary USD
Tracks total salary expenses across the organization. - Bonus USD
Highlights total bonus payouts, helping HR evaluate reward distribution. - Average Performance Rating
Shows average performance across employees, which supports fair evaluation analysis.
Click to buy Employee Diversity Dashboard in Excel
Visual Insights on the Overview Sheet
- Active Employees by Department
Displays how employees spread across departments. - Total Employees by Gender
Illustrates gender diversity across the organization. - Active Employee Percentage
Shows the percentage of employees currently active. - Salary USD by Region
Highlights salary distribution across geographic regions.
Because this page summarizes everything, leadership teams can quickly assess workforce diversity health without reviewing multiple reports.
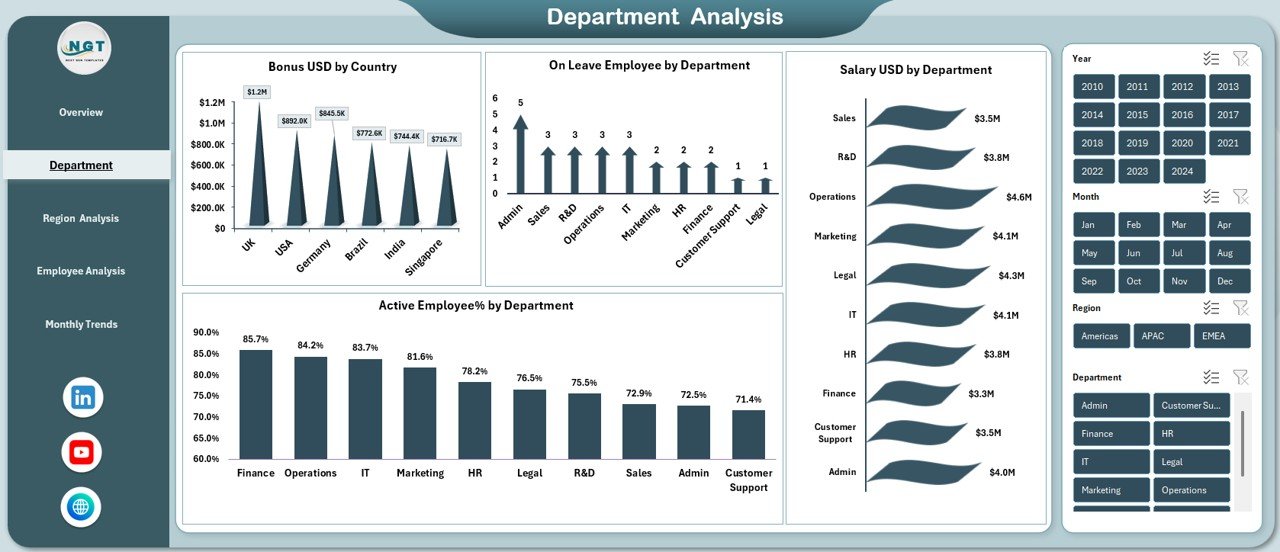
Department Analysis Sheet
The Department Analysis Sheet allows HR professionals to drill deeper into workforce diversity at the department level. This sheet supports fair workforce planning and internal benchmarking.
Key Charts and Metrics in Department Analysis
- Bonus USD by Country
Shows how bonus payouts vary by country, which helps evaluate reward fairness. - Active Employee Percentage by Department
Tracks engagement and retention by department. - On Leave Employees by Department
Identifies departments with higher leave patterns. - Salary USD by Department
Compares salary costs across departments for budget planning.
Through this analysis, HR teams can connect diversity indicators with compensation, performance, and engagement at a departmental level.
Click to buy Employee Diversity Dashboard in Excel
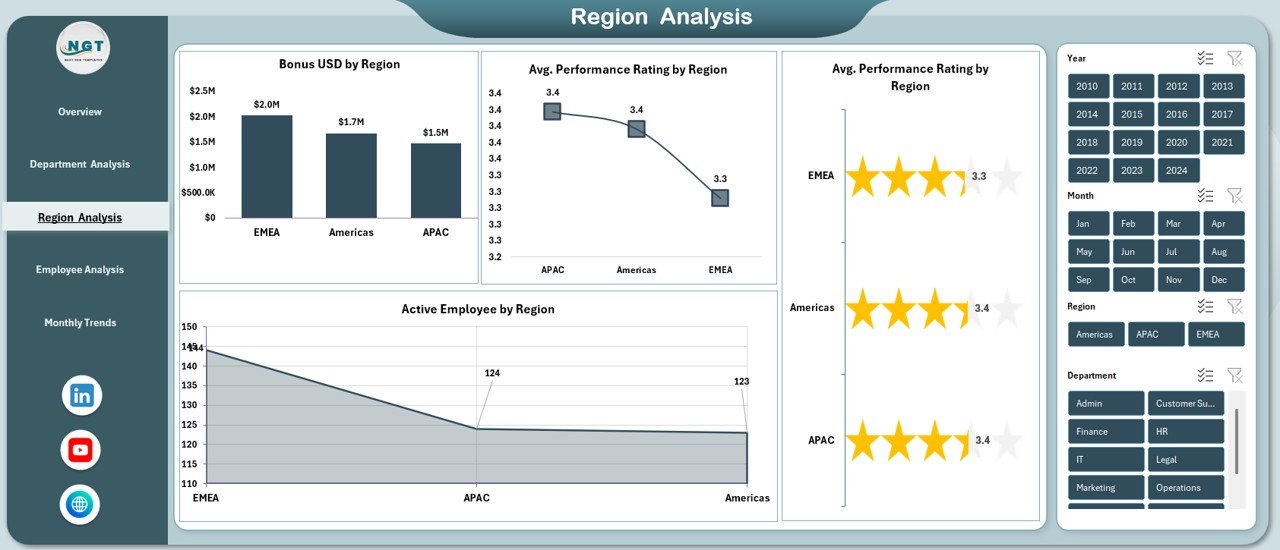
Region Analysis
The Region Analysis Sheet focuses on workforce diversity by geography. This view helps multinational companies identify regional workforce imbalance and cost patterns.
Key Metrics in Region Analysis
- Bonus USD by Region
Highlights regional differences in bonus allocation. - Active Employees by Region
Shows workforce distribution across locations. - Average Performance Rating by Region
Helps compare productivity and performance trends by region.
With this sheet, HR managers can align regional strategies, improve engagement, and ensure consistency across locations.
Click to buy Employee Diversity Dashboard in Excel
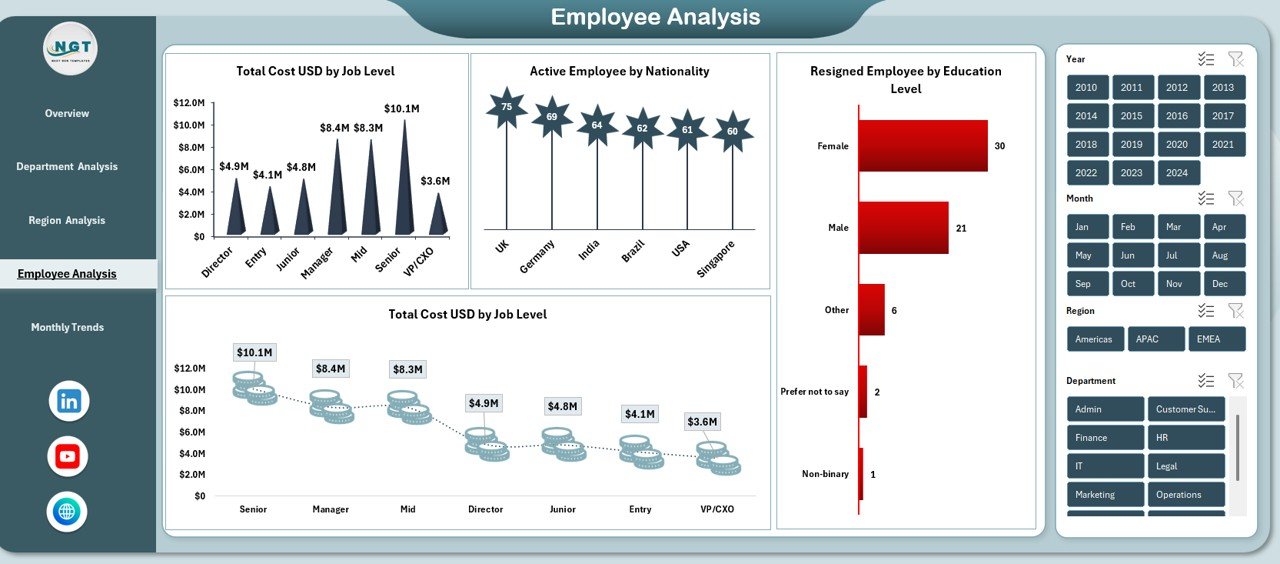
Employee Analysis Sheet
The Employee Analysis Sheet dives deeper into individual-level diversity dimensions such as job level, nationality, and education.
Key Insights in Employee Analysis
- Total Cost USD by Job Level
Helps identify compensation equity across job levels. - Active Employees by Nationality
Shows cultural and nationality diversity in the workforce. - Resigned Employees by Education Level
Highlights attrition trends related to education background.
This page supports workforce planning, retention strategy design, and inclusion initiatives.
Click to buy Employee Diversity Dashboard in Excel
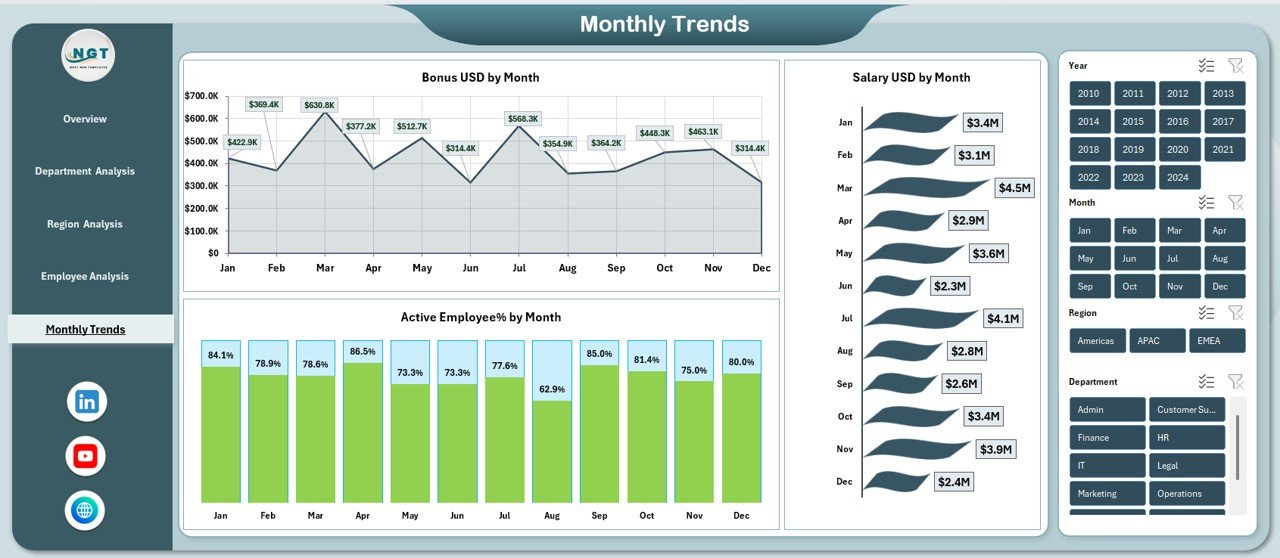
Monthly Trend Sheets
Diversity metrics change over time. Therefore, tracking monthly trends becomes essential. The Monthly Trends Sheet captures time-based performance and diversity patterns.
Monthly Trend Metrics
- Bonus USD by Month
Helps identify seasonality in bonuses. - Active Employee Percentage by Month
Tracks engagement trends across the year. - Salary USD by Month
Supports monthly payroll and cost analysis.
These monthly insights help HR teams forecast, plan budgets, and monitor diversity initiatives consistently.
Click to buy Employee Diversity Dashboard in Excel
How Does an Employee Diversity Dashboard in Excel Improve Decision-Making?
An Employee Diversity Dashboard in Excel improves decision-making because it:
- Converts data into actionable insights
- Reduces manual reporting effort
- Enables drill-down analysis
- Improves transparency and accountability
- Supports data-backed inclusion policies
As a result, leadership teams trust the data and act confidently.
Advantages of Employee Diversity Dashboard in Excel
An Employee Diversity Dashboard in Excel offers several strategic and operational advantages for organizations of all sizes.
Centralized Workforce Visibility
All diversity data stays in one place, which avoids confusion and duplication.
No Advanced Tools Required
Because the dashboard runs in Excel, teams avoid complex BI tools and training costs.
Real-Time Analysis
Users can update data and instantly see refreshed insights.
Clear Diversity Metrics
Visual charts make gender, nationality, and department diversity easy to understand.
Better Compliance Support
HR teams can respond quickly to regulatory or audit requests.
Improved Strategic Planning
Leaders can align diversity goals with business strategy.
Best Practices for the Employee Diversity Dashboard in Excel
To get maximum value, organizations should follow best practices while using an Employee Diversity Dashboard in Excel.
Maintain Clean and Accurate Data
Always validate employee data before updating the dashboard.
Update Data Regularly
Monthly or quarterly updates help maintain relevance.
Define Clear KPIs
Standardize definitions for metrics such as active employees and performance rating.
Use Filters and Slicers Wisely
Filters improve drill-down analysis without duplicating reports.
Align Dashboard with HR Goals
Customize metrics based on engagement, inclusion, and retention priorities.
Ensure Data Privacy
Protect sensitive employee information using access controls.
How Can HR Teams Use This Dashboard for Diversity Improvement?
HR teams can use the Employee Diversity Dashboard in Excel to:
- Track gender and nationality representation
- Identify departments with higher attrition
- Monitor compensation equity
- Design targeted inclusion programs
- Measure the impact of diversity initiatives
With consistent use, the dashboard becomes a strategic HR companion.
Conclusion: Why Should You Use an Employee Diversity Dashboard in Excel?
An Employee Diversity Dashboard in Excel transforms workforce data into meaningful insights. Instead of relying on static HR reports, organizations gain a dynamic, visual, and actionable view of diversity metrics. Moreover, the dashboard improves transparency, promotes fairness, and supports data-driven people strategies.
Because it runs completely in Excel, teams can adopt it quickly without technical barriers. Ultimately, this dashboard helps organizations build inclusive, balanced, and high-performing workplaces.
Frequently Asked Questions About Employee Diversity Dashboard in Excel
What is an Employee Diversity Dashboard in Excel used for?
It helps organizations track and analyze workforce diversity metrics such as gender, region, department, job level, and performance.
Can small businesses use this dashboard?
Yes, small and mid-sized businesses can use it effectively because it runs in Excel.
Does this dashboard require Power BI?
No, the dashboard works entirely within Excel.
How often should HR teams update the dashboard?
Most organizations update it monthly or quarterly for accurate insights.
Can this dashboard help with compliance reporting?
Yes, it simplifies diversity reporting for audits and regulations.
Is the dashboard customizable?
Yes, users can modify metrics, charts, and layouts based on HR needs.
Visit our YouTube channel to learn step-by-step video tutorials
Watch the step-by-step video tutorial:
Click to buy Employee Diversity Dashboard in Excel