In today’s fast-paced business environment, tracking employee performance is essential for organizational growth. Having a system in place that helps managers and HR teams assess and review employee progress can boost overall productivity and employee satisfaction. One such powerful tool is the Employee Performance Review Dashboard in Excel.
This ready-to-use template consolidates key performance metrics, making it easy to monitor performance trends across various departments and positions. In this article, we will explore the features, benefits, and best practices for using the Employee Performance Review Dashboard in Excel, ensuring it delivers maximum value to your organization.
Table of Contents
ToggleClick to Purchases Employee Performance Review Dashboard in Excel
What Is an Employee Performance Review Dashboard?
An Employee Performance Review Dashboard in Excel is a data visualization tool that helps track and evaluate employees’ performance over time. The dashboard provides a comprehensive overview of individual, departmental, and organizational performance metrics, allowing managers to make data-driven decisions and provide meaningful feedback to employees.
This dashboard simplifies complex performance data by presenting it in an easy-to-understand format, making it accessible to managers, HR teams, and other stakeholders who need to monitor and assess employee performance regularly.
Key Features of the Employee Performance Review Dashboard
This Excel-based dashboard is designed to give you a complete picture of your organization’s employee performance. Here are its key features:
Page Navigator
Located at the top of the dashboard, the Page Navigator provides easy access to different analytical pages. This navigation tool allows users to move seamlessly between various sections without having to manually scroll or search for specific data.
Click to Purchases Employee Performance Review Dashboard in Excel
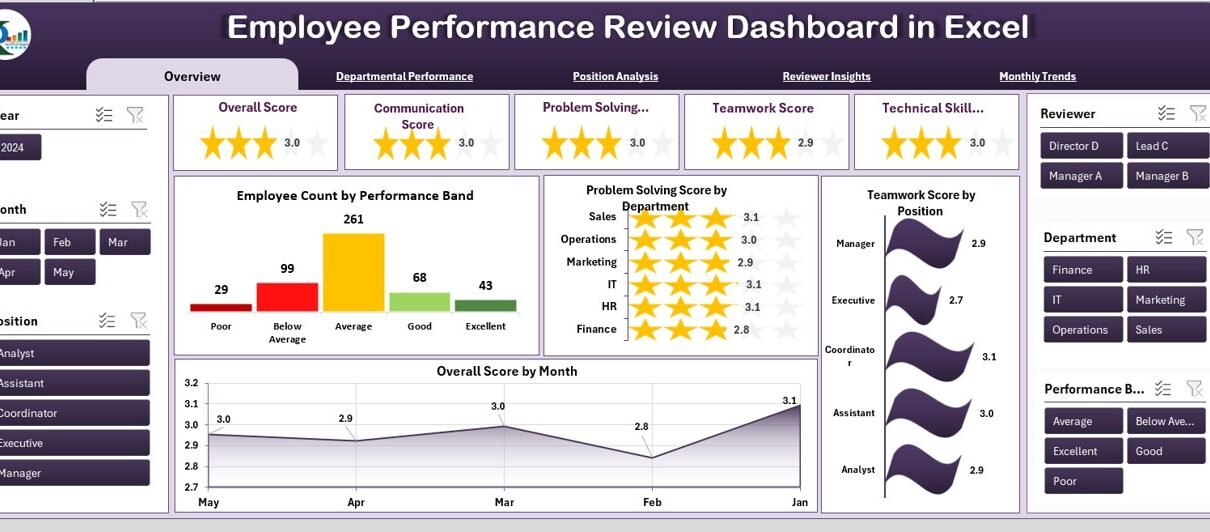
Overview Page
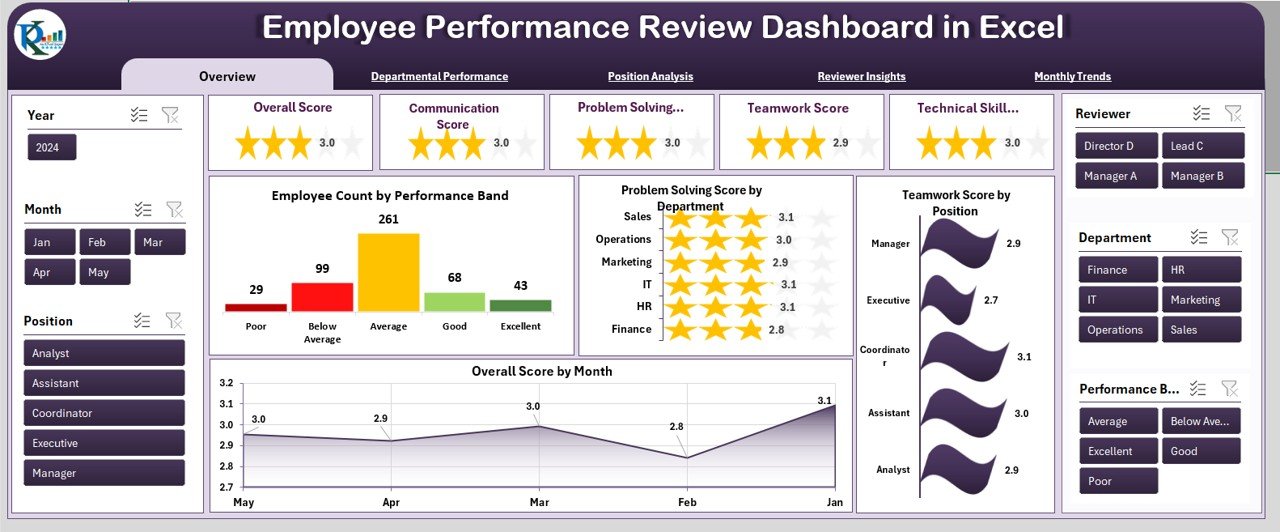
The Overview Page is the main dashboard page that provides a high-level snapshot of performance metrics. It features the following key charts:
-
Employee Count by Performance Band: Displays the number of employees in each performance band (e.g., Excellent, Good, Needs Improvement).
-
Problem Solving Score by Department: Shows the average problem-solving scores across different departments.
-
Teamwork Score by Position: Highlights how different positions perform in terms of teamwork.
-
Overall Score by Month: Tracks employees’ overall performance scores over several months.
This page serves as the go-to section for anyone looking to quickly assess the performance status of employees.
Departmental Performance
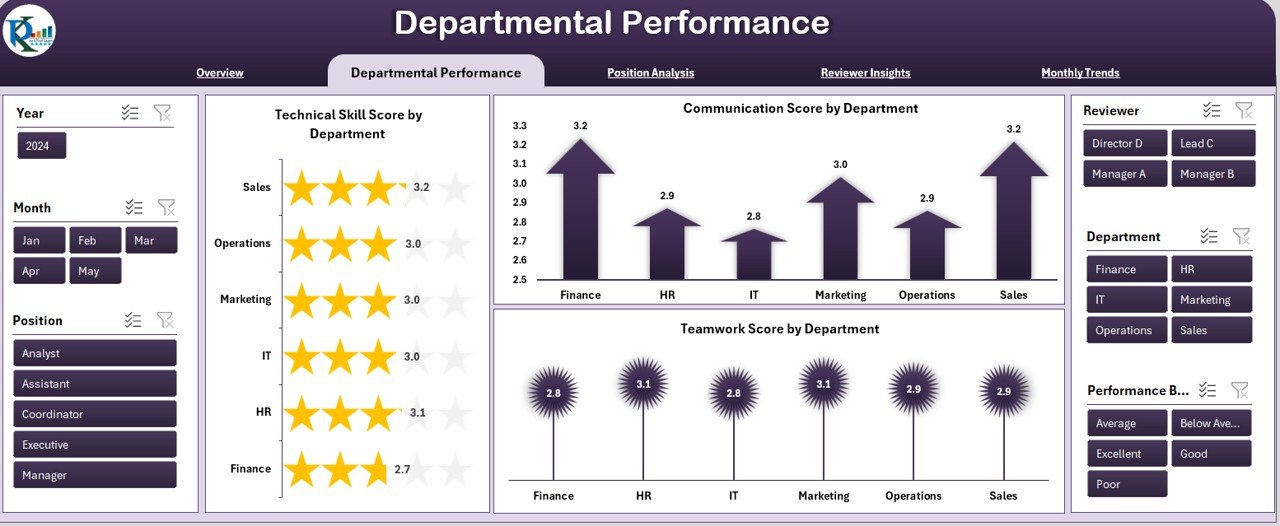
The Departmental Performance page allows managers to drill down into performance data by department. The charts available on this page include:
-
Technical Skill Score by Department: Measures the technical proficiency of employees in each department.
-
Communication Score by Department: Tracks communication skills across departments.
-
Teamwork Score by Department: Analyzes teamwork effectiveness within each department.
This page is ideal for department heads and HR managers who need to monitor department-specific trends and identify areas of improvement.
Position Analysis
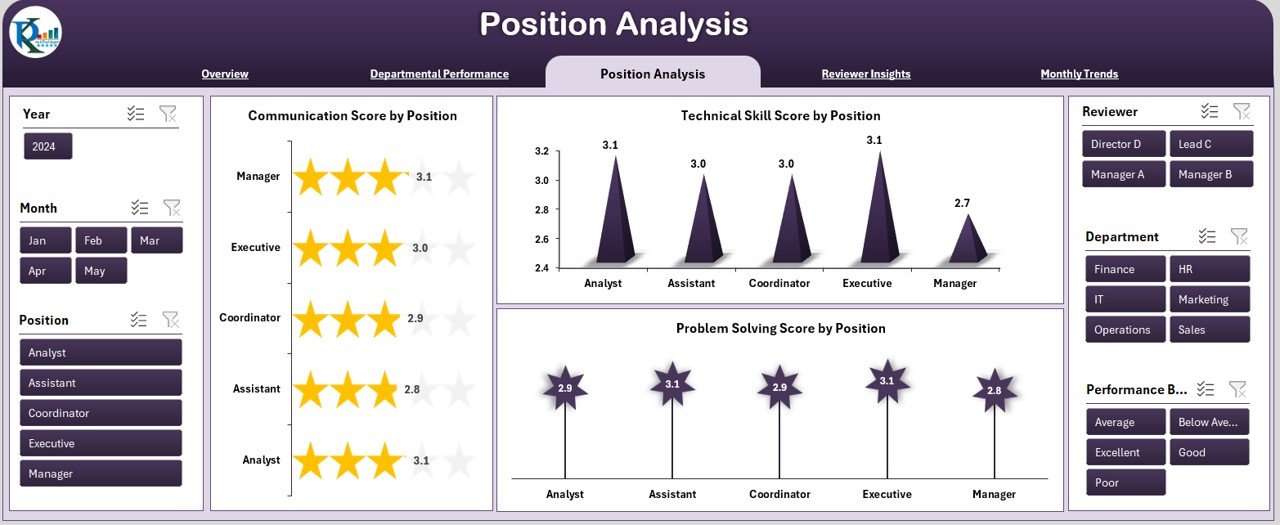
This section of the dashboard focuses on individual positions within the organization, with charts such as:
-
Communication Score by Position: Evaluates how well employees communicate based on their roles.
-
Technical Skill Score by Position: Assesses technical skills per job position.
-
Problem-Solving Score by Position: Measures problem-solving abilities across different positions.
By reviewing performance data for each position, this page helps leaders ensure that role-specific expectations are being met.
Reviewer Insights
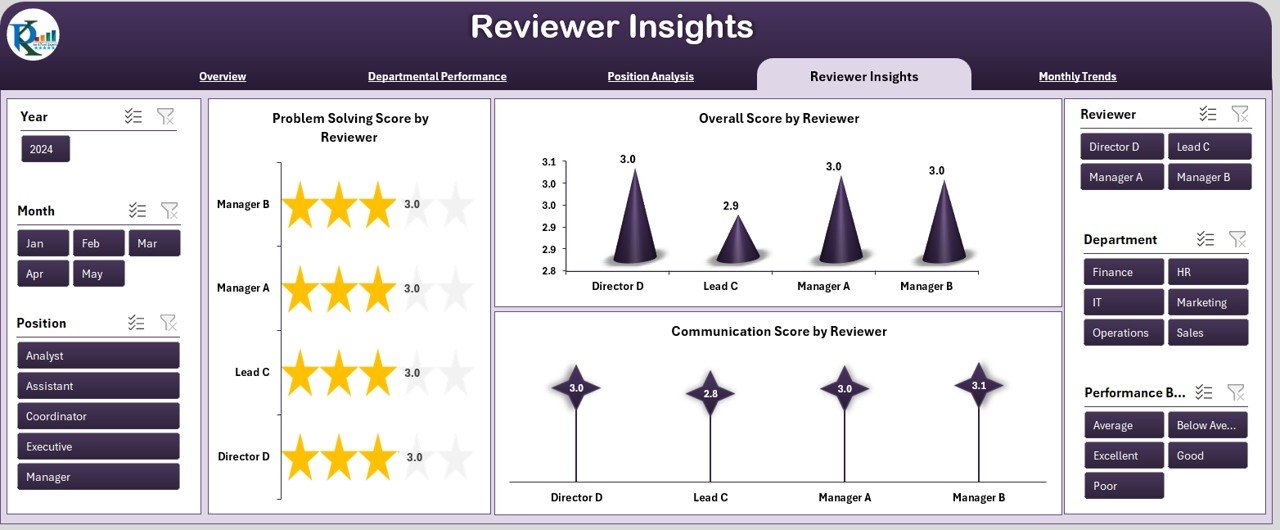
The Reviewer Insights page provides valuable feedback from individual reviewers. It includes:
-
Problem-Solving Score by Reviewer: Helps identify how each reviewer rates problem-solving capabilities.
-
Overall Score by Reviewer: Displays the average score given by each reviewer.
-
Communication Score by Reviewer: Tracks how reviewers rate employees’ communication skills.
This page is valuable for managers who want to evaluate the effectiveness and consistency of different reviewers.
Monthly Trends
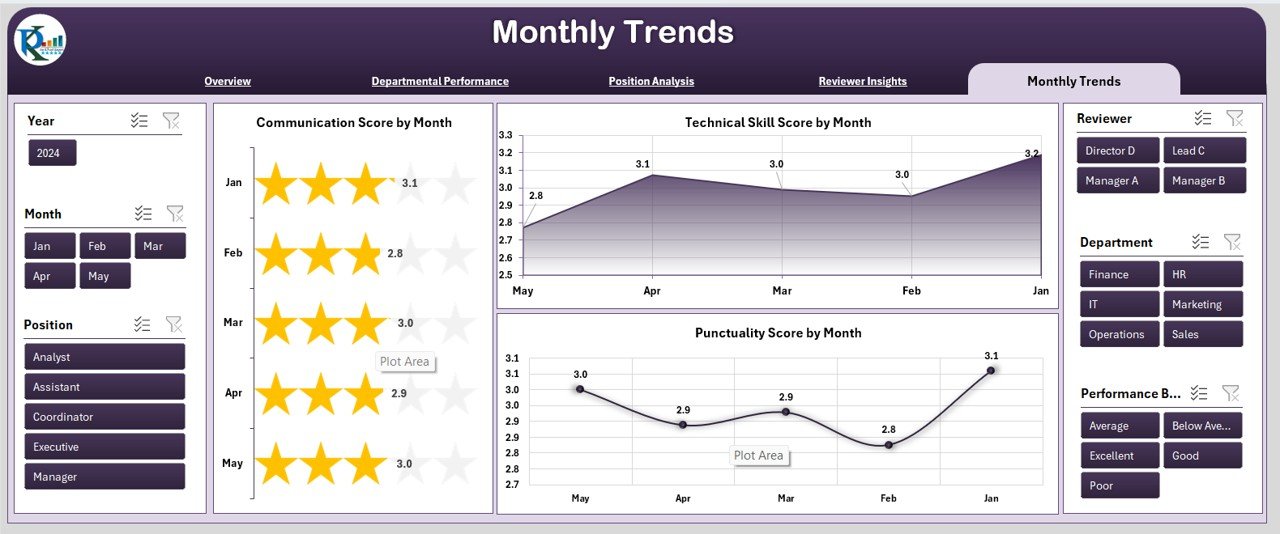
The Monthly Trends page helps visualize performance over time. It includes charts like:
-
Communication Score by Month: Tracks how employees’ communication skills evolve month by month.
-
Technical Skill Score by Month: Monitors the development of technical skills over time.
-
Punctuality Score by Month: Shows how employees’ punctuality changes each month.
This feature helps HR and management teams identify long-term trends and patterns in employee performance.
Advantages of Using an Employee Performance Review Dashboard
Click to Purchases Employee Performance Review Dashboard in Excel
The Employee Performance Review Dashboard in Excel offers numerous benefits for organizations. Here are some key advantages:
1. Improved Decision Making
Having performance data visualized in one place enables decision-makers to make quick, informed choices. The dashboard allows managers to identify areas of improvement, recognize top performers, and implement targeted development plans.
2. Time Efficiency
With all data in one dashboard, HR and management teams can save time that would otherwise be spent generating separate reports. This streamlined process allows leaders to focus more on action and less on administrative tasks.
3. Better Employee Engagement
Providing employees with clear feedback on their performance, including both strengths and areas for improvement, fosters a more engaged workforce. Employees are more likely to take ownership of their development when they see regular, structured feedback.
4. Enhanced Organizational Transparency
This dashboard enhances transparency by offering a clear view of how each department, position, and individual is performing. It also enables employees to understand how their performance contributes to the organization’s success.
Best Practices for the Employee Performance Review Dashboard
To get the most out of the Employee Performance Review Dashboard in Excel, consider these best practices:
1. Set Clear Performance Metrics
Before using the dashboard, ensure that you have defined clear and measurable performance metrics. These should align with the organization’s goals and be meaningful to employees. For instance, metrics such as teamwork, communication, and problem-solving should be well-defined and understood by all.
2. Regularly Update Data
The effectiveness of the dashboard relies on timely and accurate data. Make sure that data is updated regularly, ideally at the end of each review cycle or monthly, to provide an up-to-date view of employee performance.
3. Use Data to Drive Feedback
Leverage the dashboard to provide targeted, constructive feedback. For example, if a department’s problem-solving score is low, managers can work with that team to develop targeted training or resources to improve performance.
4. Ensure Consistency Across Reviewers
To ensure fair and unbiased evaluations, establish guidelines for all reviewers. Ensure that each reviewer is using the same criteria and scoring system when assessing employees. This will prevent inconsistencies in the data.
5. Use Historical Data for Benchmarking
Leverage historical data to establish benchmarks. This allows managers to track improvements over time and set realistic performance expectations based on past performance.
Frequently Asked Questions (FAQs)
1. How can the Employee Performance Review Dashboard in Excel improve employee performance?
The dashboard provides clear and visual feedback, making it easier for employees to understand their strengths and areas for improvement. It helps managers deliver actionable insights and enables employees to take ownership of their performance.
2. What metrics are tracked in the Employee Performance Review Dashboard?
The dashboard tracks a range of performance metrics, including communication skills, teamwork, technical skills, problem-solving abilities, and punctuality, across different departments and positions.
3. Can this dashboard be customized to fit different business needs?
Yes, the dashboard is highly customizable. You can add or remove metrics based on the specific needs of your organization, department, or position.
4. How frequently should I update the performance data?
It is best to update the data regularly, either monthly or at the end of each review cycle, to ensure that the performance insights are current and relevant.
5. Is the Employee Performance Review Dashboard suitable for small businesses?
Yes, this dashboard is scalable and can be used by businesses of all sizes. Whether you have a small team or a large organization, the dashboard can help streamline performance reviews and improve overall performance management.
Conclusion
The Employee Performance Review Dashboard in Excel is an essential tool for any organization looking to streamline its performance review process. By offering detailed insights into employee performance across various departments and positions, this dashboard provides a clear and actionable overview that helps improve employee engagement, productivity, and satisfaction. By following best practices and customizing the dashboard to suit your specific needs, you can make the most of this powerful tool and drive better decision-making in your organization.