n the evolving landscape of workplace management, one factor consistently proves critical to long-term organizational success: employee satisfaction. When combined with environmental and sustainability goals, it creates a powerful narrative of corporate responsibility and internal harmony. The Environmental and Sustainability Employee Satisfaction KPI Dashboard in Excel brings this concept to life.
In this comprehensive article, we will explore everything you need to know about this dashboard—from its structure and benefits to best practices and common questions.
Click to Purchases Environmental and Sustainability Employee Satisfaction KPI Dashboard in Excel
What Is the Environmental and Sustainability Employee Satisfaction KPI Dashboard?
The Environmental and Sustainability Employee Satisfaction KPI Dashboard in Excel is a powerful and user-friendly tool designed to track, analyze, and visualize employee satisfaction KPIs in alignment with environmental and sustainability initiatives.
Whether you’re part of the HR team, ESG taskforce, or sustainability office, this dashboard offers a bird’s-eye view of how well your workplace meets employee expectations while promoting green and ethical practices.
Key Features of the Dashboard
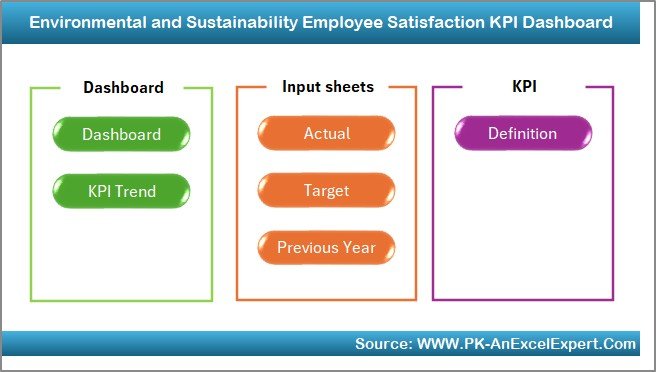
This dashboard comes with seven interactive and structured worksheets, each designed to simplify your workflow and improve decision-making:
Home Sheet
-
Works as the central index page.
-
Includes buttons that link directly to other sheets for quick navigation.
-
Simplifies access to the entire dashboard structure.
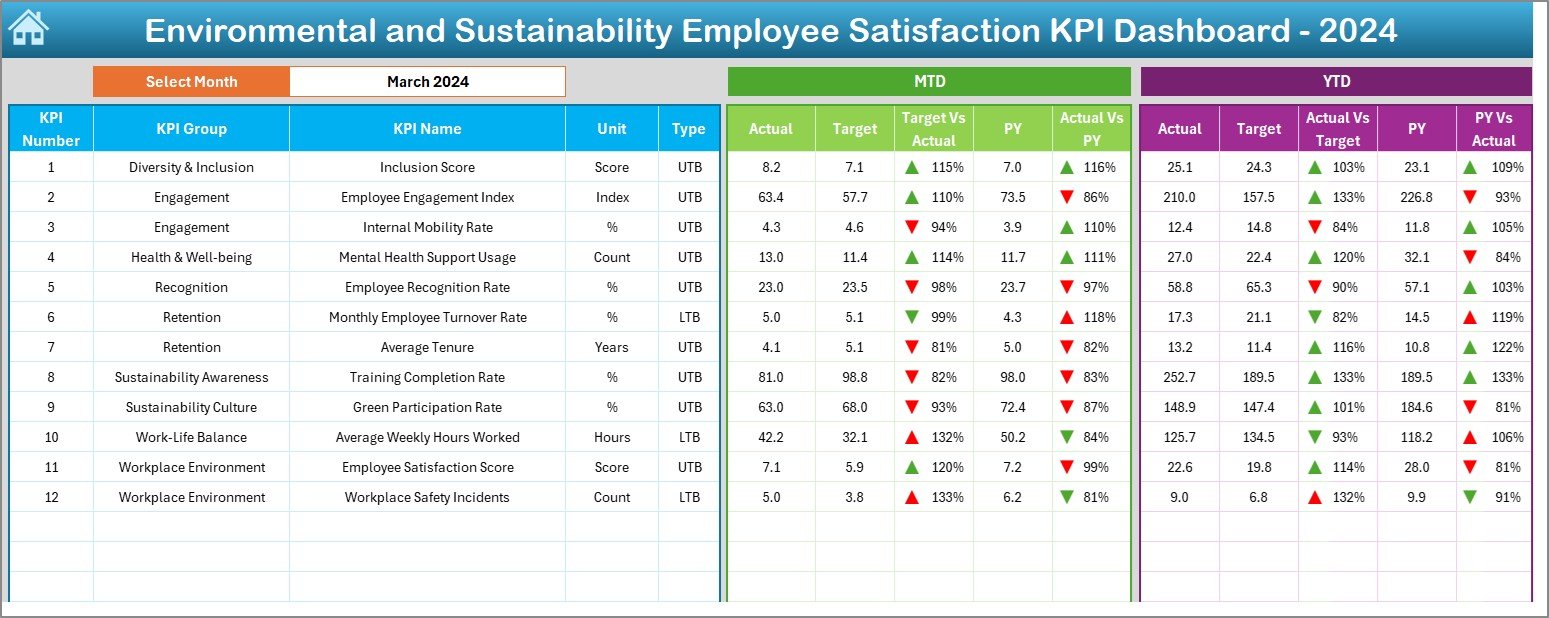
Dashboard Sheet
-
The core reporting sheet.
-
Allows you to select the month from a drop-down (Cell D3).
Displays key metrics like:
- MTD (Month-to-Date) Actual, Target, and Previous Year
- YTD (Year-to-Date) Actual, Target, and Previous Year
-
Conditional formatting uses up/down arrows to show trends.
-
Enables quick performance reviews by comparing Actual vs. Target and Actual vs. Previous Year.
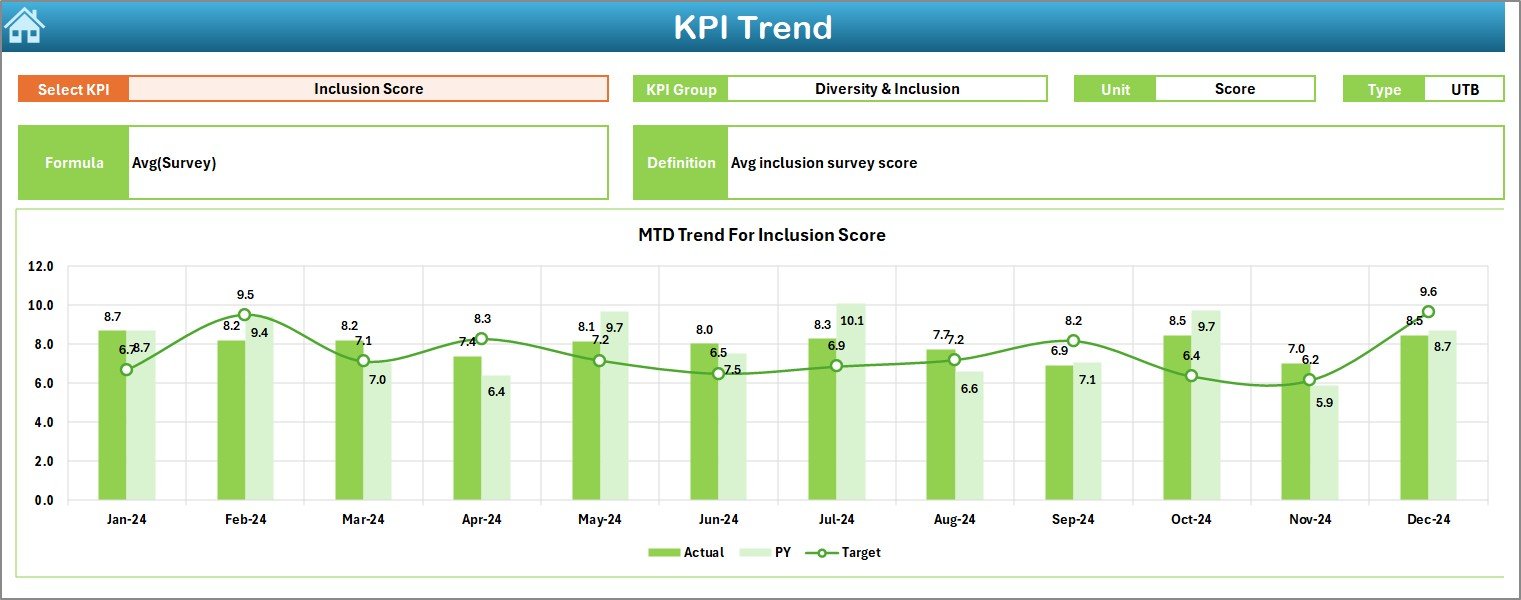
KPI Trend Sheet
-
Choose your desired KPI Name from a drop-down menu (Cell C3).
Displays supporting information:
- KPI Group
- Unit of Measurement
- Type: UTB (Upper the Better) or LTB (Lower the Better)
- Formula and Definition
-
Includes MTD and YTD trend charts for Actual, Target, and Previous Year data.
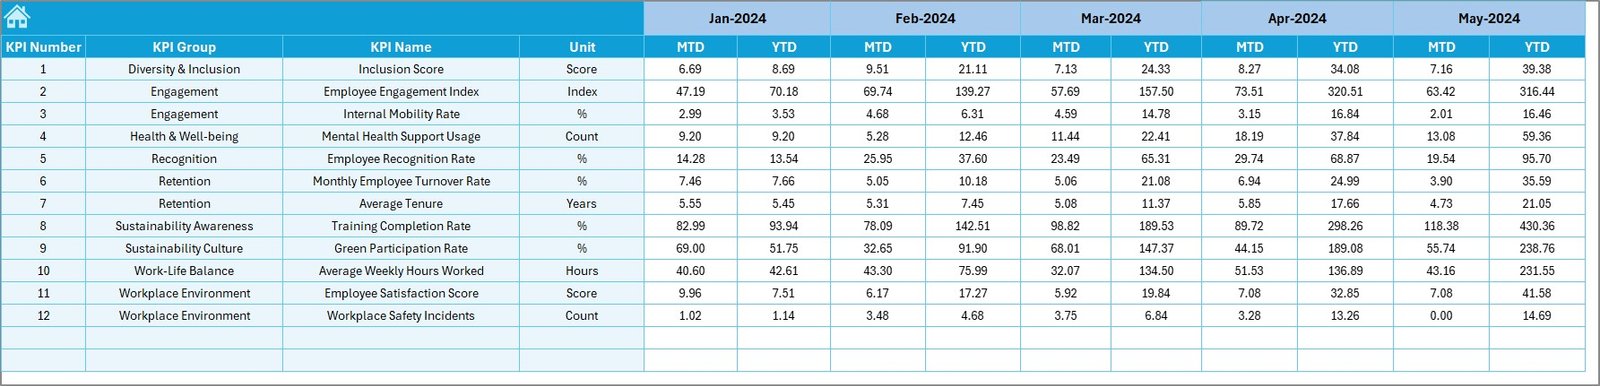
Actual Numbers Input Sheet

-
Enter your monthly actuals for MTD and YTD.
-
Change the year’s starting month from cell E1.
Target Sheet
-
Input Target values for all KPIs, month-wise.
-
Track both MTD and YTD targets.
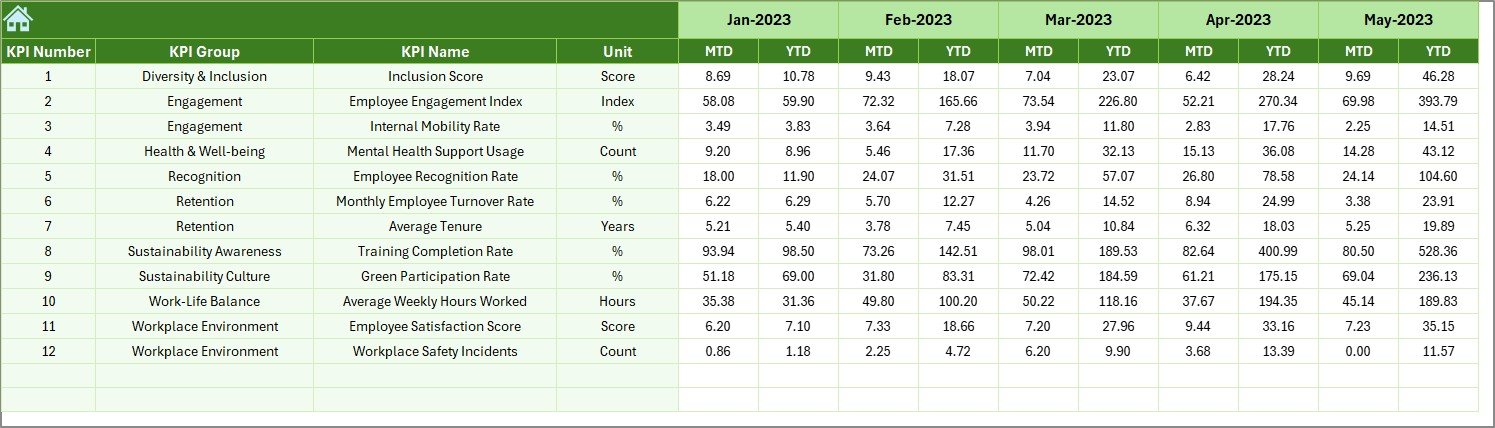
Previous Year Number Sheet
-
Record last year’s data for accurate year-on-year comparisons.
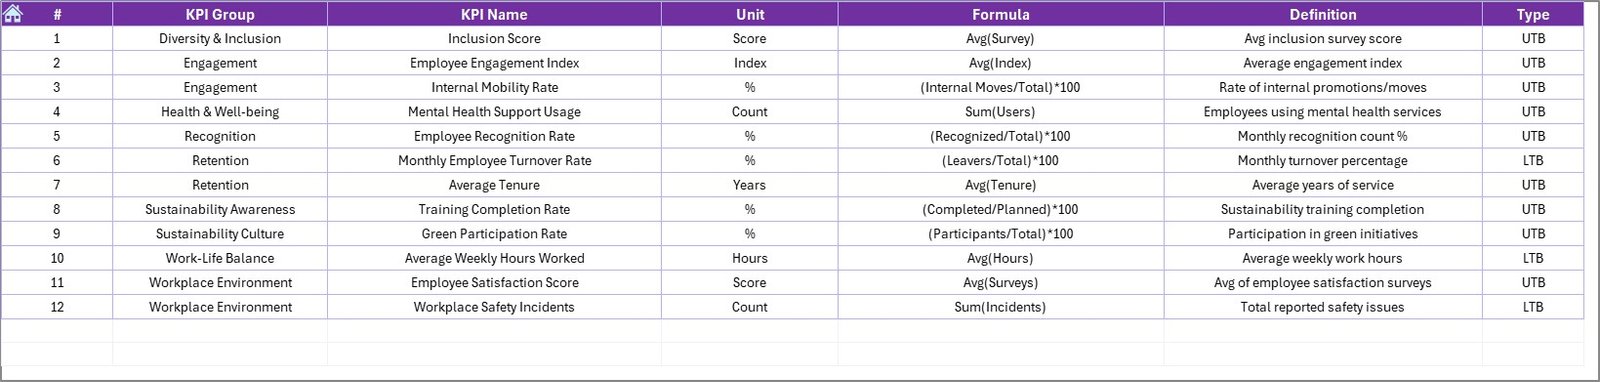
KPI Definition Sheet
-
Maintain a reference table for:
- KPI Name
- Group
- Unit
- Formula
- Brief definition
Why Is This Dashboard Important?
Tracking employee satisfaction in alignment with sustainability initiatives ensures that your organization is:
-
Retaining top talent
-
Promoting a healthy work culture
-
Meeting ESG goals
-
Improving productivity
-
Boosting employee engagement
This dashboard brings all of this together in a structured, easy-to-manage Excel format.
Advantages of the Employee Satisfaction KPI Dashboard
Click to Purchases Environmental and Sustainability Employee Satisfaction KPI Dashboard in Excel
Let’s break down the benefits this dashboard brings to your business:
✅ Improves Decision-Making
-
With a clear view of trends and comparisons, you can act fast and smart.
✅ Visual Insights
-
Conditional formatting, charts, and tables present data visually for easy comprehension.
✅ Customizable Structure
-
Add or edit KPIs easily based on organizational needs.
✅ Sustainability-Driven
-
Encourages alignment between employee well-being and environmental goals.
✅ Year-over-Year Comparison
-
Track progress and performance across time.
✅ Better Employee Retention
-
Identifying satisfaction gaps early helps reduce attrition.
Best Practices for Using the KPI Dashboard
To fully utilize the power of this dashboard, follow these practical tips:
🔹 Define Clear KPIs
-
Choose KPIs that align with your organization’s sustainability goals and employee welfare policies.
🔹 Update Monthly
-
Regular data entry ensures up-to-date insights for management reviews.
🔹 Use the Trend Sheet Actively
-
Monitor emerging patterns to prevent issues before they arise.
🔹 Validate Your Data
-
Double-check actuals, targets, and previous year entries to avoid reporting errors.
🔹 Align with Other Departments
-
HR, Sustainability, and Operations should collaborate for more accurate KPI definitions and targets.
Examples of Employee Satisfaction KPIs for Sustainability Initiatives
Here are some KPIs you might track using this dashboard:
-
Employee Satisfaction Score
-
Workplace Safety Rating
-
Participation in Green Initiatives
-
Carbon Footprint Awareness per Employee
-
Training Hours on Sustainability
-
Eco-Friendly Commuting Rate
-
Employee Turnover Rate
-
Mental Wellness Engagement
-
Remote Work Satisfaction Score
-
Paperless Compliance Rate
-
Energy Efficiency Awareness
-
Employee Engagement in CSR Activities
Each of these can be set as UTB or LTB depending on their nature and goals.
How Does It Work?
The dashboard works by taking Actual, Target, and Previous Year values for each KPI across months. Then, it performs these core functions:
-
Compares MTD and YTD values.
-
Displays differences with arrows (up/down).
-
Visualizes trends using Excel charts.
-
Highlights underperformance or improvements.
-
Offers drill-down views via the KPI Trend sheet.
How to Set Up the Dashboard Efficiently
If you’re using this dashboard for the first time, here’s a step-by-step setup guide:
-
Go to KPI Definition Sheet
-
Add your KPI Name, Group, Unit, Formula, and Type (UTB or LTB).
-
-
Update the Target Sheet
-
Enter monthly targets (both MTD and YTD) for each KPI.
-
-
Input Previous Year Data
-
Fill out the previous year’s values in the respective sheet.
-
-
Enter Actuals
-
Update MTD and YTD figures in the “Actual Numbers Input” tab.
-
-
Navigate the Dashboard
-
Use drop-downs to change the month and review performance visually.
-
-
Analyze Trends
-
Use the KPI Trend sheet to check how each KPI is evolving over time.
-
Who Should Use This Dashboard?
This dashboard suits a wide range of users and teams, including:
-
HR Professionals
-
Sustainability Managers
-
ESG Analysts
-
Project Managers
-
CSR Teams
-
C-Level Executives
It’s particularly valuable in companies that prioritize sustainability and employee welfare as part of their core values.
Real-World Use Case
Let’s say a company wants to improve its sustainability branding and reduce turnover.
They implement this dashboard to track:
-
Satisfaction scores
-
Participation in eco-workshops
-
Remote work feedback
-
CSR event engagement
After 3 months, they observe that participation in green events increased 35%, and the satisfaction score improved by 12%. This helps them showcase their commitment to sustainability in internal reports and investor presentations.
Conclusion
The Environmental and Sustainability Employee Satisfaction KPI Dashboard in Excel is more than just a spreadsheet—it’s a vital tool that merges employee well-being with sustainability leadership.
It empowers organizations to track, visualize, and optimize employee satisfaction in eco-conscious ways. Whether you are a start-up or a global enterprise, this dashboard helps align people-first policies with green practices—delivering measurable impact and strategic clarity.
Frequently Asked Questions (FAQs)
1. What is the main purpose of this dashboard?
The main purpose is to help organizations track employee satisfaction KPIs in line with environmental and sustainability goals.
2. Can I customize the KPIs in this dashboard?
Yes, the KPI Definition tab lets you add or modify KPIs easily.
3. Do I need Excel expertise to use this dashboard?
Basic Excel knowledge is sufficient. The template includes dropdowns and prebuilt formulas.
4. How frequently should I update the dashboard?
Update it monthly to keep your data and insights current.
5. Can I present this dashboard to stakeholders?
Absolutely! It’s designed for clear, visual storytelling using pivot tables and charts.
6. Is this dashboard suitable for non-profit organizations?
Yes, especially those focused on employee engagement and sustainability.
7. What’s the difference between UTB and LTB KPIs?
-
UTB (Upper the Better): Higher values indicate better performance (e.g., satisfaction score).
-
LTB (Lower the Better): Lower values indicate better performance (e.g., attrition rate).
8. How do I interpret the arrows in the Dashboard tab?
Green up-arrows signal improvement; red down-arrows indicate a drop compared to target or last year.
9. Can I add more months or years?
Yes, just expand the data range in each sheet and update your formulas if needed.
Click to Purchases Environmental and Sustainability Employee Satisfaction KPI Dashboard in Excel
Visit our YouTube channel to learn step-by-step video tutorials