In today’s world, businesses must go beyond profits and focus on long-term environmental and sustainability goals. Tracking sustainability metrics is no longer optional—it’s a necessity. An Environmental and Sustainability Operations KPI Dashboard in Excel provides organizations with a powerful and easy-to-use tool to monitor and evaluate their green performance.
This article explores how an Excel-based KPI dashboard can enhance your environmental strategies, what it includes, why it matters, and how you can use it effectively.
Click to Purchases Environmental and Sustainability Operations KPI Dashboard in Excel
What Is an Environmental and Sustainability Operations KPI Dashboard?
An Environmental and Sustainability Operations KPI Dashboard is a structured Excel template designed to track, monitor, and visualize key performance indicators (KPIs) related to environmental impact and sustainable operations.
It captures metrics like energy consumption, waste generation, carbon emissions, water usage, recycling rates, and more. With well-organized charts and trend visuals, this dashboard helps stakeholders analyze data monthly or yearly and take informed actions.
Key Features of the Environmental KPI Dashboard in Excel
The dashboard is built with seven integrated worksheet tabs, each contributing to comprehensive sustainability performance monitoring. Let’s walk through each component in detail.
Home Sheet
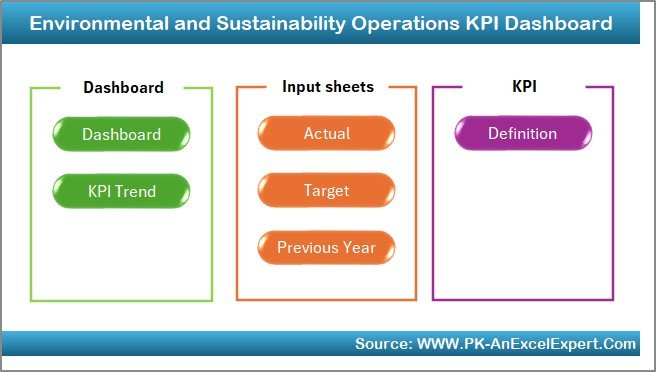
This is the landing page or index sheet of the Excel dashboard. It includes:
-
Buttons that provide easy navigation to other worksheets.
-
A clean, structured interface for users to access different sections without confusion.
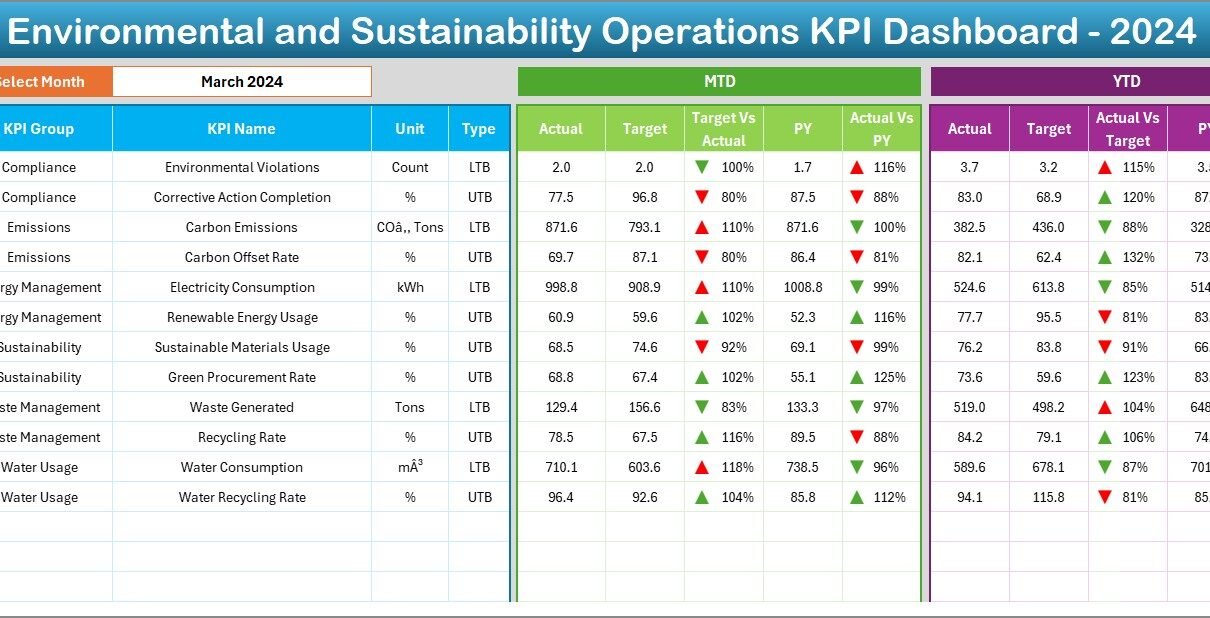
Dashboard Sheet
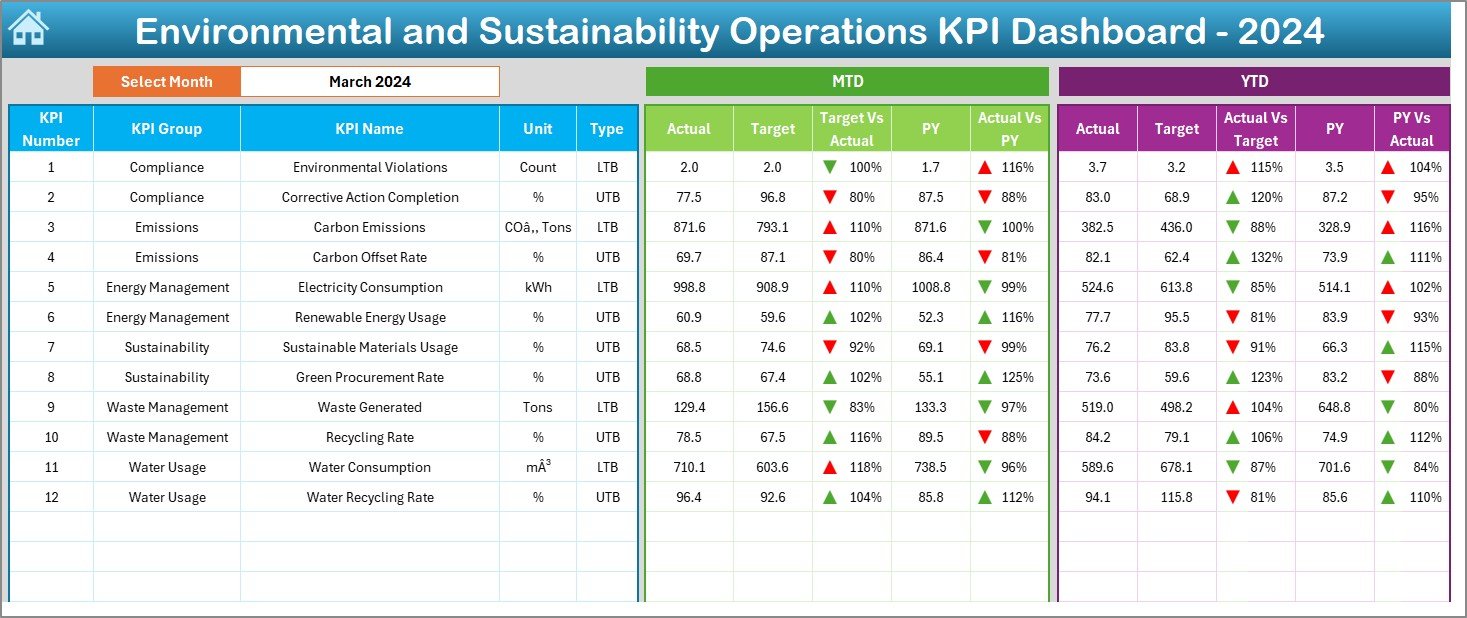
This is the main visualization hub of the template. It offers:
-
A drop-down in cell
D3to select the month for analysis. -
Automatic updates of dashboard numbers for the selected month.
-
Visualization of MTD (Month-to-Date) and YTD (Year-to-Date) Actuals, Targets, and Previous Year comparisons.
-
Visual indicators such as up and down arrows for quick understanding of trends using conditional formatting.
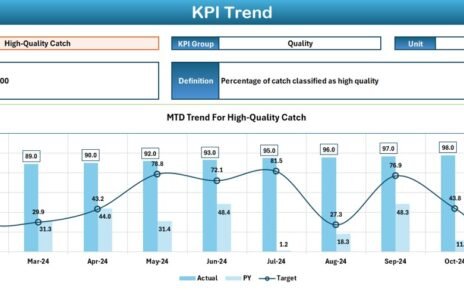
KPI Trend Sheet
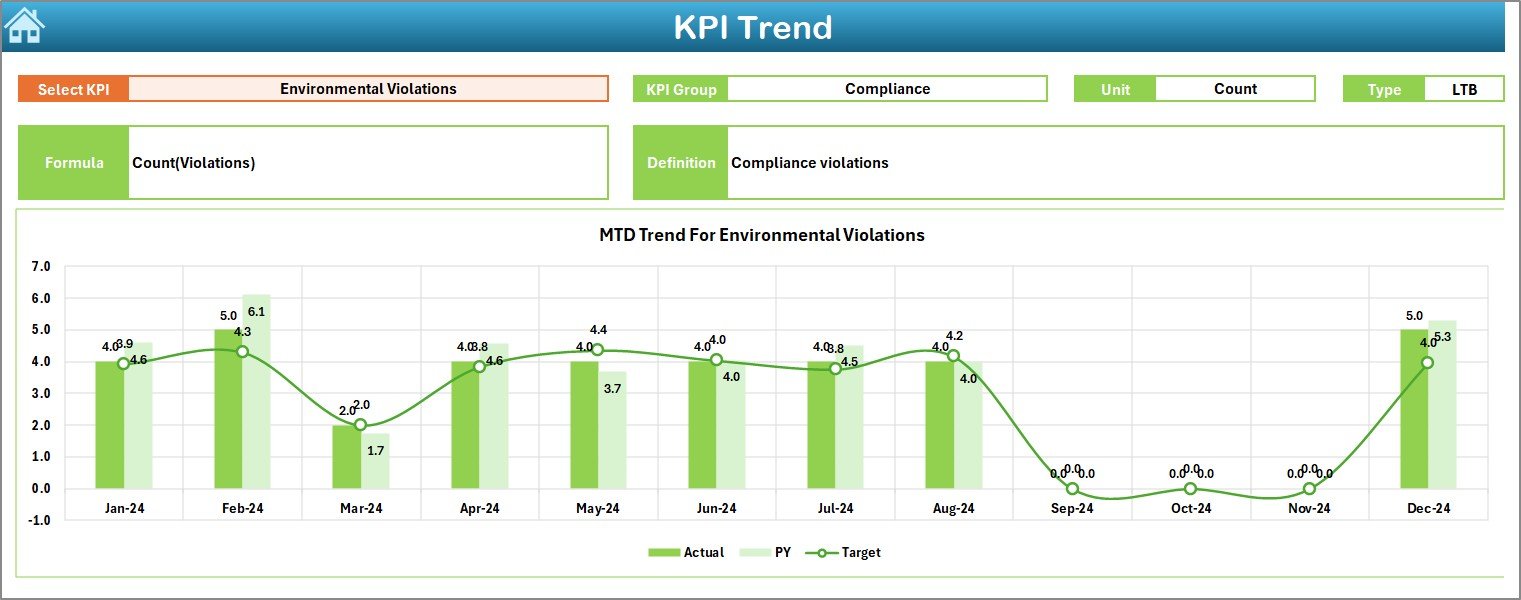
This tab provides trend analysis of individual KPIs:
-
Drop-down selection at cell
C3to choose any KPI. -
Displays KPI Group, Unit, Type (Lower The Better or Upper The Better), Formula, and Definition.
-
Line charts to view Actual vs Target vs Previous Year for both MTD and YTD.
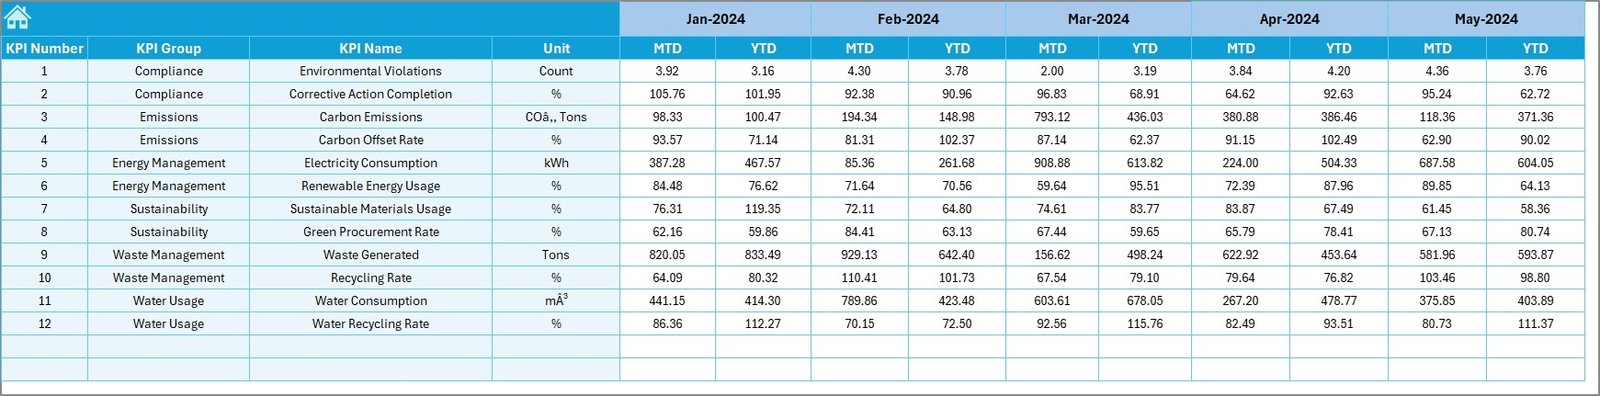
Actual Numbers Input Sheet
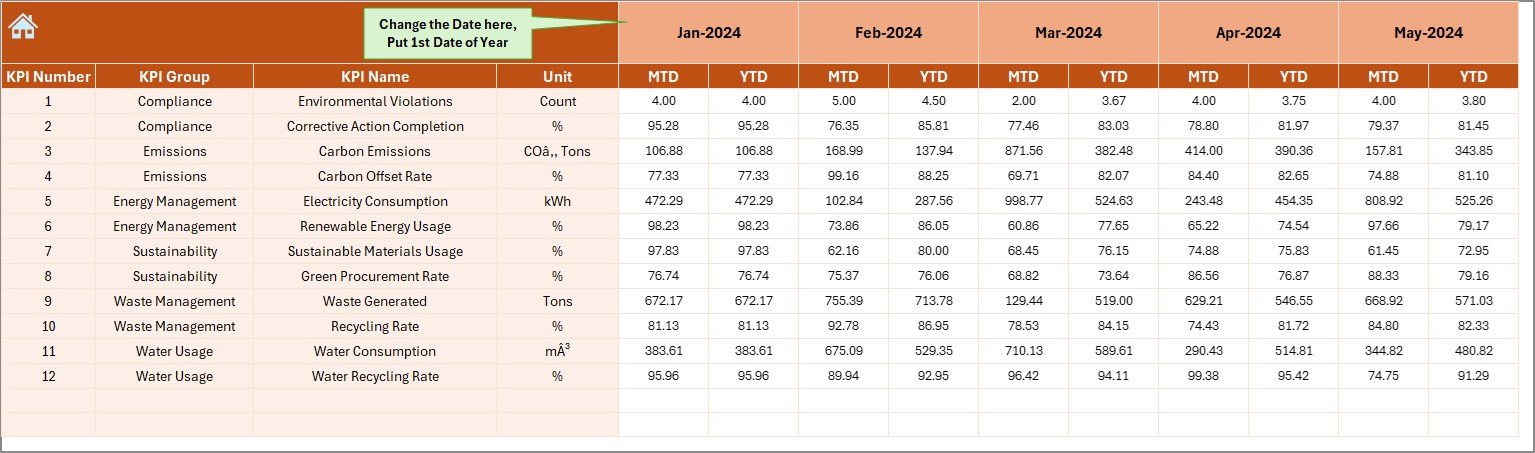
This sheet captures raw data input for each KPI:
-
The starting month is selected in cell
E1. -
Users enter monthly MTD and YTD values based on operational data.
Target Sheet
Here, you define monthly MTD and YTD targets for each KPI:
-
Supports benchmarking and planning.
-
Enables variance calculation against actual performance.
Previous Year Number Sheet
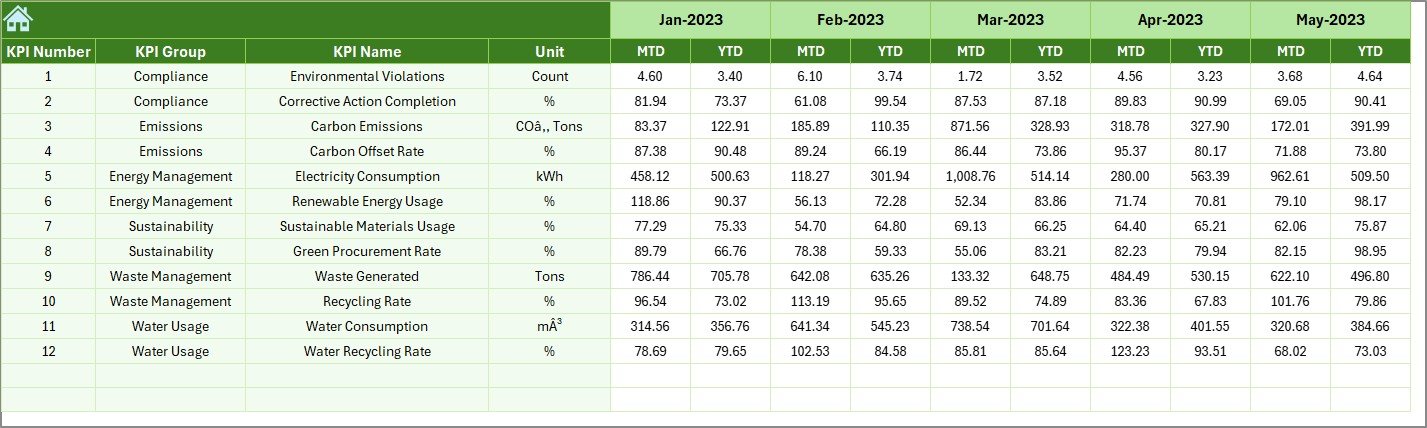
Stores last year’s performance numbers:
-
Allows year-over-year comparisons.
-
Helps track improvements or deteriorations over time.
KPI Definition Sheet
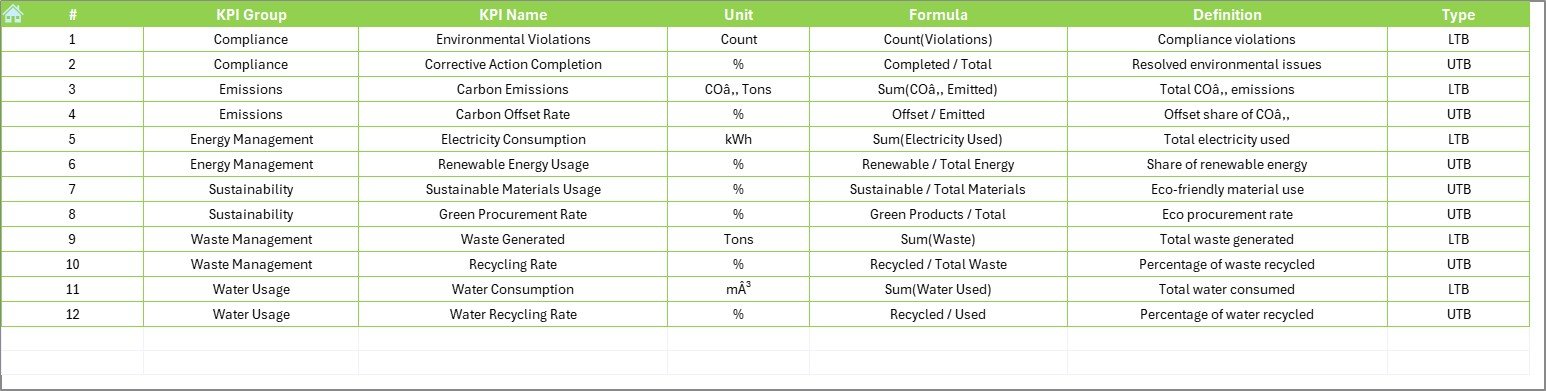
This tab documents all KPI definitions for transparency:
-
Fields include KPI Name, Group, Unit, Formula, and Definition.
-
Ensures everyone understands what each metric means and how it is calculated.
Why Use an Excel-Based KPI Dashboard for Environmental Monitoring?
Excel remains a preferred platform for many organizations due to its flexibility, familiarity, and cost-effectiveness. Here’s why Excel works brilliantly for an Environmental KPI Dashboard:
-
No need for expensive software—just open Excel and get started.
-
Customizable formulas and visuals to match your industry needs.
-
Easy to update and distribute across departments.
-
Supports PivotTables, dropdowns, and charts without requiring advanced programming.
What KPIs Can You Track Using This Dashboard?
You can configure and track multiple KPIs related to environmental sustainability. Examples include:
-
Energy Usage per Unit Produced (kWh/unit)
-
Carbon Emissions per Employee (kg CO₂e)
-
Water Consumption (liters/month)
-
Recycling Rate (%)
-
Hazardous Waste Generated (kg)
-
Paper Consumption (sheets/month)
-
Greenhouse Gas Emission Intensity
-
Sustainable Supplier Percentage
-
Fleet Fuel Efficiency (km/liter)
-
Compliance Incidents (count)
-
Renewable Energy Usage (%)
-
Sustainability Training Hours per Employee
Each KPI can be customized to match your company’s focus and compliance goals.
How to Use the Environmental KPI Dashboard Effectively
Click to Purchases Environmental and Sustainability Operations KPI Dashboard in Excel
To get the most out of your dashboard, follow these simple steps:
-
Set the Reporting Year in the Actual Numbers Input sheet.
-
Define Monthly Targets in the Target sheet based on your sustainability goals.
-
Input Actual Performance Data month by month.
-
Enter Previous Year Figures for comparative analysis.
-
Use the Dashboard sheet to monitor KPIs visually and detect variances.
-
Leverage the KPI Trend tab to deep dive into historical trends and adjust strategies.
Advantages of Environmental and Sustainability KPI Dashboards
Implementing this dashboard provides a wide range of benefits. Here are the most significant ones:
✅ Data-Driven Decision Making
You can make strategic choices using hard data instead of assumptions.
✅ Improved Environmental Accountability
All departments stay informed and aligned with sustainability goals.
✅ Regulatory Compliance
Track performance against local, national, and international compliance frameworks.
✅ Cost Savings
Identifying inefficiencies helps reduce energy, waste, and resource costs.
✅ Real-Time Monitoring
Monthly data input provides up-to-date performance insights.
✅ Stakeholder Transparency
Share well-documented performance visuals with clients, investors, or auditors.
Opportunities for Improvement
Even the best systems can benefit from optimization. Consider these areas for improvement:
🔄 Automate Data Collection
Connect Excel with external data sources to reduce manual input errors.
🔄 Use Excel Macros or VBA
Enhance workflow automation, like form submissions or alerts.
🔄 Incorporate Benchmarking Data
Compare your KPIs with industry benchmarks for deeper insights.
🔄 Add Comments or Action Logs
Document action plans or observations alongside data entries.
🔄 Include Conditional Formatting Rules for Critical KPIs
Highlight metrics that need immediate attention.
Best Practices for Using a Sustainability KPI Dashboard
To maintain the quality and consistency of your dashboard:
✔️ Standardize Data Entry formats and avoid text in numeric fields.
✔️ Define Clear KPI Ownership—assign responsible persons to each metric.
✔️ Regularly Update the Actual Numbers to reflect true progress.
✔️ Use Visual Alerts (like icons, color codes) to mark KPIs off-target.
✔️ Backup the File Regularly and maintain version control.
✔️ Review Monthly Performance in Team Meetings to drive improvement.
Who Should Use This Dashboard?
This KPI dashboard can be used across various departments and industries:
-
Sustainability Managers for tracking green goals.
-
Facility Managers to reduce resource waste.
-
Compliance Teams for reporting and audit readiness.
-
Operations Teams to optimize environmental efficiency.
-
Executives for high-level sustainability performance monitoring.
Final Thoughts
Environmental performance tracking is not just about compliance—it’s about creating a sustainable future. The Environmental and Sustainability Operations KPI Dashboard in Excel gives you the clarity, structure, and insights you need to guide your organization toward better environmental responsibility.
It blends ease of use with in-depth tracking, empowering organizations of any size to take control of their green initiatives.
Frequently Asked Questions (FAQs)
1. What is a sustainability KPI dashboard?
A sustainability KPI dashboard is a tool used to track and visualize key performance indicators related to environmental and sustainability goals. It helps monitor metrics such as energy consumption, waste generation, emissions, and more.
2. Can I use this dashboard for any industry?
Yes! The Excel-based dashboard is customizable for manufacturing, logistics, education, retail, healthcare, and other industries aiming for improved sustainability.
3. How often should I update the KPI data?
You should update the data monthly to reflect both MTD and YTD values. This enables accurate trend tracking and proactive decision-making.
4. Can this dashboard handle more than 12 KPIs?
Absolutely. You can expand the template to include as many KPIs as needed. Just ensure proper formula linking and row expansion across the sheets.
5. Do I need Excel macros or coding to use this?
No coding is required to use the base version. However, you can add VBA macros to automate tasks like email alerts or data validation if you wish.
6. Is this dashboard suitable for ESG reporting?
Yes. The KPIs captured in this dashboard can form part of your Environmental, Social, and Governance (ESG) reporting framework.
Visit our YouTube channel to learn step-by-step video tutorials