Environmental, Social, and Governance (ESG) reporting has moved from a “nice to have” to a business necessity. Today, investors, regulators, customers, and employees expect transparency, accountability, and measurable impact. As a result, organizations must track ESG performance clearly and consistently.
Therefore, an Environmental, Social, and Governance (ESG) Dashboard in Excel becomes a powerful solution. It helps organizations transform scattered ESG data into clear, visual, and actionable insights. Moreover, Excel offers flexibility, accessibility, and cost-effectiveness for ESG reporting.
In this detailed guide, you will learn what an ESG Dashboard in Excel is, why it matters, how it works, its structure, key metrics, advantages, best practices, and frequently asked questions. Additionally, this article explains how a ready-to-use ESG Dashboard helps businesses monitor sustainability goals with confidence.
Click to buy Environmental, Social, and Governance (ESG) Dashboard in Excel
What Is an Environmental, Social, and Governance (ESG) Dashboard in Excel?
An Environmental, Social, and Governance (ESG) Dashboard in Excel is a structured reporting and visualization tool that tracks sustainability and governance metrics in one centralized file. Instead of reviewing multiple spreadsheets, users monitor ESG performance through interactive charts, KPIs, and trend analysis.
Moreover, this dashboard consolidates environmental impact, social responsibility, and governance practices into clear visuals. As a result, decision-makers quickly understand risks, opportunities, and compliance status.
In addition, Excel dashboards support monthly, regional, industry, and risk-based analysis, which makes ESG reporting easier and more transparent.
Why Do Organizations Need an ESG Dashboard in Excel?
Organizations face increasing pressure to prove their ESG commitments. Therefore, manual reporting no longer works.
Here is why an ESG Dashboard in Excel becomes essential:
- First, it improves data visibility across ESG pillars
- Second, it supports investor and regulatory reporting
- Third, it enables risk identification and mitigation
- Moreover, it aligns sustainability goals with business strategy
- Finally, it improves decision-making through visual insights
Because Excel remains widely used, teams adopt ESG dashboards quickly without heavy training or software costs.
How Does an ESG Dashboard in Excel Work?
An ESG Dashboard in Excel works by connecting structured ESG data tables with charts, KPIs, and slicers.
First, users enter or import ESG data such as emissions, workforce diversity, safety incidents, and board metrics.
Next, Excel formulas calculate totals, averages, and percentages.
Then, Pivot Tables and Pivot Charts summarize the data.
Finally, dashboard visuals display insights dynamically.
As a result, users analyze ESG performance by region, industry, risk category, and time period.
What Sheets Are Included in an ESG Dashboard in Excel?
A ready-to-use Environmental, Social, and Governance (ESG) Dashboard in Excel includes multiple structured sheets. Each sheet focuses on a specific analytical view.
Let us explore them in detail.
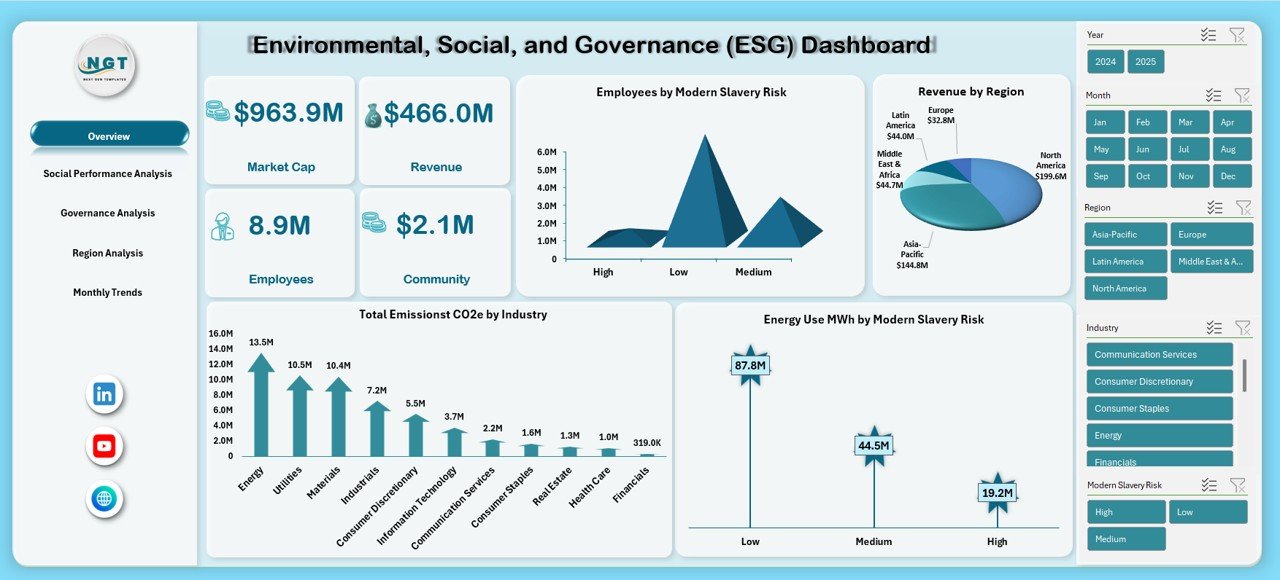
Overview Sheet: What Does the ESG Overview Show?
The Overview Sheet provides a high-level snapshot of ESG performance. It helps leadership understand the organization’s sustainability position at a glance.
Key Metrics on the Overview Sheet
- Market Cap – Reflects the organization’s market value
- Revenue – Indicates financial strength linked to ESG initiatives
- Employees – Shows workforce size and scale
- Community Investment – Highlights social contribution
- Employees by Modern Slavery Risk – Identifies human rights exposure
- Revenue by Region – Displays geographic revenue distribution
- Total Emissions (tCO2e) by Industry – Tracks carbon footprint
- Energy Use (MWh) by Modern Slavery Risk – Links energy and social risk
Because this sheet summarizes critical ESG indicators, it supports quick executive reviews and board discussions.
Click to buy Environmental, Social, and Governance (ESG) Dashboard in Excel
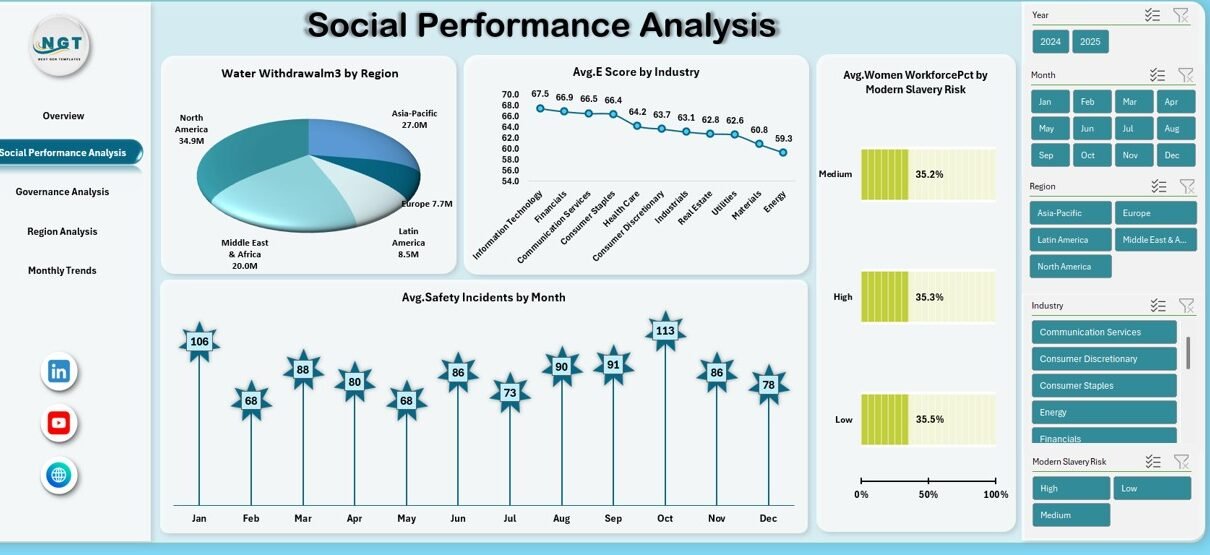
Social Performance Analysis: How Do You Measure Social Impact?
The Social Performance Analysis Sheet focuses on workforce well-being, diversity, safety, and community impact.
Key Social Metrics Included
- Water Withdrawal (m³) by Region
- Average Environmental Score by Industry
- Average Safety Incidents by Month
- Average Women Workforce Percentage by Modern Slavery Risk
These metrics help organizations evaluate how operations affect employees, communities, and natural resources.
Moreover, this sheet supports risk-based social planning and policy improvement.

Click to buy Environmental, Social, and Governance (ESG) Dashboard in Excel
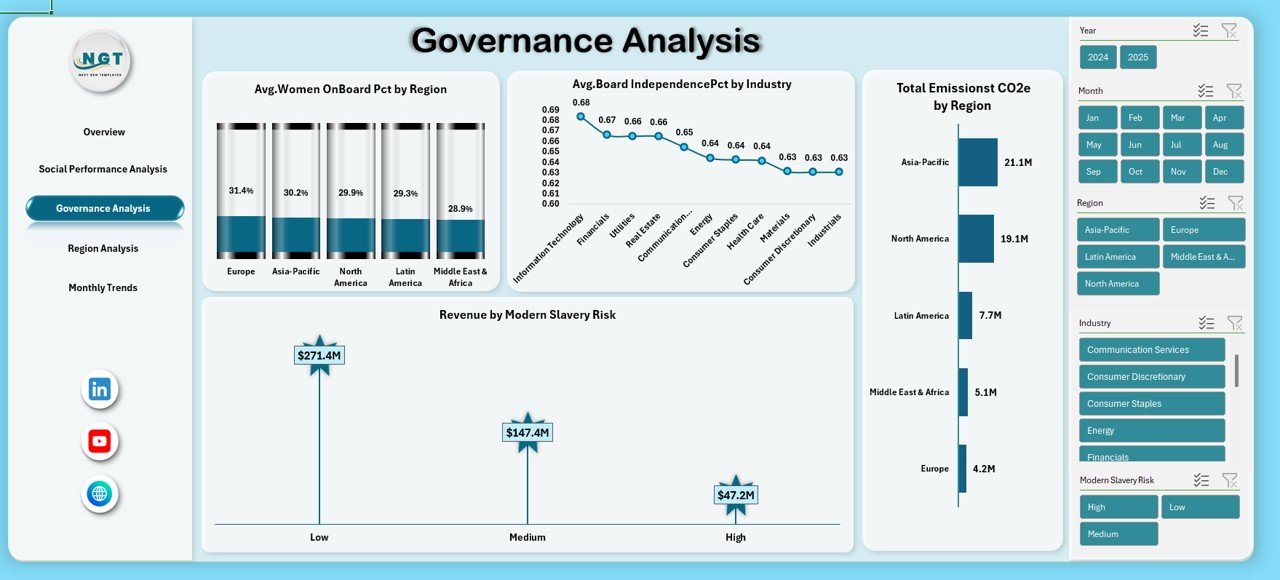
Governance Analysis: How Do You Track Governance Effectiveness?
Governance plays a critical role in ESG success. Therefore, the Governance Analysis Sheet focuses on leadership diversity, independence, and oversight.
Key Governance Metrics
- Average Women on Board Percentage by Region
- Average Board Independence Percentage by Industry
- Revenue by Modern Slavery Risk
- Total Emissions (tCO2e) by Region
By combining governance and environmental metrics, organizations gain a balanced view of ethical leadership and accountability.
Click to buy Environmental, Social, and Governance (ESG) Dashboard in Excel
Region Analysis: Why Is Regional ESG Performance Important?
The Region Analysis Sheet highlights ESG performance across geographic areas. Because ESG risks vary by location, this analysis becomes essential.
Regional Metrics Included
- Market Cap by Region
- Total Emissions (tCO2e) by Region
- Average Supplier ESG Score by Region
- Data Privacy Incidents by Region
As a result, organizations identify high-risk regions and prioritize corrective actions.

Click to buy Environmental, Social, and Governance (ESG) Dashboard in Excel
Monthly Trends: How Do ESG Metrics Change Over Time?
The Monthly Trends Sheet tracks ESG performance over time. Therefore, it supports trend analysis and forecasting.
Monthly Metrics Tracked
- Scope 1 Emissions (tCO2e) by Month
- Scope 2 Emissions (tCO2e) by Month
- Market Cap by Month
Because trends reveal progress or deterioration, this sheet supports strategic ESG planning.

Click to buy Environmental, Social, and Governance (ESG) Dashboard in Excel
What KPIs Should an ESG Dashboard in Excel Track?
An effective ESG Dashboard includes meaningful KPIs across all three pillars.
Environmental KPIs
- Total Emissions (tCO2e)
- Scope 1 and Scope 2 Emissions
- Energy Use (MWh)
- Water Withdrawal (m³)
Social KPIs
- Workforce Diversity Percentage
- Safety Incident Rate
- Community Investment Value
- Employees by Modern Slavery Risk
Governance KPIs
- Board Independence Percentage
- Women on Board Percentage
- Supplier ESG Score
- Data Privacy Incidents
By tracking these KPIs, organizations maintain ESG transparency and accountability.
Advantages of an Environmental, Social, and Governance (ESG) Dashboard in Excel
An ESG Dashboard in Excel offers several practical benefits.
- Centralized ESG Reporting
First, it brings all ESG metrics into one place. As a result, teams avoid fragmented reporting.
- Easy Customization
Second, Excel allows quick changes to KPIs, charts, and layouts.
- Cost-Effective Solution
Moreover, organizations avoid expensive ESG software licenses.
- Improved Decision-Making
Because visuals simplify complex data, leaders make faster and better decisions.
- Strong Stakeholder Communication
Finally, ESG dashboards support investor presentations, audits, and compliance reporting.
Best Practices for the Environmental, Social, and Governance (ESG) Dashboard in Excel
To maximize value, organizations must follow best practices.
- Standardize ESG Data Sources
First, ensure consistent data definitions across departments.
- Update Data Regularly
Next, refresh ESG data monthly or quarterly to maintain accuracy.
- Use Clear KPI Definitions
Moreover, define each KPI clearly to avoid confusion.
- Focus on Material Metrics
Also, track ESG metrics that truly impact business and stakeholders.
- Enable Trend Analysis
Finally, use monthly and regional trends to guide long-term strategy.
How Does an ESG Dashboard Support Strategic Decision-Making?
An ESG Dashboard does more than reporting.
- It identifies high-risk regions and suppliers
- It tracks progress toward sustainability targets
- It supports regulatory compliance
- It improves investor confidence
- It aligns ESG goals with financial performance
Therefore, ESG dashboards become a strategic planning tool, not just a reporting file.
Who Can Benefit from an ESG Dashboard in Excel?
An ESG Dashboard benefits multiple stakeholders.
- Sustainability teams
- ESG analysts
- Finance and compliance teams
- Executive leadership
- Investors and auditors
Because Excel remains widely accessible, teams adopt the dashboard easily.
How Is a Ready-to-Use ESG Dashboard Better Than Manual Reporting?
Manual ESG reporting consumes time and increases errors. In contrast, a ready-to-use dashboard offers:
- Automated calculations
- Consistent metrics
- Visual insights
- Faster reporting cycles
- Better accuracy
As a result, teams focus on improvement instead of data preparation.
Conclusion: Why Should You Use an Environmental, Social, and Governance (ESG) Dashboard in Excel?
An Environmental, Social, and Governance (ESG) Dashboard in Excel transforms complex sustainability data into meaningful insights. It helps organizations monitor environmental impact, social responsibility, and governance practices in one structured view.
Moreover, it improves transparency, supports compliance, and strengthens stakeholder trust. Because Excel offers flexibility and familiarity, organizations implement ESG dashboards quickly and effectively.
If your organization wants better ESG visibility and smarter sustainability decisions, an ESG Dashboard in Excel becomes the right solution.
Frequently Asked Questions (FAQs)
What is an ESG Dashboard in Excel?
An ESG Dashboard in Excel is a reporting tool that tracks environmental, social, and governance metrics using charts, KPIs, and trend analysis.
Why should companies track ESG metrics?
Companies track ESG metrics to meet regulatory requirements, attract investors, manage risks, and demonstrate sustainability commitment.
Can small businesses use an ESG Dashboard in Excel?
Yes, small businesses can use Excel-based ESG dashboards because they are affordable, flexible, and easy to maintain.
How often should ESG data be updated?
Organizations should update ESG data monthly or quarterly for accurate reporting and trend analysis.
What are Scope 1 and Scope 2 emissions?
Scope 1 emissions come from direct operations, while Scope 2 emissions result from purchased energy consumption.
Is Excel suitable for ESG reporting?
Yes, Excel is suitable for ESG reporting, especially for organizations starting ESG measurement or needing customizable dashboards.
Can ESG dashboards support investor reporting?
Yes, ESG dashboards provide clear visuals and metrics that investors and auditors expect.
What makes a good ESG KPI?
A good ESG KPI is measurable, relevant, consistent, and aligned with business and sustainability goals.
Watch the step-by-step video tutorial:
Watch the step-by-step video tutorial:
Visit our YouTube channel to learn step-by-step video tutorials
Click to buy Environmental, Social, and Governance (ESG) Dashboard in Excel