In today’s asset-intensive business environment, organizations must carefully monitor equipment leasing costs, vendor performance, and departmental usage. However, many companies still rely on scattered spreadsheets and manual reports. As a result, decision-makers often struggle to track lease expenses, escalation trends, and maintenance costs in one centralized view.
Therefore, businesses need a powerful, interactive, and real-time monitoring solution. More importantly, they need clear visibility to control leasing expenses and improve asset utilization.
That is exactly where the Equipment Leasing Dashboard in Power BI becomes a game-changing solution.
In this comprehensive guide, you will learn everything about this ready-to-use Power BI dashboard. We will explore its structure, key features, business benefits, and best practices. By the end, you will clearly understand how this dashboard can transform your equipment lease management process.
Click to Purchases Equipment Leasing Dashboard in Power BI
What Is an Equipment Leasing Dashboard in Power BI?
An Equipment Leasing Dashboard in Power BI is an interactive analytics tool that tracks, monitors, and analyzes equipment lease performance using dynamic visualizations.
Instead of reviewing multiple reports, managers can monitor lease costs, escalation percentages, maintenance expenses, and vendor distribution in one centralized dashboard. Consequently, teams make faster and more accurate decisions.
Moreover, the dashboard uses Power BI’s powerful data modeling and visualization capabilities. Therefore, it provides real-time insights that traditional spreadsheets cannot deliver.
Why Do Organizations Need an Equipment Leasing Dashboard?
Equipment leasing generates large volumes of operational and financial data. However, without proper visualization, this data creates confusion instead of clarity.
Organizations often face these challenges:
-
Difficulty tracking monthly lease costs
-
Limited visibility into escalation trends
-
Poor monitoring of vendor distribution
-
Lack of departmental cost control
-
Manual and time-consuming reporting
Because of these issues, companies often overspend on leases or miss cost optimization opportunities.
However, when organizations implement the Equipment Leasing Dashboard in Power BI, they gain:
-
Centralized visibility
-
Faster reporting
-
Better cost control
-
Improved vendor management
-
Data-driven decision-making
Key Features of Equipment Leasing Dashboard in Power BI
This ready-to-use Power BI solution includes five powerful analytical pages. Each page focuses on a specific dimension of lease performance. As a result, users can drill down quickly and uncover meaningful insights.
Let us explore each page in detail.
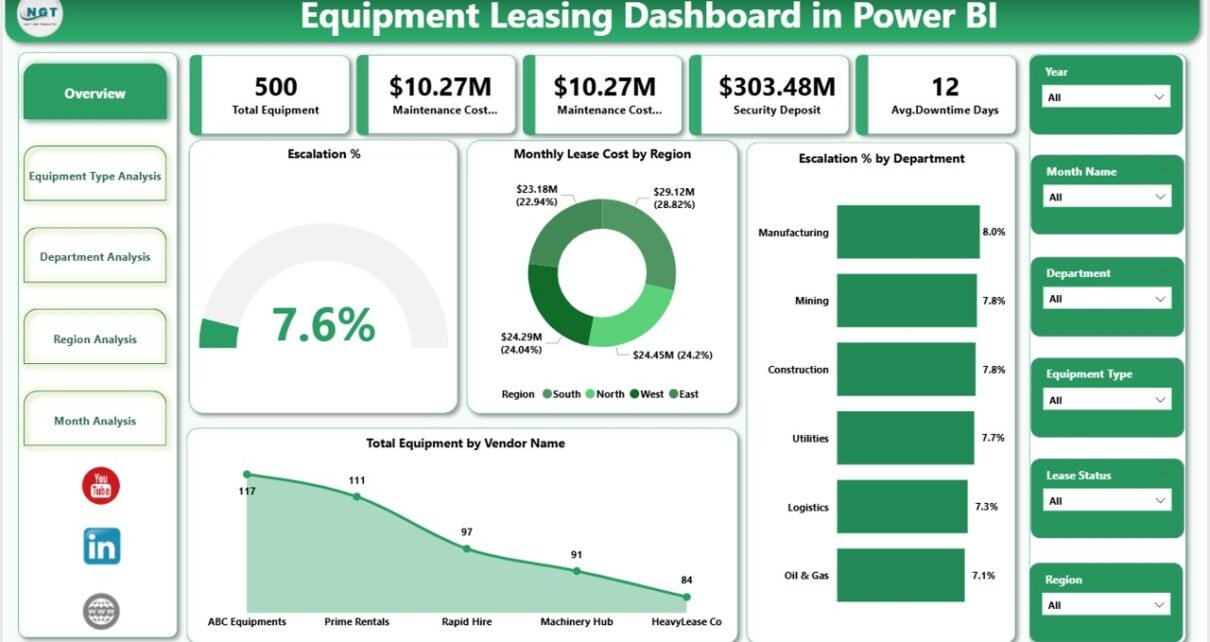
1. Overview Page – Your Lease Command Center
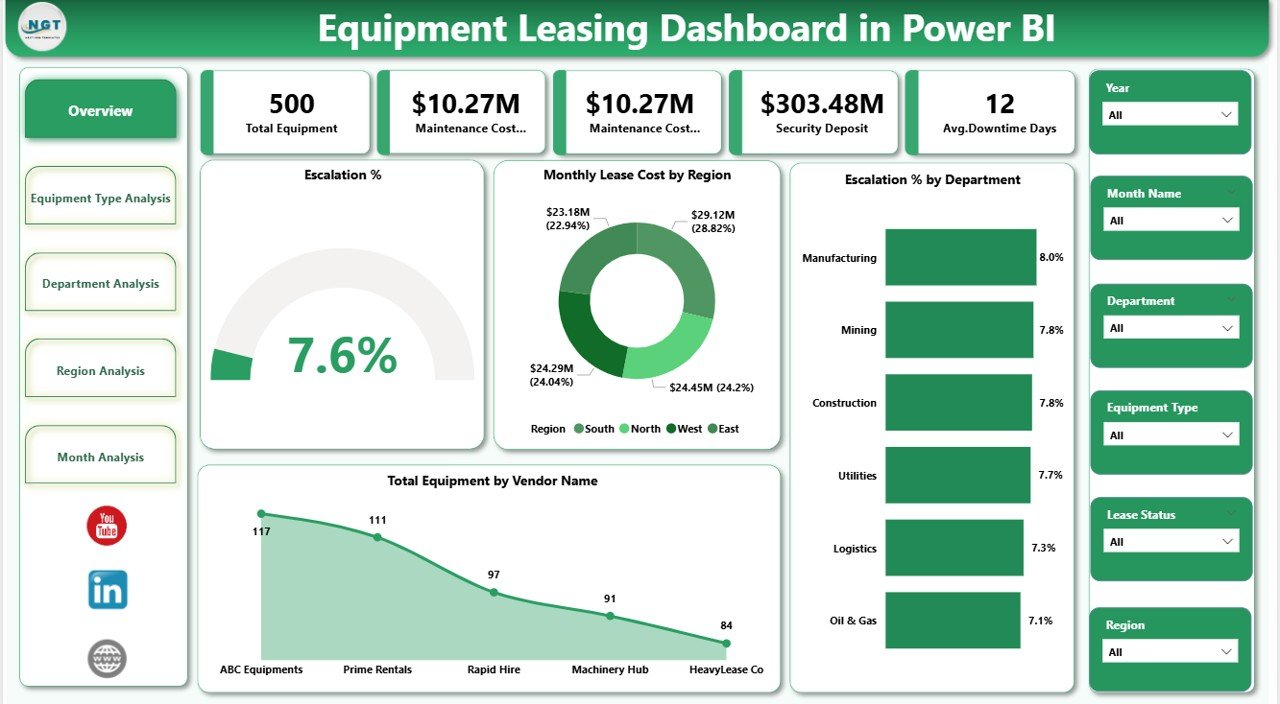
The Overview Page serves as the main control panel of the dashboard. It provides a high-level summary of leasing performance.
What Makes This Page Powerful?
On this page, you will find interactive slicers that allow users to filter data dynamically. Therefore, managers can instantly focus on specific periods, departments, or regions.
KPI Cards Included
The dashboard displays five important KPI cards such as:
-
Escalation %
-
Monthly Lease Cost by Region
-
Escalation % by Department
-
Total Equipment by Vendor Name
-
(Additional summary card based on dataset)
Because of these cards, decision-makers can quickly assess overall leasing health.
Key Visual Insights
Additionally, this page highlights:
-
Regional lease cost distribution
-
Department-wise escalation trends
-
Vendor equipment concentration
Consequently, leaders can identify cost drivers within seconds.
Click to Purchases Equipment Leasing Dashboard in Power BI
2. Equipment Type Analysis – Deep Dive into Asset Categories
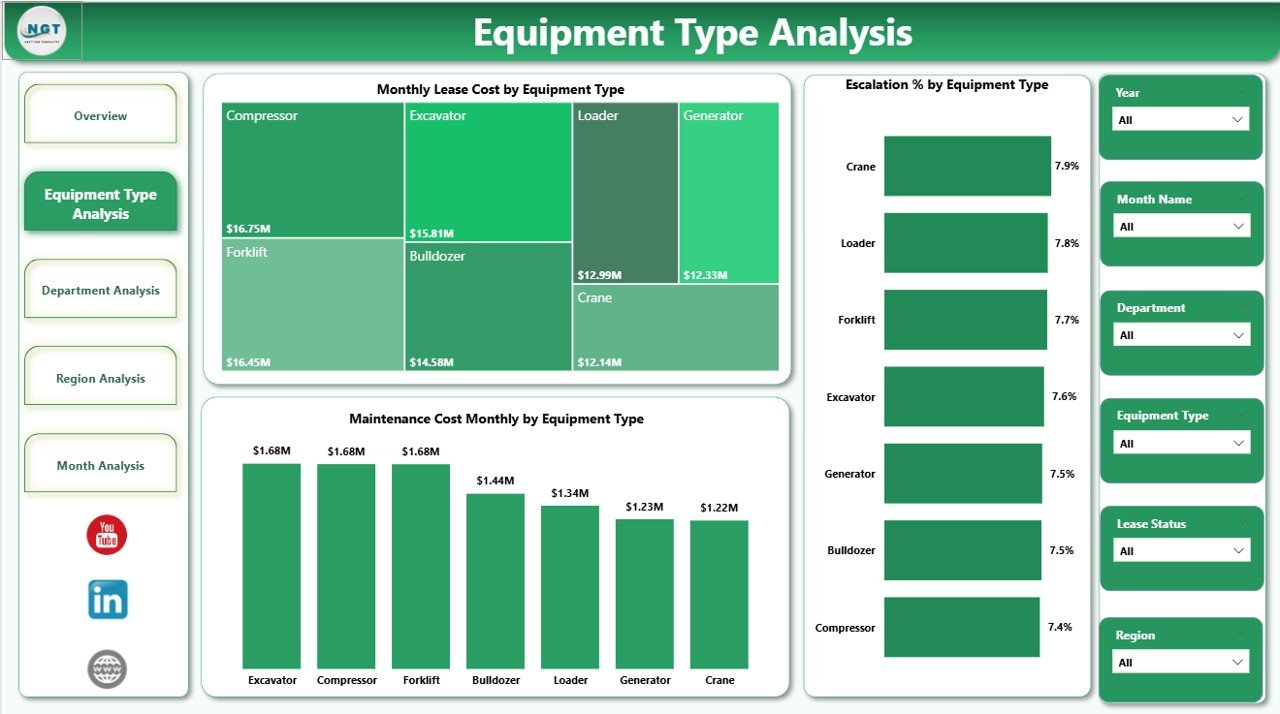
The Equipment Type Analysis page focuses on performance by equipment category. This page helps organizations understand which equipment types drive the highest costs.
Interactive Capability
Just like the overview page, this section includes slicers. Therefore, users can filter by time, region, or department.
Charts Available on This Page
This page contains three powerful visuals:
-
Escalation % by Equipment Type
-
Monthly Lease Cost by Equipment Type
-
Maintenance Cost Monthly by Equipment Type
Why This Page Matters
Because equipment categories behave differently, this analysis helps you:
-
Identify high-cost equipment
-
Monitor escalation patterns
-
Track maintenance-heavy assets
-
Optimize leasing strategy
As a result, procurement teams can negotiate better lease terms.
3. Department Analysis – Monitor Internal Cost Centers
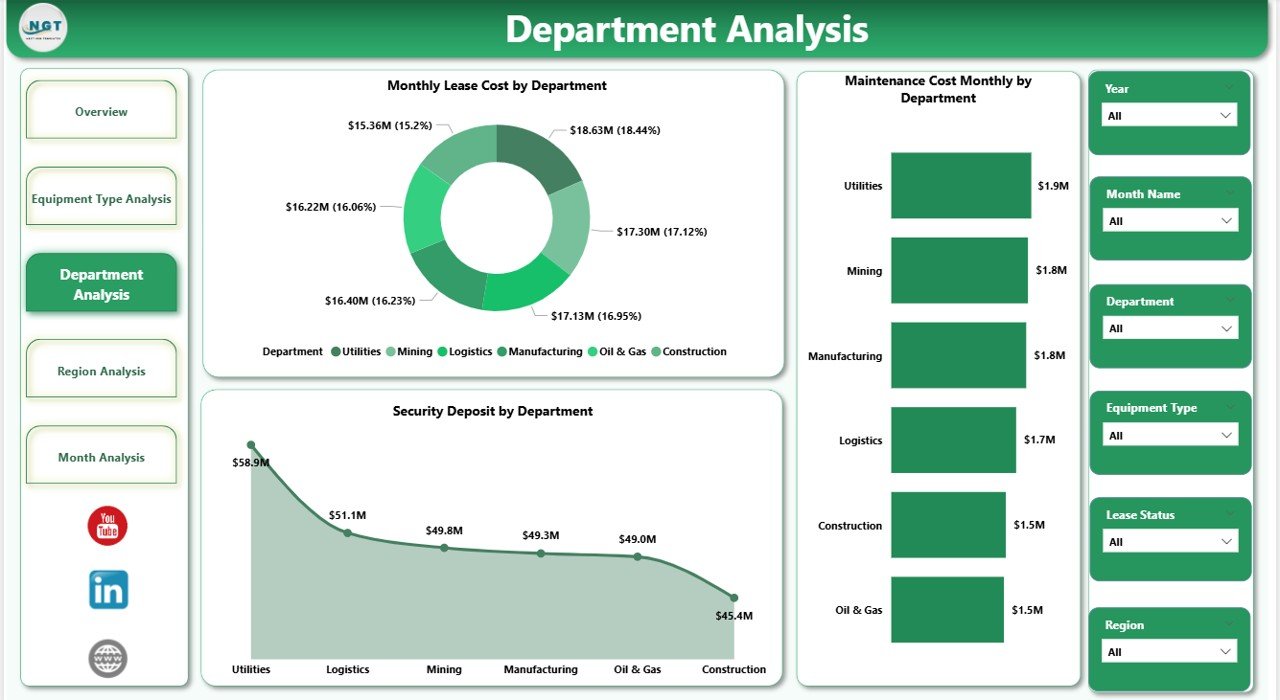
The Department Analysis page provides visibility into how each department uses leased equipment.
Many organizations struggle with departmental accountability. However, this page solves that problem effectively.
Interactive Filters
The slicers allow users to focus on specific time frames or business units. Therefore, managers can quickly evaluate departmental performance.
Charts Included
This page includes three critical visuals:
-
Security Deposit by Department
-
Monthly Lease Cost by Department
-
Maintenance Cost Monthly by Department
Business Value of This Page
With this analysis, organizations can:
-
Identify high-spending departments
-
Monitor security deposit exposure
-
Track maintenance responsibility
-
Improve internal cost control
Consequently, finance teams gain stronger budget governance.
Click to Purchases Equipment Leasing Dashboard in Power BI
4. Region Analysis – Geographic Cost Intelligence
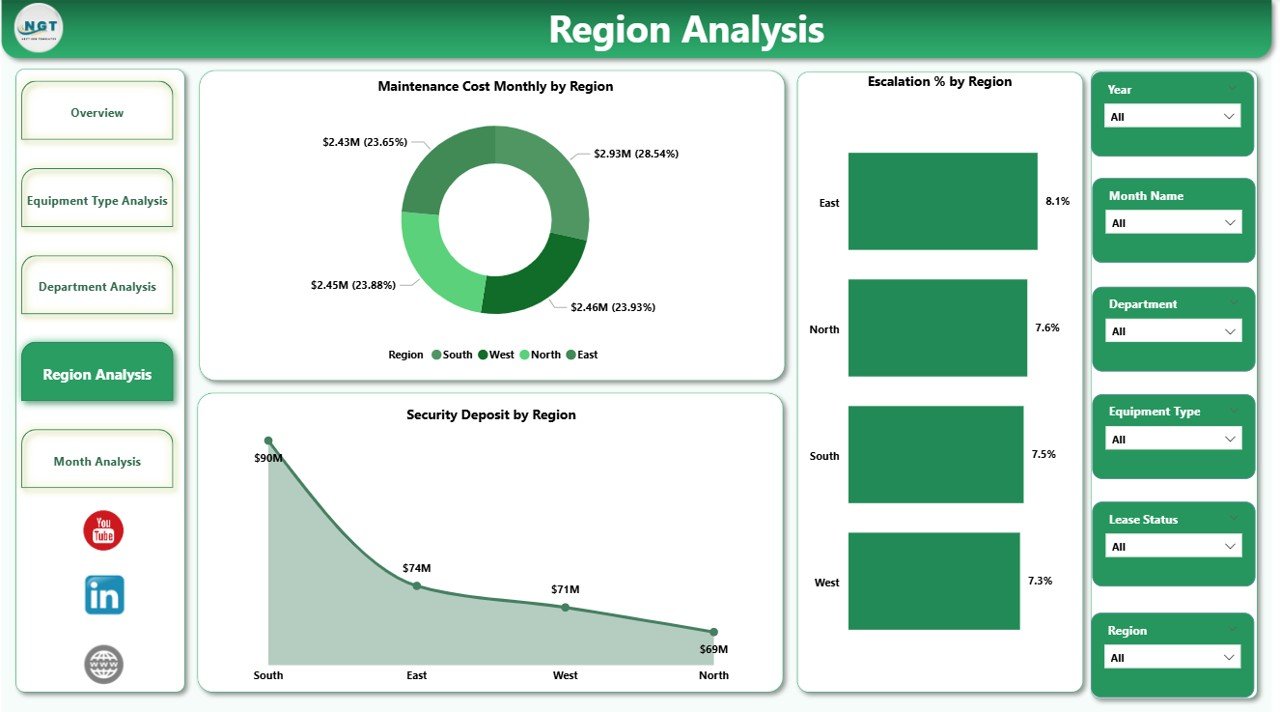
The Region Analysis page delivers location-based insights. Since leasing costs often vary by region, this page becomes extremely valuable.
Smart Filtering
Users can apply slicers to analyze specific regions or time periods. As a result, geographic comparisons become effortless.
Visualizations on This Page
This section includes three important charts:
-
Security Deposit by Region
-
Escalation % by Region
-
Maintenance Cost Monthly by Region
Why Regional Analysis Is Critical
Because market conditions differ across locations, this page helps you:
-
Detect high-cost regions
-
Compare escalation trends geographically
-
Monitor maintenance expenses by location
-
Optimize regional leasing strategy
Therefore, organizations can allocate resources more effectively.
5. Month Analysis – Track Time-Based Trends
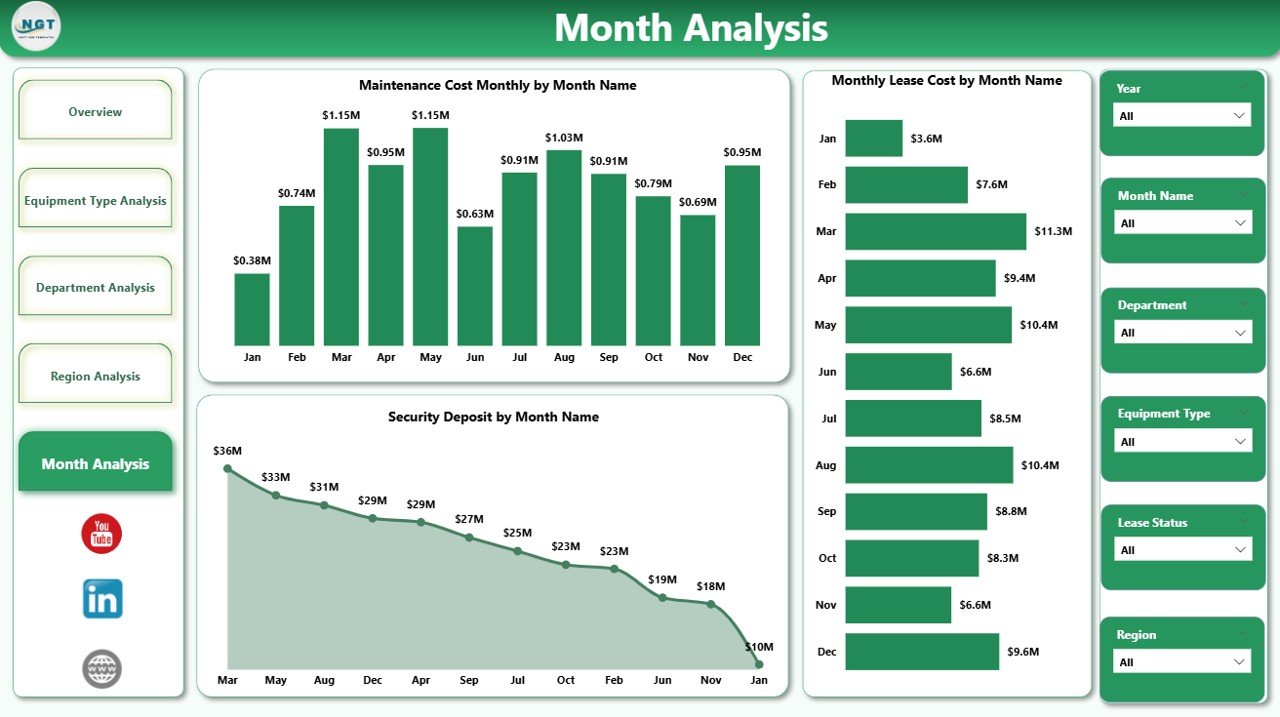
The Month Analysis page focuses on time intelligence. This page helps users understand how leasing costs evolve over time.
Charts Included
You will find three time-based visuals:
-
Security Deposit by Month
-
Monthly Lease Cost by Month
-
Maintenance Cost Monthly by Month
-
Click to Purchases Equipment Leasing Dashboard in Power BI
Strategic Benefits
With monthly analysis, businesses can:
-
Detect seasonal cost spikes
-
Monitor monthly trends
-
Forecast future expenses
-
Improve financial planning
As a result, leadership teams can take proactive action instead of reacting late.
Advantages of Equipment Leasing Dashboard in Power BI
Implementing this dashboard delivers significant operational and financial benefits. Let us explore the major advantages.
🚀 Real-Time Visibility
-
Monitor leasing performance instantly
-
Eliminate manual report delays
-
Access up-to-date insights
-
Improve decision speed
Because of real-time analytics, teams stay proactive.
💰 Better Cost Control
-
Track monthly lease expenses
-
Identify cost-heavy equipment
-
Monitor escalation trends
-
Reduce unnecessary spending
Therefore, finance teams maintain stronger control over budgets.
📊 Improved Vendor Management
-
Analyze equipment by vendor
-
Identify vendor concentration risks
-
Support negotiation strategies
-
Improve procurement planning
As a result, organizations build stronger vendor relationships.
🔍 Enhanced Decision-Making
-
Use data-driven insights
-
Compare departments easily
-
Detect performance gaps
-
Prioritize optimization areas
Consequently, leadership makes smarter strategic moves.
⚡ Time-Saving Automation
-
Remove manual reporting
-
Reduce Excel dependency
-
Enable one-click filtering
-
Accelerate analysis workflow
Because automation reduces workload, teams focus on strategy instead of data preparation.
Best Practices for the Equipment Leasing Dashboard in Power BI
Click to Purchases Equipment Leasing Dashboard in Power BI
To maximize the value of this dashboard, organizations should follow proven best practices.
✅ Keep Your Data Clean
Always maintain structured and validated data.
-
Standardize equipment names
-
Remove duplicate records
-
Validate lease amounts
-
Maintain consistent date formats
Clean data ensures accurate insights.
✅ Update Data Regularly
Schedule frequent data refreshes.
-
Use automated refresh when possible
-
Update monthly lease data
-
Review maintenance records
-
Validate escalation updates
Regular updates keep the dashboard reliable.
✅ Use Meaningful Filters
Configure slicers carefully.
-
Include Month slicer
-
Add Department filter
-
Enable Region selection
-
Provide Equipment Type filter
Well-designed filters improve user experience.
✅ Monitor High-Risk Areas First
Focus on the most impactful metrics.
-
High escalation percentages
-
Rising maintenance costs
-
Departments with heavy spending
-
Regions with abnormal trends
This approach helps teams act quickly.
✅ Train End Users
Even the best dashboard fails without proper adoption.
-
Provide user training
-
Share navigation guide
-
Explain KPI definitions
-
Encourage self-service analysis
Therefore, user adoption increases significantly.
How Can Businesses Use This Dashboard Effectively?
Organizations across industries can use this dashboard in multiple ways.
Finance Teams
They can:
-
Monitor lease liabilities
-
Track monthly expenses
-
Control budget overruns
-
Forecast future costs
Procurement Teams
They can:
-
Evaluate vendor performance
-
Optimize equipment mix
-
Negotiate better contracts
-
Reduce escalation impact
Operations Teams
They can:
-
Monitor equipment usage
-
Track maintenance costs
-
Improve asset utilization
-
Plan replacements
Because of this versatility, the dashboard becomes a cross-functional powerhouse.
Who Should Use the Equipment Leasing Dashboard?
Click to Purchases Equipment Leasing Dashboard in Power BI
This dashboard works best for:
-
CFOs and Finance Managers
-
Procurement Heads
-
Operations Managers
-
Asset Management Teams
-
Facility Managers
-
Business Analysts
If your organization manages leased equipment, this dashboard will deliver immediate value.
Conclusion
Equipment leasing involves significant financial commitments. However, without proper monitoring, organizations often lose visibility into costs, escalation trends, and maintenance expenses.
The Equipment Leasing Dashboard in Power BI solves this challenge by providing a centralized, interactive, and real-time analytics platform. It transforms raw lease data into clear, actionable insights.
Moreover, with its five powerful analytical pages—Overview, Equipment Type, Department, Region, and Month Analysis—this dashboard empowers decision-makers at every level.
If your organization wants to reduce leasing costs, improve vendor management, and strengthen financial control, this Power BI dashboard offers the perfect solution.
Now is the time to stop managing leases blindly and start managing them intelligently.
Frequently Asked Questions (FAQs)
❓ What does the Equipment Leasing Dashboard in Power BI track?
The dashboard tracks key leasing metrics such as escalation percentage, monthly lease cost, maintenance expenses, security deposits, and equipment distribution by vendor, department, and region.
❓ Can I customize the dashboard?
Yes, you can fully customize the dashboard. You can add new KPIs, modify visuals, change filters, and connect your own data sources based on business needs.
❓ How often should I refresh the data?
You should refresh the data at least monthly. However, if your organization handles high-volume leasing, you should enable automated or weekly refresh.
❓ Is this dashboard suitable for large organizations?
Absolutely. Power BI handles large datasets efficiently. Therefore, both mid-sized and enterprise organizations can use this dashboard without performance issues.
❓ Do I need advanced Power BI skills to use it?
No. The dashboard includes user-friendly slicers and visuals. After basic training, most business users can navigate and analyze data easily.
❓ What industries benefit the most from this dashboard?
Industries with heavy equipment leasing benefit the most, including:
-
Manufacturing
-
Construction
-
Healthcare
-
Logistics
-
IT infrastructure
Visit our YouTube channel to learn step-by-step video tutorials