In today’s fast-growing gaming industry, esports streaming has become a massive business. Millions of viewers watch live streams daily, and platforms generate huge revenue through ads, subscriptions, and donations. However, managing all this data can quickly become overwhelming.
Many streamers, esports organizations, and analysts struggle to track performance across platforms, games, and regions. As a result, they often miss key insights that could boost revenue and engagement.
That’s exactly where the Esports Streaming Dashboard in Power BI becomes a game-changing solution. 🚀
This powerful and ready-to-use dashboard helps you monitor costs, revenue, profit, and audience engagement—all in one place. Moreover, it transforms complex data into clear visuals, so you can make faster and smarter decisions.
In this detailed guide, you will learn everything about this dashboard, including its features, structure, advantages, best practices, and FAQs.
Click to Purchases Esports Streaming Dashboard in Power BI
📊 What is an Esports Streaming Dashboard in Power BI?
An Esports Streaming Dashboard in Power BI is an interactive analytics tool designed to track and analyze streaming performance across multiple platforms and games.
Instead of using scattered spreadsheets, you can manage all your streaming data in one centralized dashboard. Therefore, you save time, reduce errors, and improve visibility.
This dashboard helps you track:
-
💰 Total Cost, Revenue, and Profit
-
📈 Profit Margin %
-
👥 Average Concurrent Viewers
-
🎮 Game-wise performance
-
🌍 Regional insights
-
📺 Platform-wise revenue
Because Power BI offers real-time updates and interactive visuals, you can instantly analyze trends and take action.
🤔 Why Do You Need an Esports Streaming Dashboard?
Many esports teams and streamers rely on multiple tools to track performance. However, this approach creates confusion and delays.
On the other hand, a centralized dashboard solves these issues.
Here’s why you need it:
-
✅ It combines all data into one place
-
✅ It provides real-time insights
-
✅ It improves decision-making speed
-
✅ It helps increase revenue and engagement
-
✅ It identifies top-performing platforms and games
As a result, you gain complete control over your streaming performance.
🧩 Key Features of the Esports Streaming Dashboard in Power BI
This dashboard comes with 5 powerful and interactive pages, each designed for deep analysis.
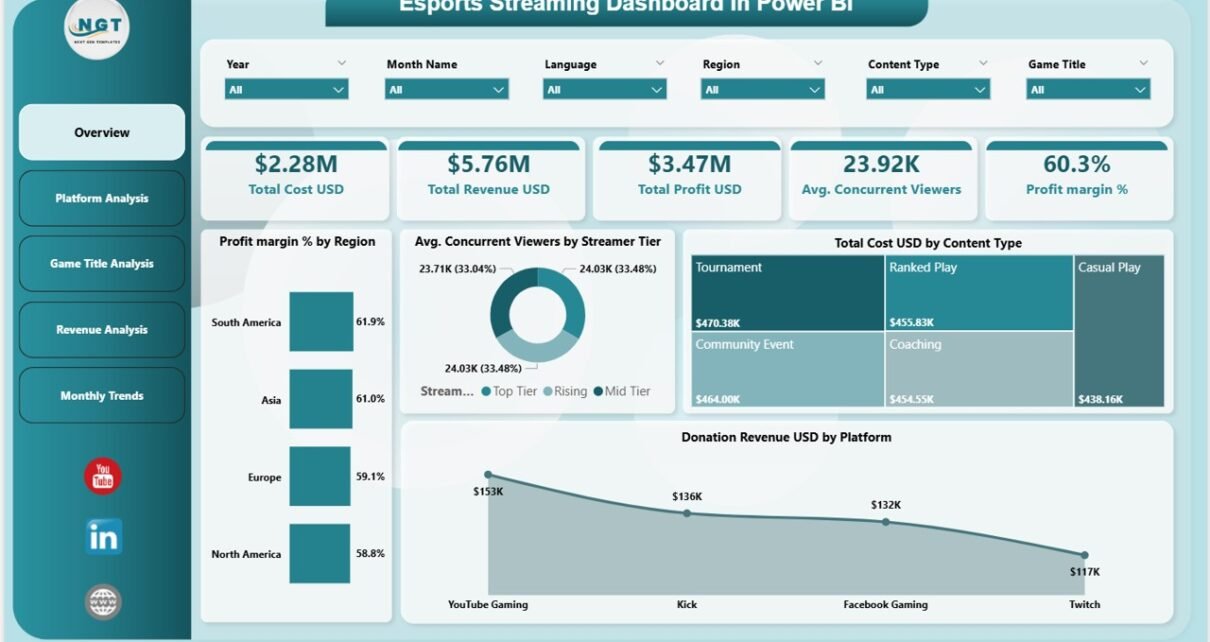
📌 1. Overview Page – Your Complete Performance Snapshot
The Overview Page acts as the main control center of the dashboard.
🔹 KPI Cards Included:
-
💰 Total Cost (USD)
-
💵 Total Revenue (USD)
-
📊 Total Profit (USD)
-
👥 Avg. Concurrent Viewers
-
📈 Profit Margin %
📊 Charts Available:
-
Profit Margin % by Region
-
Avg. Concurrent Viewers by Streamer Tier
-
Total Cost USD by Content Type
-
Donation Revenue USD by Platform
👉 Therefore, this page gives you a quick summary of your entire streaming performance.
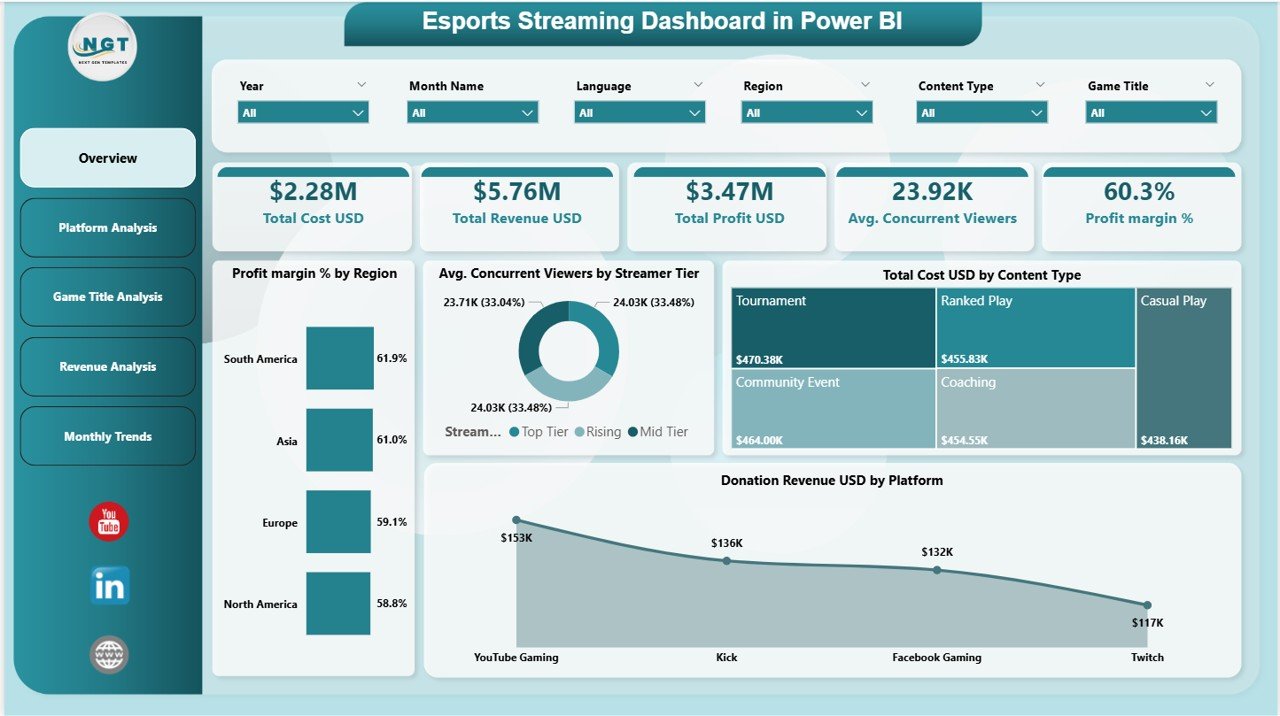
📺 2. Platform Analysis – Which Platform Performs Best?
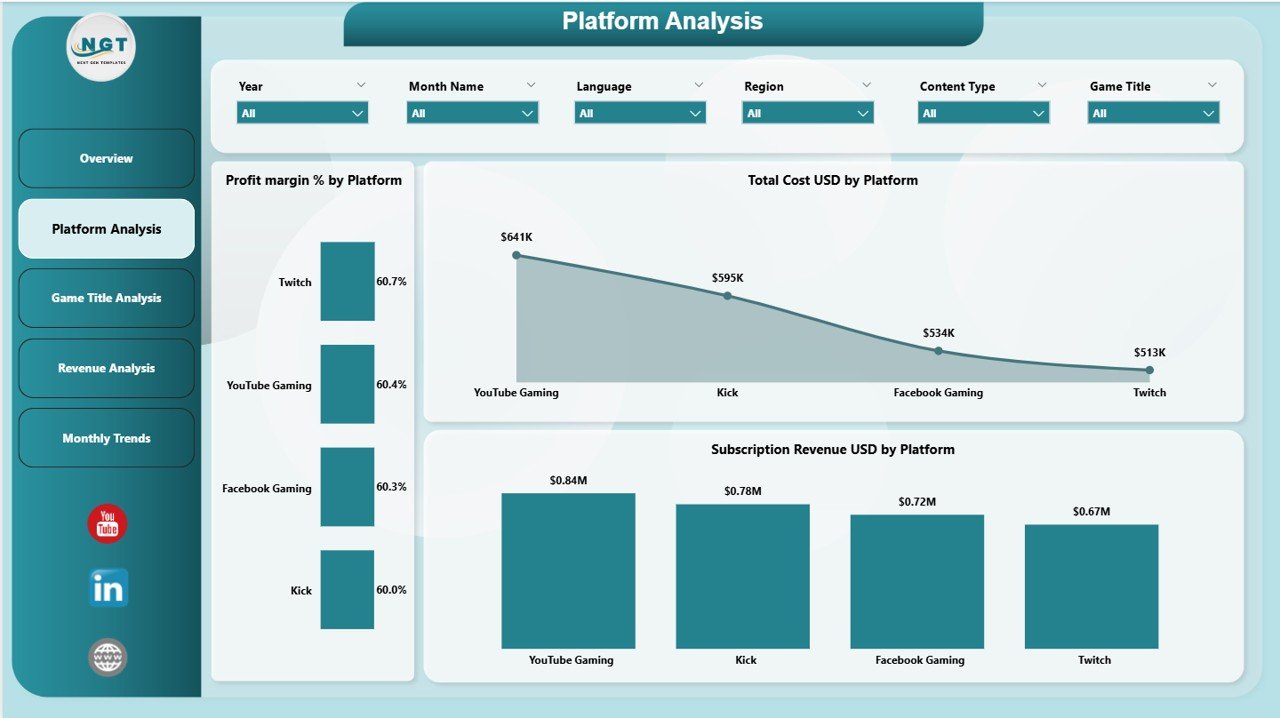
The Platform Analysis Page helps you compare performance across different streaming platforms.
📊 Charts Included:
-
Profit Margin % by Platform
-
Total Cost USD by Platform
-
Subscription Revenue USD by Platform
👉 As a result, you can identify which platform generates the highest profit and engagement.
🎮 3. Game Title Analysis – Which Games Drive Success?
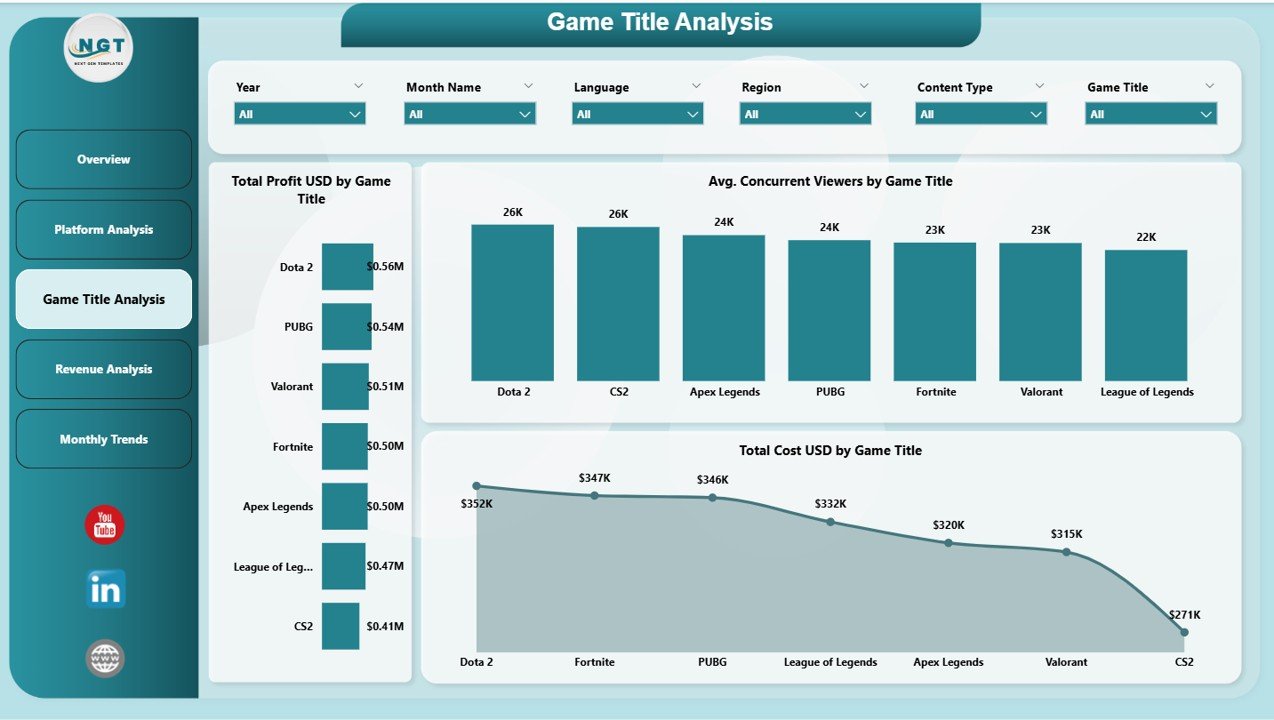
This page focuses on analyzing performance by game titles.
📊 Charts Included:
-
Total Profit USD by Game Title
-
Avg. Concurrent Viewers by Game Title
-
Total Cost USD by Game Title
👉 Therefore, you can easily identify which games attract more viewers and generate higher revenue.
💸 4. Revenue Analysis – Where Does Your Money Come From?
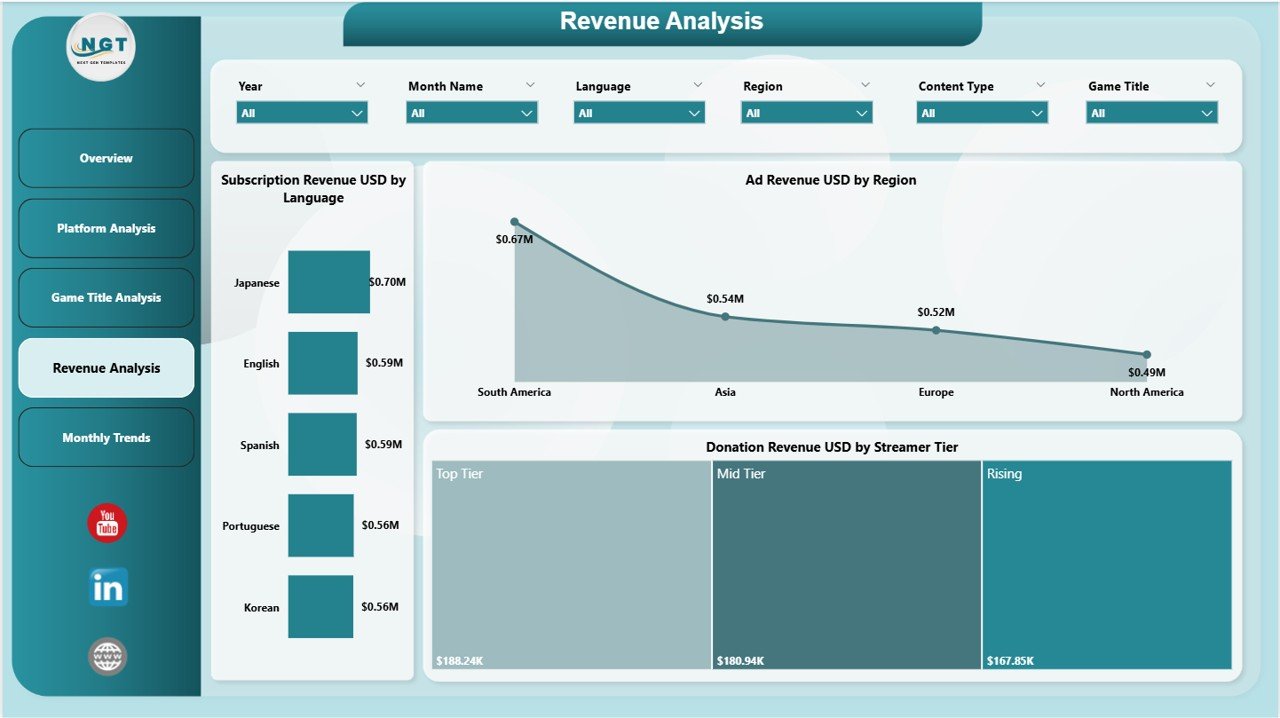
The Revenue Analysis Page gives you a deeper look into revenue streams.
📊 Charts Included:
-
Subscription Revenue USD by Language
-
Ad Revenue USD by Region
-
Donation Revenue USD by Streamer Tier
👉 As a result, you can understand your revenue sources and optimize your monetization strategy.
Click to Purchases Esports Streaming Dashboard in Power BI
📅 5. Monthly Trends – Track Growth Over Time
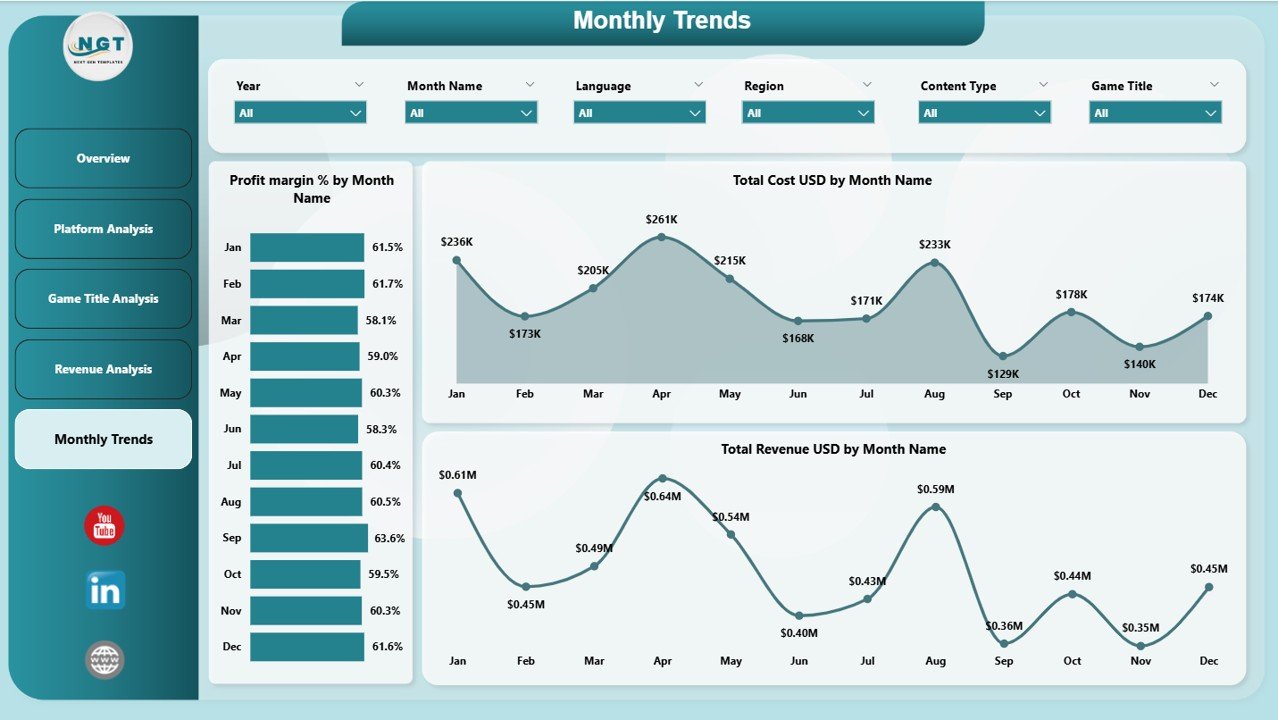
This page helps you monitor performance trends over time.
📊 Charts Included:
-
Profit Margin % by Month
-
Total Cost USD by Month
-
Total Revenue USD by Month
👉 Therefore, you can track growth patterns and plan future strategies.
🚀 Advantages of Esports Streaming Dashboard in Power BI
Using this dashboard offers several powerful benefits.
🌟 Key Advantages:
-
Better Decision Making
You get clear insights, so you can make faster and smarter decisions. -
Improved Revenue Tracking
You can easily monitor all revenue streams in one place. -
Enhanced Viewer Analysis
You understand audience behavior and engagement levels. -
Time-Saving Solution
You avoid manual calculations and reduce workload. -
Centralized Data Management
You manage everything in one dashboard instead of multiple files. -
Real-Time Insights
You can instantly analyze performance and trends.
⚙️ How to Use the Esports Streaming Dashboard in Power BI?
Using this dashboard is simple and user-friendly.
Follow these steps:
-
Import Your Data
Load your streaming data into Power BI. -
Update Data Sources
Connect your datasets to the dashboard. -
Use Filters (Slicers)
Select platform, region, or game for analysis. -
Analyze KPI Cards
Check key metrics like profit, revenue, and viewers. -
Explore Charts
Drill down into detailed insights. -
Track Monthly Trends
Monitor growth and performance changes.
👉 As a result, you can quickly turn data into actionable insights.
📈 Best Practices for the Esports Streaming Dashboard
To get the most out of your dashboard, follow these best practices:
✅ Best Practices:
-
Keep Data Updated Regularly
Always use fresh data for accurate insights. -
Focus on Key KPIs
Track only the most important metrics. -
Use Filters Effectively
Analyze data by platform, region, and game. -
Monitor Trends Frequently
Check monthly trends to identify patterns. -
Optimize Revenue Streams
Focus on high-performing platforms and games. -
Avoid Data Overload
Keep the dashboard clean and simple.
🔍 Opportunities for Improvement in Esports Streaming Analytics
Even with a powerful dashboard, you can still improve your strategy.
💡 Areas to Improve:
-
Analyze viewer retention rates
-
Track peak streaming hours
-
Improve content type performance
-
Optimize ad placements
-
Increase subscriber engagement
👉 Therefore, continuous improvement helps you stay ahead in the competitive esports industry.
🏆 Who Can Benefit from This Dashboard?
This dashboard serves a wide range of users.
👥 Ideal Users:
-
🎮 Esports Teams
-
📺 Streamers and Content Creators
-
📊 Data Analysts
-
🏢 Gaming Companies
-
💼 Marketing Teams
👉 As a result, anyone involved in esports streaming can benefit from this tool.
🔮 Future of Esports Analytics with Power BI
The esports industry continues to grow rapidly. Therefore, data analytics will play an even bigger role.
With tools like Power BI:
-
You can integrate AI insights
-
You can predict viewer trends
-
You can automate reporting
-
You can improve monetization strategies
👉 As a result, dashboards like this will become essential for success.
📝 Conclusion
The Esports Streaming Dashboard in Power BI is a powerful and essential tool for anyone involved in esports streaming.
It helps you track performance, analyze revenue, and understand viewer behavior—all in one place. Moreover, it simplifies complex data into easy-to-understand visuals.
If you want to grow your streaming business, improve engagement, and maximize profit, this dashboard is the perfect solution.
Click to Purchases Esports Streaming Dashboard in Power BI
❓ Frequently Asked Questions (FAQs)
1. What is an Esports Streaming Dashboard in Power BI?
It is an interactive tool that helps track streaming performance, revenue, and viewer engagement using visual reports.
2. Who can use this dashboard?
Streamers, esports teams, analysts, and gaming companies can use it.
3. Does this dashboard support real-time data?
Yes, Power BI allows real-time or near real-time data updates.
4. Can I customize the dashboard?
Yes, you can modify charts, KPIs, and filters based on your needs.
5. What are the main KPIs in this dashboard?
Key KPIs include total revenue, total cost, profit, profit margin %, and average viewers.
6. Is Power BI required to use this dashboard?
Yes, you need Power BI Desktop or Service to use and interact with the dashboard.
7. How does this dashboard help increase revenue?
It identifies top-performing platforms, games, and revenue sources, so you can optimize your strategy.
Click to Purchases Esports Streaming Dashboard in Power BI
Visit our YouTube channel to learn step-by-step video tutorials